| Multiple Linear Regression - Estimated Regression Equation |
| bouw[t] = -39.6100382738278 -1.37967687409676mannen[t] + 2.15587514738497vrouwen[t] + 0.958850147549073voeding[t] + e[t] |
| Multiple Linear Regression - Ordinary Least Squares | |||||
| Variable | Parameter | S.D. | T-STAT H0: parameter = 0 | 2-tail p-value | 1-tail p-value |
| (Intercept) | -39.6100382738278 | 54.883119 | -0.7217 | 0.473419 | 0.23671 |
| mannen | -1.37967687409676 | 3.639731 | -0.3791 | 0.706052 | 0.353026 |
| vrouwen | 2.15587514738497 | 2.600637 | 0.829 | 0.410574 | 0.205287 |
| voeding | 0.958850147549073 | 0.279193 | 3.4344 | 0.001114 | 0.000557 |
| Multiple Linear Regression - Regression Statistics | |
| Multiple R | 0.464567423905489 |
| R-squared | 0.215822891354183 |
| Adjusted R-squared | 0.174550411951771 |
| F-TEST (value) | 5.22922040253227 |
| F-TEST (DF numerator) | 3 |
| F-TEST (DF denominator) | 57 |
| p-value | 0.00293789281644452 |
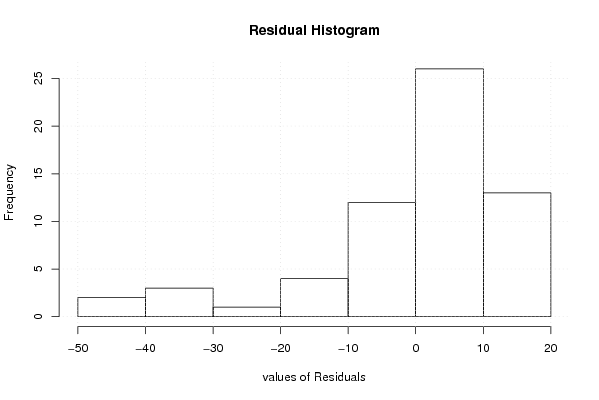
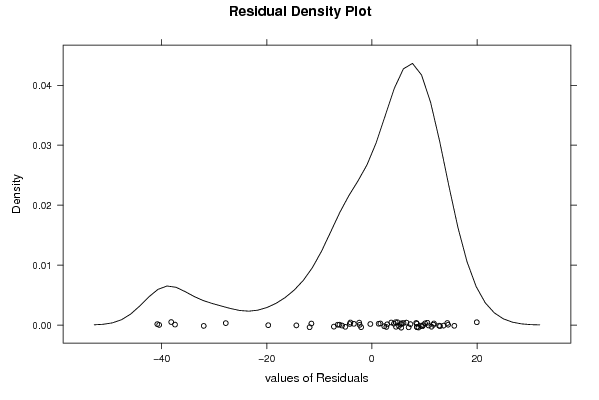
| Multiple Linear Regression - Residual Statistics | |
| Residual Standard Deviation | 14.7866480509924 |
| Sum Squared Residuals | 12462.7627532833 |
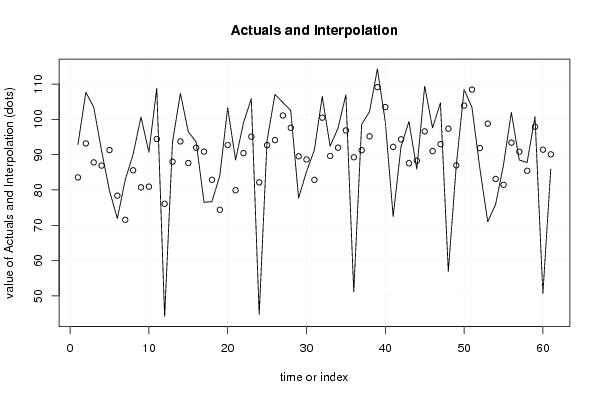
| Multiple Linear Regression - Actuals, Interpolation, and Residuals | |||
| Time or Index | Actuals | Interpolation Forecast | Residuals Prediction Error |
| 1 | 92.9 | 83.5566952091573 | 9.3433047908427 |
| 2 | 107.7 | 93.195055022964 | 14.504944977036 |
| 3 | 103.5 | 87.8150046749241 | 15.6849953250759 |
| 4 | 91.1 | 86.9099568694752 | 4.19004313052477 |
| 5 | 79.8 | 91.3079546585775 | -11.5079546585775 |
| 6 | 71.9 | 78.3872951518937 | -6.48729515189367 |
| 7 | 82.9 | 71.5556416190666 | 11.3443583809334 |
| 8 | 90.1 | 85.5858318503326 | 4.51416814966737 |
| 9 | 100.7 | 80.7439461421299 | 19.9560538578701 |
| 10 | 90.7 | 80.9360943179776 | 9.76390568202236 |
| 11 | 108.8 | 94.453658030561 | 14.3463419694389 |
| 12 | 44.1 | 76.0913701680762 | -31.9913701680762 |
| 13 | 93.6 | 88.0110968545562 | 5.58890314544378 |
| 14 | 107.4 | 93.7709801853336 | 13.6290198146664 |
| 15 | 96.5 | 87.6349543148597 | 8.86504568514028 |
| 16 | 93.6 | 91.9853171335046 | 1.61468286649538 |
| 17 | 76.5 | 90.8702341111198 | -14.3702341111198 |
| 18 | 76.7 | 82.8696952138077 | -6.1696952138077 |
| 19 | 84 | 74.3841789449185 | 9.61582105508151 |
| 20 | 103.3 | 92.7464668074033 | 10.5535331925967 |
| 21 | 88.5 | 79.9282378334551 | 8.57176216654486 |
| 22 | 99 | 90.4404304481588 | 8.55956955184115 |
| 23 | 105.9 | 95.1141266845782 | 10.7858733154218 |
| 24 | 44.7 | 82.1517626515776 | -37.4517626515776 |
| 25 | 94 | 92.7052816462601 | 1.29471835373987 |
| 26 | 107.1 | 94.1320741256406 | 12.9679258743594 |
| 27 | 104.8 | 101.114030089163 | 3.68596991083705 |
| 28 | 102.5 | 97.6200868853315 | 4.87991311466849 |
| 29 | 77.7 | 89.5474804584932 | -11.8474804584932 |
| 30 | 85.2 | 88.630712983599 | -3.43071298359891 |
| 31 | 91.3 | 82.865892428859 | 8.4341075711409 |
| 32 | 106.5 | 100.490469956336 | 6.00953004366404 |
| 33 | 92.4 | 89.6443586934262 | 2.75564130657377 |
| 34 | 97.5 | 91.9948423120197 | 5.50515768798032 |
| 35 | 107 | 96.8784325465392 | 10.1215674534608 |
| 36 | 51.1 | 89.2741465978703 | -38.1741465978703 |
| 37 | 98.6 | 91.2766273121182 | 7.32337268788184 |
| 38 | 102.2 | 95.2017455454266 | 6.99825445457343 |
| 39 | 114.3 | 109.147155357543 | 5.15284464245709 |
| 40 | 99.4 | 103.483393969023 | -4.08339396902264 |
| 41 | 72.5 | 92.2106667542604 | -19.7106667542604 |
| 42 | 92.3 | 94.3445696379372 | -2.04456963793725 |
| 43 | 99.4 | 87.5859768548145 | 11.8140231451855 |
| 44 | 85.9 | 88.311967520377 | -2.41196752037709 |
| 45 | 109.4 | 96.6128743515774 | 12.7871256484226 |
| 46 | 97.6 | 91.0205654187432 | 6.57943458125681 |
| 47 | 104.7 | 92.9767536521215 | 11.7232463478785 |
| 48 | 56.9 | 97.368584069581 | -40.4685840695810 |
| 49 | 86.7 | 86.9901782110005 | -0.290178211000469 |
| 50 | 108.5 | 103.915562218678 | 4.58443778132224 |
| 51 | 103.4 | 108.453135989208 | -5.05313598920799 |
| 52 | 86.2 | 91.8640352164309 | -5.6640352164309 |
| 53 | 71 | 98.7957546952995 | -27.7957546952995 |
| 54 | 75.9 | 83.1295887690594 | -7.22958876905944 |
| 55 | 87.1 | 81.463628217214 | 5.63637178278597 |
| 56 | 102 | 93.4143329807436 | 8.58566701925643 |
| 57 | 88.5 | 90.832598174182 | -2.33259817418197 |
| 58 | 87.8 | 85.444772160481 | 2.35522783951893 |
| 59 | 100.8 | 97.8899505971746 | 2.91004940282537 |
| 60 | 50.6 | 91.4229568621009 | -40.8229568621009 |
| 61 | 85.9 | 90.0988318429583 | -4.19883184295828 |
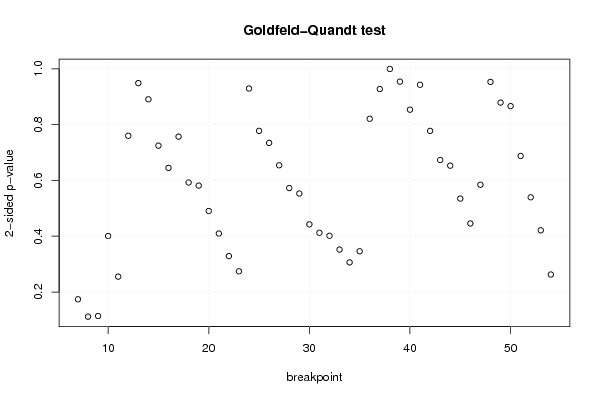
| Goldfeld-Quandt test for Heteroskedasticity | |||
| p-values | Alternative Hypothesis | ||
| breakpoint index | greater | 2-sided | less |
| 7 | 0.0869808899232209 | 0.173961779846442 | 0.913019110076779 |
| 8 | 0.0558306425119368 | 0.111661285023874 | 0.944169357488063 |
| 9 | 0.0569387957591162 | 0.113877591518232 | 0.943061204240884 |
| 10 | 0.200363044767714 | 0.400726089535428 | 0.799636955232286 |
| 11 | 0.127524030766648 | 0.255048061533296 | 0.872475969233352 |
| 12 | 0.620118892048027 | 0.759762215903946 | 0.379881107951973 |
| 13 | 0.525781175447762 | 0.948437649104476 | 0.474218824552238 |
| 14 | 0.445277267452509 | 0.890554534905018 | 0.554722732547491 |
| 15 | 0.362213513604335 | 0.72442702720867 | 0.637786486395665 |
| 16 | 0.322298421856369 | 0.644596843712739 | 0.67770157814363 |
| 17 | 0.378364208124817 | 0.756728416249633 | 0.621635791875183 |
| 18 | 0.29612140390084 | 0.59224280780168 | 0.70387859609916 |
| 19 | 0.290657870639409 | 0.581315741278819 | 0.70934212936059 |
| 20 | 0.245072980558099 | 0.490145961116198 | 0.754927019441901 |
| 21 | 0.204769807535363 | 0.409539615070726 | 0.795230192464637 |
| 22 | 0.164336344048412 | 0.328672688096824 | 0.835663655951588 |
| 23 | 0.137108288480980 | 0.274216576961961 | 0.86289171151902 |
| 24 | 0.464602834579341 | 0.929205669158681 | 0.535397165420659 |
| 25 | 0.388696224614482 | 0.777392449228964 | 0.611303775385518 |
| 26 | 0.367107863411229 | 0.734215726822459 | 0.632892136588771 |
| 27 | 0.327059598876713 | 0.654119197753427 | 0.672940401123287 |
| 28 | 0.286219999488337 | 0.572439998976674 | 0.713780000511663 |
| 29 | 0.276488780495954 | 0.552977560991908 | 0.723511219504046 |
| 30 | 0.221251859143485 | 0.442503718286971 | 0.778748140856515 |
| 31 | 0.206080184678516 | 0.412160369357032 | 0.793919815321484 |
| 32 | 0.200719900121131 | 0.401439800242262 | 0.799280099878869 |
| 33 | 0.176046370206925 | 0.35209274041385 | 0.823953629793075 |
| 34 | 0.153043384522139 | 0.306086769044278 | 0.84695661547786 |
| 35 | 0.172988353220343 | 0.345976706440685 | 0.827011646779657 |
| 36 | 0.589592866693148 | 0.820814266613703 | 0.410407133306852 |
| 37 | 0.536348607394194 | 0.927302785211611 | 0.463651392605806 |
| 38 | 0.499652970003485 | 0.99930594000697 | 0.500347029996515 |
| 39 | 0.476912937733721 | 0.953825875467442 | 0.523087062266279 |
| 40 | 0.426701758743855 | 0.85340351748771 | 0.573298241256145 |
| 41 | 0.471264986311278 | 0.942529972622556 | 0.528735013688722 |
| 42 | 0.388636539145957 | 0.777273078291914 | 0.611363460854043 |
| 43 | 0.336504987317002 | 0.673009974634003 | 0.663495012682998 |
| 44 | 0.326365361188351 | 0.652730722376703 | 0.673634638811649 |
| 45 | 0.267407231637268 | 0.534814463274537 | 0.732592768362732 |
| 46 | 0.222784318676479 | 0.445568637352958 | 0.77721568132352 |
| 47 | 0.292143130563751 | 0.584286261127502 | 0.707856869436249 |
| 48 | 0.523557199822189 | 0.952885600355622 | 0.476442800177811 |
| 49 | 0.439338775700721 | 0.878677551401443 | 0.560661224299279 |
| 50 | 0.43299535379113 | 0.86599070758226 | 0.56700464620887 |
| 51 | 0.343808093950182 | 0.687616187900364 | 0.656191906049818 |
| 52 | 0.269737797077808 | 0.539475594155615 | 0.730262202922192 |
| 53 | 0.210513214293832 | 0.421026428587664 | 0.789486785706168 |
| 54 | 0.131333076512837 | 0.262666153025675 | 0.868666923487162 |
| Meta Analysis of Goldfeld-Quandt test for Heteroskedasticity | |||
| Description | # significant tests | % significant tests | OK/NOK |
| 1% type I error level | 0 | 0 | OK |
| 5% type I error level | 0 | 0 | OK |
| 10% type I error level | 0 | 0 | OK |