| Multiple Linear Regression - Estimated Regression Equation |
| Britse_pond[t] = + 0.114636991739404 -0.0565949872591202Zwitserse_frank[t] + 1.12444792345794`Britse_pond_-1`[t] -0.000546810967661961`Britse_pond_-2`[t] -0.259096619888014`Britse_pond_-3`[t] + 0.0820675914217389`Britse_pond_-4`[t] + 0.0101173405338365M1[t] -0.00198837719947519M2[t] + 0.00440236865833959M3[t] + 0.00684260124238548M4[t] -0.000281218482007058M5[t] + 0.00516663440438992M6[t] + 0.00236758392844985M7[t] + 0.00385981556788097M8[t] + 0.00338930082332849M9[t] -0.00207401615927181M10[t] + 0.00643574267259323M11[t] + 0.000137273166313686t + e[t] |
| Multiple Linear Regression - Ordinary Least Squares | |||||
| Variable | Parameter | S.D. | T-STAT H0: parameter = 0 | 2-tail p-value | 1-tail p-value |
| (Intercept) | 0.114636991739404 | 0.074497 | 1.5388 | 0.132139 | 0.066069 |
| Zwitserse_frank | -0.0565949872591202 | 0.075054 | -0.7541 | 0.45546 | 0.22773 |
| `Britse_pond_-1` | 1.12444792345794 | 0.161788 | 6.9501 | 0 | 0 |
| `Britse_pond_-2` | -0.000546810967661961 | 0.239349 | -0.0023 | 0.998189 | 0.499095 |
| `Britse_pond_-3` | -0.259096619888014 | 0.238048 | -1.0884 | 0.283264 | 0.141632 |
| `Britse_pond_-4` | 0.0820675914217389 | 0.176238 | 0.4657 | 0.644115 | 0.322058 |
| M1 | 0.0101173405338365 | 0.006141 | 1.6475 | 0.107704 | 0.053852 |
| M2 | -0.00198837719947519 | 0.005958 | -0.3338 | 0.7404 | 0.3702 |
| M3 | 0.00440236865833959 | 0.006451 | 0.6824 | 0.499138 | 0.249569 |
| M4 | 0.00684260124238548 | 0.006066 | 1.1281 | 0.266353 | 0.133176 |
| M5 | -0.000281218482007058 | 0.006061 | -0.0464 | 0.963238 | 0.481619 |
| M6 | 0.00516663440438992 | 0.006088 | 0.8487 | 0.401372 | 0.200686 |
| M7 | 0.00236758392844985 | 0.005884 | 0.4024 | 0.689638 | 0.344819 |
| M8 | 0.00385981556788097 | 0.006028 | 0.6403 | 0.525823 | 0.262911 |
| M9 | 0.00338930082332849 | 0.006231 | 0.544 | 0.589646 | 0.294823 |
| M10 | -0.00207401615927181 | 0.006309 | -0.3288 | 0.744147 | 0.372074 |
| M11 | 0.00643574267259323 | 0.006382 | 1.0084 | 0.319657 | 0.159829 |
| t | 0.000137273166313686 | 0.00013 | 1.0526 | 0.299195 | 0.149597 |
| Multiple Linear Regression - Regression Statistics | |
| Multiple R | 0.973540091625546 |
| R-squared | 0.947780310002276 |
| Adjusted R-squared | 0.924418869740136 |
| F-TEST (value) | 40.5702858799454 |
| F-TEST (DF numerator) | 17 |
| F-TEST (DF denominator) | 38 |
| p-value | 0 |
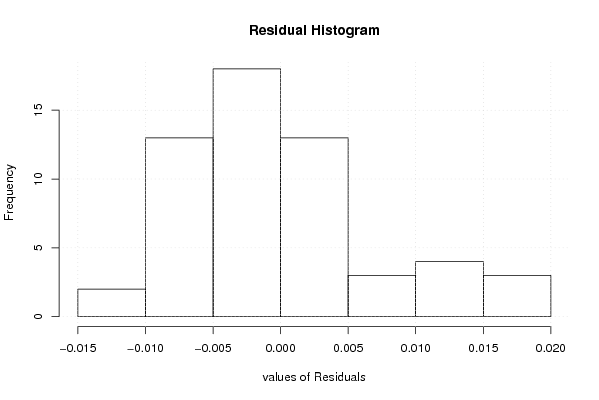
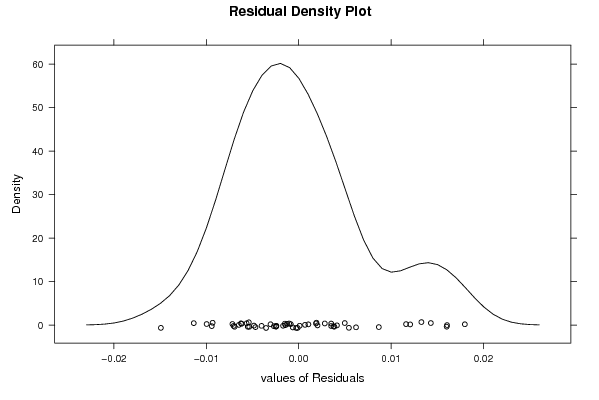
| Multiple Linear Regression - Residual Statistics | |
| Residual Standard Deviation | 0.00872717634948795 |
| Sum Squared Residuals | 0.00289421706733235 |
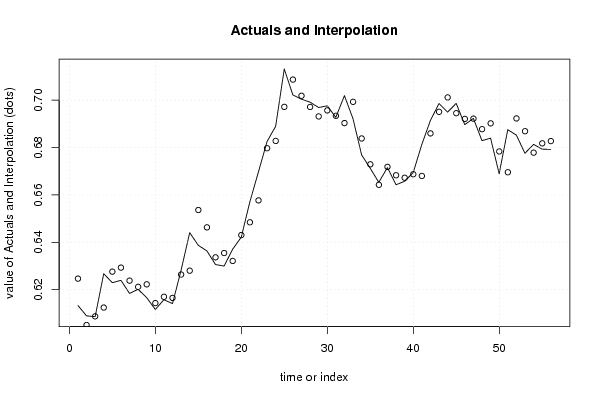
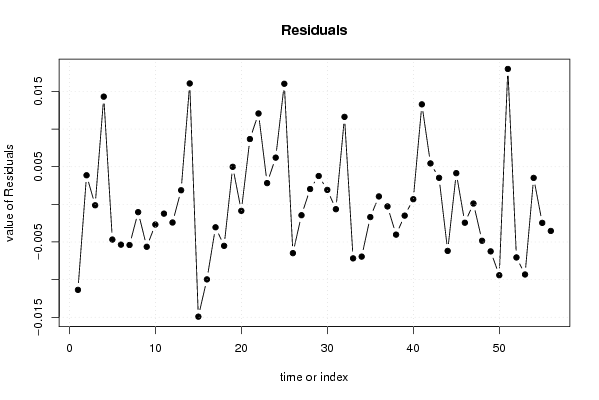
| Multiple Linear Regression - Actuals, Interpolation, and Residuals | |||
| Time or Index | Actuals | Interpolation Forecast | Residuals Prediction Error |
| 1 | 0.61328 | 0.624640860936968 | -0.0113608609369677 |
| 2 | 0.6089 | 0.605038988385295 | 0.00386101161470527 |
| 3 | 0.60857 | 0.608693297534306 | -0.000123297534305677 |
| 4 | 0.62672 | 0.612414561712568 | 0.0143054382874317 |
| 5 | 0.62291 | 0.627589745045723 | -0.00467974504572314 |
| 6 | 0.62393 | 0.629285985572241 | -0.0053559855722411 |
| 7 | 0.61838 | 0.62377927737256 | -0.00539927737256051 |
| 8 | 0.62012 | 0.621157506471576 | -0.00103750647157630 |
| 9 | 0.61659 | 0.622229521000326 | -0.00563952100032589 |
| 10 | 0.6116 | 0.614285134785 | -0.00268513478500017 |
| 11 | 0.61573 | 0.616965770013257 | -0.00123577001325742 |
| 12 | 0.61407 | 0.616484597669385 | -0.00241459766938451 |
| 13 | 0.62823 | 0.626360279913249 | 0.00186972008675103 |
| 14 | 0.64405 | 0.627992074017129 | 0.0160579259828712 |
| 15 | 0.6387 | 0.65361912726506 | -0.0149191272650592 |
| 16 | 0.63633 | 0.646299231751325 | -0.00996923175132522 |
| 17 | 0.63059 | 0.633640264137794 | -0.00305026413779446 |
| 18 | 0.62994 | 0.635451171765817 | -0.00551117176581673 |
| 19 | 0.63709 | 0.63210647090523 | 0.00498352909477051 |
| 20 | 0.64217 | 0.64303489120496 | -0.000864891204959784 |
| 21 | 0.65711 | 0.648435531133738 | 0.00867446886626213 |
| 22 | 0.66977 | 0.6577001232951 | 0.0120698767048996 |
| 23 | 0.68255 | 0.67972621962479 | 0.00282378037521004 |
| 24 | 0.68902 | 0.682814866659478 | 0.00620513334052245 |
| 25 | 0.71322 | 0.697202632531643 | 0.0160173674683568 |
| 26 | 0.70224 | 0.708721179076764 | -0.00648117907676355 |
| 27 | 0.70045 | 0.701894128346416 | -0.00144412834641643 |
| 28 | 0.69919 | 0.697155837316589 | 0.00203416268341068 |
| 29 | 0.69693 | 0.693165578859644 | 0.00376442114035555 |
| 30 | 0.69763 | 0.695710567896963 | 0.00191943210303661 |
| 31 | 0.69278 | 0.693422453312738 | -0.000642453312737655 |
| 32 | 0.70196 | 0.690340493059181 | 0.0116195069408186 |
| 33 | 0.69215 | 0.699325971704917 | -0.007175971704917 |
| 34 | 0.6769 | 0.683842358553382 | -0.00694235855338182 |
| 35 | 0.67124 | 0.67293259706391 | -0.0016925970639105 |
| 36 | 0.66532 | 0.664269327851756 | 0.00105067214824406 |
| 37 | 0.67157 | 0.671848391489266 | -0.000278391489266206 |
| 38 | 0.66428 | 0.668303115399183 | -0.00402311539918325 |
| 39 | 0.66576 | 0.667258400014424 | -0.00149840001442421 |
| 40 | 0.66942 | 0.668736719577007 | 0.000683280422992628 |
| 41 | 0.6813 | 0.668017561999982 | 0.0132824380000182 |
| 42 | 0.69144 | 0.686005689809962 | 0.00543431019003803 |
| 43 | 0.69862 | 0.695100979468859 | 0.00351902053114107 |
| 44 | 0.695 | 0.701183169430719 | -0.00618316943071869 |
| 45 | 0.69867 | 0.69452897616102 | 0.00414102383898078 |
| 46 | 0.68968 | 0.692122383366518 | -0.00244238336651763 |
| 47 | 0.69233 | 0.692225413298042 | 0.000104586701957885 |
| 48 | 0.68293 | 0.687771207819382 | -0.00484120781938201 |
| 49 | 0.68399 | 0.690237835128874 | -0.00624783512887399 |
| 50 | 0.66895 | 0.67836464312163 | -0.00941464312162963 |
| 51 | 0.68756 | 0.669575046839794 | 0.0179849531602055 |
| 52 | 0.68527 | 0.69232364964251 | -0.00705364964250976 |
| 53 | 0.6776 | 0.686916849956856 | -0.00931684995685614 |
| 54 | 0.68137 | 0.677856584955017 | 0.00351341504498319 |
| 55 | 0.67933 | 0.681790818940613 | -0.00246081894061341 |
| 56 | 0.67922 | 0.682753939833564 | -0.00353393983356378 |
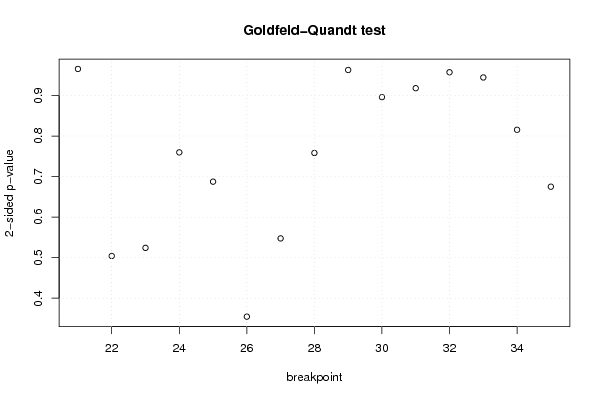
| Goldfeld-Quandt test for Heteroskedasticity | |||
| p-values | Alternative Hypothesis | ||
| breakpoint index | greater | 2-sided | less |
| 21 | 0.517317116627362 | 0.965365766745276 | 0.482682883372638 |
| 22 | 0.747890290074132 | 0.504219419851735 | 0.252109709925868 |
| 23 | 0.737875272389856 | 0.524249455220289 | 0.262124727610144 |
| 24 | 0.620158929113562 | 0.759682141772876 | 0.379841070886438 |
| 25 | 0.656276509906873 | 0.687446980186254 | 0.343723490093127 |
| 26 | 0.822699765940368 | 0.354600468119265 | 0.177300234059632 |
| 27 | 0.726234970338066 | 0.547530059323868 | 0.273765029661934 |
| 28 | 0.62088807888979 | 0.758223842220421 | 0.379111921110211 |
| 29 | 0.518592909430766 | 0.962814181138469 | 0.481407090569234 |
| 30 | 0.447971804408402 | 0.895943608816804 | 0.552028195591598 |
| 31 | 0.458954632294838 | 0.917909264589676 | 0.541045367705162 |
| 32 | 0.478612284558085 | 0.95722456911617 | 0.521387715441915 |
| 33 | 0.47219329940616 | 0.94438659881232 | 0.52780670059384 |
| 34 | 0.407685981514617 | 0.815371963029234 | 0.592314018485383 |
| 35 | 0.662471918044358 | 0.675056163911283 | 0.337528081955642 |
| Meta Analysis of Goldfeld-Quandt test for Heteroskedasticity | |||
| Description | # significant tests | % significant tests | OK/NOK |
| 1% type I error level | 0 | 0 | OK |
| 5% type I error level | 0 | 0 | OK |
| 10% type I error level | 0 | 0 | OK |