Free Statistics

of Irreproducible Research!

Author's title

Author*The author of this computation has been verified*
R Software Modulerwasp_multipleregression.wasp
Title produced by softwareMultiple Regression
Date of computationFri, 20 Nov 2009 03:34:01 -0700
Cite this page as followsStatistical Computations at FreeStatistics.org, Office for Research Development and Education, URL https://freestatistics.org/blog/index.php?v=date/2009/Nov/20/t1258713337hhxeuxcbu6njcng.htm/, Retrieved Sat, 20 Apr 2024 12:12:36 +0000
Statistical Computations at FreeStatistics.org, Office for Research Development and Education, URL https://freestatistics.org/blog/index.php?pk=58016, Retrieved Sat, 20 Apr 2024 12:12:36 +0000
QR Codes:

Original text written by user:
IsPrivate?No (this computation is public)
User-defined keywordsworkshop 7
Estimated Impact181
Family? (F = Feedback message, R = changed R code, M = changed R Module, P = changed Parameters, D = changed Data)
-     [Multiple Regression] [Q1 The Seatbeltlaw] [2007-11-14 19:27:43] [8cd6641b921d30ebe00b648d1481bba0]
- RM D  [Multiple Regression] [Seatbelt] [2009-11-12 14:10:54] [b98453cac15ba1066b407e146608df68]
-    D      [Multiple Regression] [workshop 7] [2009-11-20 10:34:01] [6198946fb53eb5eb18db46bb758f7fde] [Current]
Feedback Forum

Post a new message
Dataseries X:
0,61328	1,5334	0,62168	0,62915	0,634	0,6348
0,6089	1,5225	0,61328	0,62168	0,62915	0,634
0,60857	1,5135	0,6089	0,61328	0,62168	0,62915
0,62672	1,5144	0,60857	0,6089	0,61328	0,62168
0,62291	1,4913	0,62672	0,60857	0,6089	0,61328
0,62393	1,4793	0,62291	0,62672	0,60857	0,6089
0,61838	1,4663	0,62393	0,62291	0,62672	0,60857
0,62012	1,4749	0,61838	0,62393	0,62291	0,62672
0,61659	1,4745	0,62012	0,61838	0,62393	0,62291
0,6116	1,4775	0,61659	0,62012	0,61838	0,62393
0,61573	1,4678	0,6116	0,61659	0,62012	0,61838
0,61407	1,4658	0,61573	0,6116	0,61659	0,62012
0,62823	1,4572	0,61407	0,61573	0,6116	0,61659
0,64405	1,4721	0,62823	0,61407	0,61573	0,6116
0,6387	1,4624	0,64405	0,62823	0,61407	0,61573
0,63633	1,4636	0,6387	0,64405	0,62823	0,61407
0,63059	1,4649	0,63633	0,6387	0,64405	0,62823
0,62994	1,465	0,63059	0,63633	0,6387	0,64405
0,63709	1,4673	0,62994	0,63059	0,63633	0,6387
0,64217	1,4679	0,63709	0,62994	0,63059	0,63633
0,65711	1,4621	0,64217	0,63709	0,62994	0,63059
0,66977	1,4674	0,65711	0,64217	0,63709	0,62994
0,68255	1,4695	0,66977	0,65711	0,64217	0,63709
0,68902	1,4964	0,68255	0,66977	0,65711	0,64217
0,71322	1,5155	0,68902	0,68255	0,66977	0,65711
0,70224	1,5411	0,71322	0,68902	0,68255	0,66977
0,70045	1,5476	0,70224	0,71322	0,68902	0,68255
0,69919	1,54	0,70045	0,70224	0,71322	0,68902
0,69693	1,5474	0,69919	0,70045	0,70224	0,71322
0,69763	1,5485	0,69693	0,69919	0,70045	0,70224
0,69278	1,559	0,69763	0,69693	0,69919	0,70045
0,70196	1,5544	0,69278	0,69763	0,69693	0,69919
0,69215	1,5657	0,70196	0,69278	0,69763	0,69693
0,6769	1,5734	0,69215	0,70196	0,69278	0,69763
0,67124	1,567	0,6769	0,69215	0,70196	0,69278
0,66532	1,5547	0,67124	0,6769	0,69215	0,70196
0,67157	1,54	0,66532	0,67124	0,6769	0,69215
0,66428	1,5192	0,67157	0,66532	0,67124	0,6769
0,66576	1,527	0,66428	0,67157	0,66532	0,67124
0,66942	1,5387	0,66576	0,66428	0,67157	0,66532
0,6813	1,5431	0,66942	0,66576	0,66428	0,67157
0,69144	1,5426	0,6813	0,66942	0,66576	0,66428
0,69862	1,5216	0,69144	0,6813	0,66942	0,66576
0,695	1,5364	0,69862	0,69144	0,6813	0,66942
0,69867	1,5469	0,695	0,69862	0,69144	0,6813
0,68968	1,5501	0,69867	0,695	0,69862	0,69144
0,69233	1,5494	0,68968	0,69867	0,695	0,69862
0,68293	1,5475	0,69233	0,68968	0,69867	0,695
0,68399	1,5448	0,68293	0,69233	0,68968	0,69867
0,66895	1,5391	0,68399	0,68293	0,69233	0,68968
0,68756	1,5578	0,66895	0,68399	0,68293	0,69233
0,68527	1,5528	0,68756	0,66895	0,68399	0,68293
0,6776	1,5496	0,68527	0,68756	0,66895	0,68399
0,68137	1,549	0,6776	0,68527	0,68756	0,66895
0,67933	1,5449	0,68137	0,6776	0,68527	0,68756
0,67922	1,5479	0,67933	0,68137	0,6776	0,68527


Summary of computational transaction
Raw Inputview raw input (R code)
Raw Outputview raw output of R engine
Computing time3 seconds
R Server'Gwilym Jenkins' @ 72.249.127.135

\begin{tabular}{lllllllll}
\hline
Summary of computational transaction \tabularnewline
Raw Input & view raw input (R code)  \tabularnewline
Raw Output & view raw output of R engine  \tabularnewline
Computing time & 3 seconds \tabularnewline
R Server & 'Gwilym Jenkins' @ 72.249.127.135 \tabularnewline
\hline
\end{tabular}
%Source: https://freestatistics.org/blog/index.php?pk=58016&T=0

[TABLE]
[ROW][C]Summary of computational transaction[/C][/ROW]
[ROW][C]Raw Input[/C][C]view raw input (R code) [/C][/ROW]
[ROW][C]Raw Output[/C][C]view raw output of R engine [/C][/ROW]
[ROW][C]Computing time[/C][C]3 seconds[/C][/ROW]
[ROW][C]R Server[/C][C]'Gwilym Jenkins' @ 72.249.127.135[/C][/ROW]
[/TABLE]
Source: https://freestatistics.org/blog/index.php?pk=58016&T=0

Globally Unique Identifier (entire table): ba.freestatistics.org/blog/index.php?pk=58016&T=0

As an alternative you can also use a QR Code:  

The GUIDs for individual cells are displayed in the table below:

Summary of computational transaction
Raw Inputview raw input (R code)
Raw Outputview raw output of R engine
Computing time3 seconds
R Server'Gwilym Jenkins' @ 72.249.127.135


Multiple Linear Regression - Estimated Regression Equation
Britse_pond[t] = + 0.114636991739404 -0.0565949872591202Zwitserse_frank[t] + 1.12444792345794`Britse_pond_-1`[t] -0.000546810967661961`Britse_pond_-2`[t] -0.259096619888014`Britse_pond_-3`[t] + 0.0820675914217389`Britse_pond_-4`[t] + 0.0101173405338365M1[t] -0.00198837719947519M2[t] + 0.00440236865833959M3[t] + 0.00684260124238548M4[t] -0.000281218482007058M5[t] + 0.00516663440438992M6[t] + 0.00236758392844985M7[t] + 0.00385981556788097M8[t] + 0.00338930082332849M9[t] -0.00207401615927181M10[t] + 0.00643574267259323M11[t] + 0.000137273166313686t + e[t]

\begin{tabular}{lllllllll}
\hline
Multiple Linear Regression - Estimated Regression Equation \tabularnewline
Britse_pond[t] =  +  0.114636991739404 -0.0565949872591202Zwitserse_frank[t] +  1.12444792345794`Britse_pond_-1`[t] -0.000546810967661961`Britse_pond_-2`[t] -0.259096619888014`Britse_pond_-3`[t] +  0.0820675914217389`Britse_pond_-4`[t] +  0.0101173405338365M1[t] -0.00198837719947519M2[t] +  0.00440236865833959M3[t] +  0.00684260124238548M4[t] -0.000281218482007058M5[t] +  0.00516663440438992M6[t] +  0.00236758392844985M7[t] +  0.00385981556788097M8[t] +  0.00338930082332849M9[t] -0.00207401615927181M10[t] +  0.00643574267259323M11[t] +  0.000137273166313686t  + e[t] \tabularnewline
\hline
\end{tabular}
%Source: https://freestatistics.org/blog/index.php?pk=58016&T=1

[TABLE]
[ROW][C]Multiple Linear Regression - Estimated Regression Equation[/C][/ROW]
[ROW][C]Britse_pond[t] =  +  0.114636991739404 -0.0565949872591202Zwitserse_frank[t] +  1.12444792345794`Britse_pond_-1`[t] -0.000546810967661961`Britse_pond_-2`[t] -0.259096619888014`Britse_pond_-3`[t] +  0.0820675914217389`Britse_pond_-4`[t] +  0.0101173405338365M1[t] -0.00198837719947519M2[t] +  0.00440236865833959M3[t] +  0.00684260124238548M4[t] -0.000281218482007058M5[t] +  0.00516663440438992M6[t] +  0.00236758392844985M7[t] +  0.00385981556788097M8[t] +  0.00338930082332849M9[t] -0.00207401615927181M10[t] +  0.00643574267259323M11[t] +  0.000137273166313686t  + e[t][/C][/ROW]
[/TABLE]
Source: https://freestatistics.org/blog/index.php?pk=58016&T=1

Globally Unique Identifier (entire table): ba.freestatistics.org/blog/index.php?pk=58016&T=1

As an alternative you can also use a QR Code:  

The GUIDs for individual cells are displayed in the table below:

Multiple Linear Regression - Estimated Regression Equation
Britse_pond[t] = + 0.114636991739404 -0.0565949872591202Zwitserse_frank[t] + 1.12444792345794`Britse_pond_-1`[t] -0.000546810967661961`Britse_pond_-2`[t] -0.259096619888014`Britse_pond_-3`[t] + 0.0820675914217389`Britse_pond_-4`[t] + 0.0101173405338365M1[t] -0.00198837719947519M2[t] + 0.00440236865833959M3[t] + 0.00684260124238548M4[t] -0.000281218482007058M5[t] + 0.00516663440438992M6[t] + 0.00236758392844985M7[t] + 0.00385981556788097M8[t] + 0.00338930082332849M9[t] -0.00207401615927181M10[t] + 0.00643574267259323M11[t] + 0.000137273166313686t + e[t]


Multiple Linear Regression - Ordinary Least Squares
VariableParameterS.D.T-STATH0: parameter = 02-tail p-value1-tail p-value
(Intercept)0.1146369917394040.0744971.53880.1321390.066069
Zwitserse_frank-0.05659498725912020.075054-0.75410.455460.22773
`Britse_pond_-1`1.124447923457940.1617886.950100
`Britse_pond_-2`-0.0005468109676619610.239349-0.00230.9981890.499095
`Britse_pond_-3`-0.2590966198880140.238048-1.08840.2832640.141632
`Britse_pond_-4`0.08206759142173890.1762380.46570.6441150.322058
M10.01011734053383650.0061411.64750.1077040.053852
M2-0.001988377199475190.005958-0.33380.74040.3702
M30.004402368658339590.0064510.68240.4991380.249569
M40.006842601242385480.0060661.12810.2663530.133176
M5-0.0002812184820070580.006061-0.04640.9632380.481619
M60.005166634404389920.0060880.84870.4013720.200686
M70.002367583928449850.0058840.40240.6896380.344819
M80.003859815567880970.0060280.64030.5258230.262911
M90.003389300823328490.0062310.5440.5896460.294823
M10-0.002074016159271810.006309-0.32880.7441470.372074
M110.006435742672593230.0063821.00840.3196570.159829
t0.0001372731663136860.000131.05260.2991950.149597

\begin{tabular}{lllllllll}
\hline
Multiple Linear Regression - Ordinary Least Squares \tabularnewline
Variable & Parameter & S.D. & T-STATH0: parameter = 0 & 2-tail p-value & 1-tail p-value \tabularnewline
(Intercept) & 0.114636991739404 & 0.074497 & 1.5388 & 0.132139 & 0.066069 \tabularnewline
Zwitserse_frank & -0.0565949872591202 & 0.075054 & -0.7541 & 0.45546 & 0.22773 \tabularnewline
`Britse_pond_-1` & 1.12444792345794 & 0.161788 & 6.9501 & 0 & 0 \tabularnewline
`Britse_pond_-2` & -0.000546810967661961 & 0.239349 & -0.0023 & 0.998189 & 0.499095 \tabularnewline
`Britse_pond_-3` & -0.259096619888014 & 0.238048 & -1.0884 & 0.283264 & 0.141632 \tabularnewline
`Britse_pond_-4` & 0.0820675914217389 & 0.176238 & 0.4657 & 0.644115 & 0.322058 \tabularnewline
M1 & 0.0101173405338365 & 0.006141 & 1.6475 & 0.107704 & 0.053852 \tabularnewline
M2 & -0.00198837719947519 & 0.005958 & -0.3338 & 0.7404 & 0.3702 \tabularnewline
M3 & 0.00440236865833959 & 0.006451 & 0.6824 & 0.499138 & 0.249569 \tabularnewline
M4 & 0.00684260124238548 & 0.006066 & 1.1281 & 0.266353 & 0.133176 \tabularnewline
M5 & -0.000281218482007058 & 0.006061 & -0.0464 & 0.963238 & 0.481619 \tabularnewline
M6 & 0.00516663440438992 & 0.006088 & 0.8487 & 0.401372 & 0.200686 \tabularnewline
M7 & 0.00236758392844985 & 0.005884 & 0.4024 & 0.689638 & 0.344819 \tabularnewline
M8 & 0.00385981556788097 & 0.006028 & 0.6403 & 0.525823 & 0.262911 \tabularnewline
M9 & 0.00338930082332849 & 0.006231 & 0.544 & 0.589646 & 0.294823 \tabularnewline
M10 & -0.00207401615927181 & 0.006309 & -0.3288 & 0.744147 & 0.372074 \tabularnewline
M11 & 0.00643574267259323 & 0.006382 & 1.0084 & 0.319657 & 0.159829 \tabularnewline
t & 0.000137273166313686 & 0.00013 & 1.0526 & 0.299195 & 0.149597 \tabularnewline
\hline
\end{tabular}
%Source: https://freestatistics.org/blog/index.php?pk=58016&T=2

[TABLE]
[ROW][C]Multiple Linear Regression - Ordinary Least Squares[/C][/ROW]
[ROW][C]Variable[/C][C]Parameter[/C][C]S.D.[/C][C]T-STATH0: parameter = 0[/C][C]2-tail p-value[/C][C]1-tail p-value[/C][/ROW]
[ROW][C](Intercept)[/C][C]0.114636991739404[/C][C]0.074497[/C][C]1.5388[/C][C]0.132139[/C][C]0.066069[/C][/ROW]
[ROW][C]Zwitserse_frank[/C][C]-0.0565949872591202[/C][C]0.075054[/C][C]-0.7541[/C][C]0.45546[/C][C]0.22773[/C][/ROW]
[ROW][C]`Britse_pond_-1`[/C][C]1.12444792345794[/C][C]0.161788[/C][C]6.9501[/C][C]0[/C][C]0[/C][/ROW]
[ROW][C]`Britse_pond_-2`[/C][C]-0.000546810967661961[/C][C]0.239349[/C][C]-0.0023[/C][C]0.998189[/C][C]0.499095[/C][/ROW]
[ROW][C]`Britse_pond_-3`[/C][C]-0.259096619888014[/C][C]0.238048[/C][C]-1.0884[/C][C]0.283264[/C][C]0.141632[/C][/ROW]
[ROW][C]`Britse_pond_-4`[/C][C]0.0820675914217389[/C][C]0.176238[/C][C]0.4657[/C][C]0.644115[/C][C]0.322058[/C][/ROW]
[ROW][C]M1[/C][C]0.0101173405338365[/C][C]0.006141[/C][C]1.6475[/C][C]0.107704[/C][C]0.053852[/C][/ROW]
[ROW][C]M2[/C][C]-0.00198837719947519[/C][C]0.005958[/C][C]-0.3338[/C][C]0.7404[/C][C]0.3702[/C][/ROW]
[ROW][C]M3[/C][C]0.00440236865833959[/C][C]0.006451[/C][C]0.6824[/C][C]0.499138[/C][C]0.249569[/C][/ROW]
[ROW][C]M4[/C][C]0.00684260124238548[/C][C]0.006066[/C][C]1.1281[/C][C]0.266353[/C][C]0.133176[/C][/ROW]
[ROW][C]M5[/C][C]-0.000281218482007058[/C][C]0.006061[/C][C]-0.0464[/C][C]0.963238[/C][C]0.481619[/C][/ROW]
[ROW][C]M6[/C][C]0.00516663440438992[/C][C]0.006088[/C][C]0.8487[/C][C]0.401372[/C][C]0.200686[/C][/ROW]
[ROW][C]M7[/C][C]0.00236758392844985[/C][C]0.005884[/C][C]0.4024[/C][C]0.689638[/C][C]0.344819[/C][/ROW]
[ROW][C]M8[/C][C]0.00385981556788097[/C][C]0.006028[/C][C]0.6403[/C][C]0.525823[/C][C]0.262911[/C][/ROW]
[ROW][C]M9[/C][C]0.00338930082332849[/C][C]0.006231[/C][C]0.544[/C][C]0.589646[/C][C]0.294823[/C][/ROW]
[ROW][C]M10[/C][C]-0.00207401615927181[/C][C]0.006309[/C][C]-0.3288[/C][C]0.744147[/C][C]0.372074[/C][/ROW]
[ROW][C]M11[/C][C]0.00643574267259323[/C][C]0.006382[/C][C]1.0084[/C][C]0.319657[/C][C]0.159829[/C][/ROW]
[ROW][C]t[/C][C]0.000137273166313686[/C][C]0.00013[/C][C]1.0526[/C][C]0.299195[/C][C]0.149597[/C][/ROW]
[/TABLE]
Source: https://freestatistics.org/blog/index.php?pk=58016&T=2

Globally Unique Identifier (entire table): ba.freestatistics.org/blog/index.php?pk=58016&T=2

As an alternative you can also use a QR Code:  

The GUIDs for individual cells are displayed in the table below:

Multiple Linear Regression - Ordinary Least Squares
VariableParameterS.D.T-STATH0: parameter = 02-tail p-value1-tail p-value
(Intercept)0.1146369917394040.0744971.53880.1321390.066069
Zwitserse_frank-0.05659498725912020.075054-0.75410.455460.22773
`Britse_pond_-1`1.124447923457940.1617886.950100
`Britse_pond_-2`-0.0005468109676619610.239349-0.00230.9981890.499095
`Britse_pond_-3`-0.2590966198880140.238048-1.08840.2832640.141632
`Britse_pond_-4`0.08206759142173890.1762380.46570.6441150.322058
M10.01011734053383650.0061411.64750.1077040.053852
M2-0.001988377199475190.005958-0.33380.74040.3702
M30.004402368658339590.0064510.68240.4991380.249569
M40.006842601242385480.0060661.12810.2663530.133176
M5-0.0002812184820070580.006061-0.04640.9632380.481619
M60.005166634404389920.0060880.84870.4013720.200686
M70.002367583928449850.0058840.40240.6896380.344819
M80.003859815567880970.0060280.64030.5258230.262911
M90.003389300823328490.0062310.5440.5896460.294823
M10-0.002074016159271810.006309-0.32880.7441470.372074
M110.006435742672593230.0063821.00840.3196570.159829
t0.0001372731663136860.000131.05260.2991950.149597


Multiple Linear Regression - Regression Statistics
Multiple R0.973540091625546
R-squared0.947780310002276
Adjusted R-squared0.924418869740136
F-TEST (value)40.5702858799454
F-TEST (DF numerator)17
F-TEST (DF denominator)38
p-value0
Multiple Linear Regression - Residual Statistics
Residual Standard Deviation0.00872717634948795
Sum Squared Residuals0.00289421706733235

\begin{tabular}{lllllllll}
\hline
Multiple Linear Regression - Regression Statistics \tabularnewline
Multiple R & 0.973540091625546 \tabularnewline
R-squared & 0.947780310002276 \tabularnewline
Adjusted R-squared & 0.924418869740136 \tabularnewline
F-TEST (value) & 40.5702858799454 \tabularnewline
F-TEST (DF numerator) & 17 \tabularnewline
F-TEST (DF denominator) & 38 \tabularnewline
p-value & 0 \tabularnewline
Multiple Linear Regression - Residual Statistics \tabularnewline
Residual Standard Deviation & 0.00872717634948795 \tabularnewline
Sum Squared Residuals & 0.00289421706733235 \tabularnewline
\hline
\end{tabular}
%Source: https://freestatistics.org/blog/index.php?pk=58016&T=3

[TABLE]
[ROW][C]Multiple Linear Regression - Regression Statistics[/C][/ROW]
[ROW][C]Multiple R[/C][C]0.973540091625546[/C][/ROW]
[ROW][C]R-squared[/C][C]0.947780310002276[/C][/ROW]
[ROW][C]Adjusted R-squared[/C][C]0.924418869740136[/C][/ROW]
[ROW][C]F-TEST (value)[/C][C]40.5702858799454[/C][/ROW]
[ROW][C]F-TEST (DF numerator)[/C][C]17[/C][/ROW]
[ROW][C]F-TEST (DF denominator)[/C][C]38[/C][/ROW]
[ROW][C]p-value[/C][C]0[/C][/ROW]
[ROW][C]Multiple Linear Regression - Residual Statistics[/C][/ROW]
[ROW][C]Residual Standard Deviation[/C][C]0.00872717634948795[/C][/ROW]
[ROW][C]Sum Squared Residuals[/C][C]0.00289421706733235[/C][/ROW]
[/TABLE]
Source: https://freestatistics.org/blog/index.php?pk=58016&T=3

Globally Unique Identifier (entire table): ba.freestatistics.org/blog/index.php?pk=58016&T=3

As an alternative you can also use a QR Code:  

The GUIDs for individual cells are displayed in the table below:

Multiple Linear Regression - Regression Statistics
Multiple R0.973540091625546
R-squared0.947780310002276
Adjusted R-squared0.924418869740136
F-TEST (value)40.5702858799454
F-TEST (DF numerator)17
F-TEST (DF denominator)38
p-value0
Multiple Linear Regression - Residual Statistics
Residual Standard Deviation0.00872717634948795
Sum Squared Residuals0.00289421706733235


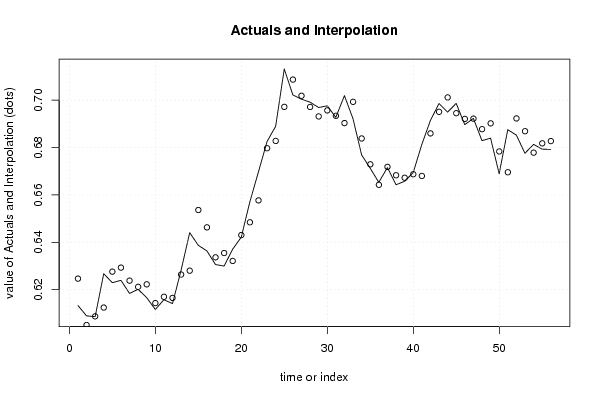
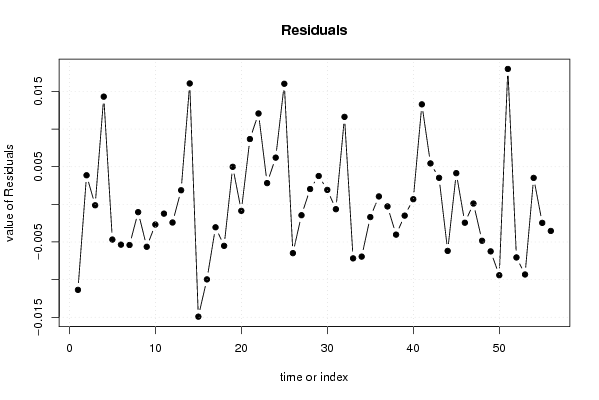
Multiple Linear Regression - Actuals, Interpolation, and Residuals
Time or IndexActualsInterpolationForecastResidualsPrediction Error
10.613280.624640860936968-0.0113608609369677
20.60890.6050389883852950.00386101161470527
30.608570.608693297534306-0.000123297534305677
40.626720.6124145617125680.0143054382874317
50.622910.627589745045723-0.00467974504572314
60.623930.629285985572241-0.0053559855722411
70.618380.62377927737256-0.00539927737256051
80.620120.621157506471576-0.00103750647157630
90.616590.622229521000326-0.00563952100032589
100.61160.614285134785-0.00268513478500017
110.615730.616965770013257-0.00123577001325742
120.614070.616484597669385-0.00241459766938451
130.628230.6263602799132490.00186972008675103
140.644050.6279920740171290.0160579259828712
150.63870.65361912726506-0.0149191272650592
160.636330.646299231751325-0.00996923175132522
170.630590.633640264137794-0.00305026413779446
180.629940.635451171765817-0.00551117176581673
190.637090.632106470905230.00498352909477051
200.642170.64303489120496-0.000864891204959784
210.657110.6484355311337380.00867446886626213
220.669770.65770012329510.0120698767048996
230.682550.679726219624790.00282378037521004
240.689020.6828148666594780.00620513334052245
250.713220.6972026325316430.0160173674683568
260.702240.708721179076764-0.00648117907676355
270.700450.701894128346416-0.00144412834641643
280.699190.6971558373165890.00203416268341068
290.696930.6931655788596440.00376442114035555
300.697630.6957105678969630.00191943210303661
310.692780.693422453312738-0.000642453312737655
320.701960.6903404930591810.0116195069408186
330.692150.699325971704917-0.007175971704917
340.67690.683842358553382-0.00694235855338182
350.671240.67293259706391-0.0016925970639105
360.665320.6642693278517560.00105067214824406
370.671570.671848391489266-0.000278391489266206
380.664280.668303115399183-0.00402311539918325
390.665760.667258400014424-0.00149840001442421
400.669420.6687367195770070.000683280422992628
410.68130.6680175619999820.0132824380000182
420.691440.6860056898099620.00543431019003803
430.698620.6951009794688590.00351902053114107
440.6950.701183169430719-0.00618316943071869
450.698670.694528976161020.00414102383898078
460.689680.692122383366518-0.00244238336651763
470.692330.6922254132980420.000104586701957885
480.682930.687771207819382-0.00484120781938201
490.683990.690237835128874-0.00624783512887399
500.668950.67836464312163-0.00941464312162963
510.687560.6695750468397940.0179849531602055
520.685270.69232364964251-0.00705364964250976
530.67760.686916849956856-0.00931684995685614
540.681370.6778565849550170.00351341504498319
550.679330.681790818940613-0.00246081894061341
560.679220.682753939833564-0.00353393983356378

\begin{tabular}{lllllllll}
\hline
Multiple Linear Regression - Actuals, Interpolation, and Residuals \tabularnewline
Time or Index & Actuals & InterpolationForecast & ResidualsPrediction Error \tabularnewline
1 & 0.61328 & 0.624640860936968 & -0.0113608609369677 \tabularnewline
2 & 0.6089 & 0.605038988385295 & 0.00386101161470527 \tabularnewline
3 & 0.60857 & 0.608693297534306 & -0.000123297534305677 \tabularnewline
4 & 0.62672 & 0.612414561712568 & 0.0143054382874317 \tabularnewline
5 & 0.62291 & 0.627589745045723 & -0.00467974504572314 \tabularnewline
6 & 0.62393 & 0.629285985572241 & -0.0053559855722411 \tabularnewline
7 & 0.61838 & 0.62377927737256 & -0.00539927737256051 \tabularnewline
8 & 0.62012 & 0.621157506471576 & -0.00103750647157630 \tabularnewline
9 & 0.61659 & 0.622229521000326 & -0.00563952100032589 \tabularnewline
10 & 0.6116 & 0.614285134785 & -0.00268513478500017 \tabularnewline
11 & 0.61573 & 0.616965770013257 & -0.00123577001325742 \tabularnewline
12 & 0.61407 & 0.616484597669385 & -0.00241459766938451 \tabularnewline
13 & 0.62823 & 0.626360279913249 & 0.00186972008675103 \tabularnewline
14 & 0.64405 & 0.627992074017129 & 0.0160579259828712 \tabularnewline
15 & 0.6387 & 0.65361912726506 & -0.0149191272650592 \tabularnewline
16 & 0.63633 & 0.646299231751325 & -0.00996923175132522 \tabularnewline
17 & 0.63059 & 0.633640264137794 & -0.00305026413779446 \tabularnewline
18 & 0.62994 & 0.635451171765817 & -0.00551117176581673 \tabularnewline
19 & 0.63709 & 0.63210647090523 & 0.00498352909477051 \tabularnewline
20 & 0.64217 & 0.64303489120496 & -0.000864891204959784 \tabularnewline
21 & 0.65711 & 0.648435531133738 & 0.00867446886626213 \tabularnewline
22 & 0.66977 & 0.6577001232951 & 0.0120698767048996 \tabularnewline
23 & 0.68255 & 0.67972621962479 & 0.00282378037521004 \tabularnewline
24 & 0.68902 & 0.682814866659478 & 0.00620513334052245 \tabularnewline
25 & 0.71322 & 0.697202632531643 & 0.0160173674683568 \tabularnewline
26 & 0.70224 & 0.708721179076764 & -0.00648117907676355 \tabularnewline
27 & 0.70045 & 0.701894128346416 & -0.00144412834641643 \tabularnewline
28 & 0.69919 & 0.697155837316589 & 0.00203416268341068 \tabularnewline
29 & 0.69693 & 0.693165578859644 & 0.00376442114035555 \tabularnewline
30 & 0.69763 & 0.695710567896963 & 0.00191943210303661 \tabularnewline
31 & 0.69278 & 0.693422453312738 & -0.000642453312737655 \tabularnewline
32 & 0.70196 & 0.690340493059181 & 0.0116195069408186 \tabularnewline
33 & 0.69215 & 0.699325971704917 & -0.007175971704917 \tabularnewline
34 & 0.6769 & 0.683842358553382 & -0.00694235855338182 \tabularnewline
35 & 0.67124 & 0.67293259706391 & -0.0016925970639105 \tabularnewline
36 & 0.66532 & 0.664269327851756 & 0.00105067214824406 \tabularnewline
37 & 0.67157 & 0.671848391489266 & -0.000278391489266206 \tabularnewline
38 & 0.66428 & 0.668303115399183 & -0.00402311539918325 \tabularnewline
39 & 0.66576 & 0.667258400014424 & -0.00149840001442421 \tabularnewline
40 & 0.66942 & 0.668736719577007 & 0.000683280422992628 \tabularnewline
41 & 0.6813 & 0.668017561999982 & 0.0132824380000182 \tabularnewline
42 & 0.69144 & 0.686005689809962 & 0.00543431019003803 \tabularnewline
43 & 0.69862 & 0.695100979468859 & 0.00351902053114107 \tabularnewline
44 & 0.695 & 0.701183169430719 & -0.00618316943071869 \tabularnewline
45 & 0.69867 & 0.69452897616102 & 0.00414102383898078 \tabularnewline
46 & 0.68968 & 0.692122383366518 & -0.00244238336651763 \tabularnewline
47 & 0.69233 & 0.692225413298042 & 0.000104586701957885 \tabularnewline
48 & 0.68293 & 0.687771207819382 & -0.00484120781938201 \tabularnewline
49 & 0.68399 & 0.690237835128874 & -0.00624783512887399 \tabularnewline
50 & 0.66895 & 0.67836464312163 & -0.00941464312162963 \tabularnewline
51 & 0.68756 & 0.669575046839794 & 0.0179849531602055 \tabularnewline
52 & 0.68527 & 0.69232364964251 & -0.00705364964250976 \tabularnewline
53 & 0.6776 & 0.686916849956856 & -0.00931684995685614 \tabularnewline
54 & 0.68137 & 0.677856584955017 & 0.00351341504498319 \tabularnewline
55 & 0.67933 & 0.681790818940613 & -0.00246081894061341 \tabularnewline
56 & 0.67922 & 0.682753939833564 & -0.00353393983356378 \tabularnewline
\hline
\end{tabular}
%Source: https://freestatistics.org/blog/index.php?pk=58016&T=4

[TABLE]
[ROW][C]Multiple Linear Regression - Actuals, Interpolation, and Residuals[/C][/ROW]
[ROW][C]Time or Index[/C][C]Actuals[/C][C]InterpolationForecast[/C][C]ResidualsPrediction Error[/C][/ROW]
[ROW][C]1[/C][C]0.61328[/C][C]0.624640860936968[/C][C]-0.0113608609369677[/C][/ROW]
[ROW][C]2[/C][C]0.6089[/C][C]0.605038988385295[/C][C]0.00386101161470527[/C][/ROW]
[ROW][C]3[/C][C]0.60857[/C][C]0.608693297534306[/C][C]-0.000123297534305677[/C][/ROW]
[ROW][C]4[/C][C]0.62672[/C][C]0.612414561712568[/C][C]0.0143054382874317[/C][/ROW]
[ROW][C]5[/C][C]0.62291[/C][C]0.627589745045723[/C][C]-0.00467974504572314[/C][/ROW]
[ROW][C]6[/C][C]0.62393[/C][C]0.629285985572241[/C][C]-0.0053559855722411[/C][/ROW]
[ROW][C]7[/C][C]0.61838[/C][C]0.62377927737256[/C][C]-0.00539927737256051[/C][/ROW]
[ROW][C]8[/C][C]0.62012[/C][C]0.621157506471576[/C][C]-0.00103750647157630[/C][/ROW]
[ROW][C]9[/C][C]0.61659[/C][C]0.622229521000326[/C][C]-0.00563952100032589[/C][/ROW]
[ROW][C]10[/C][C]0.6116[/C][C]0.614285134785[/C][C]-0.00268513478500017[/C][/ROW]
[ROW][C]11[/C][C]0.61573[/C][C]0.616965770013257[/C][C]-0.00123577001325742[/C][/ROW]
[ROW][C]12[/C][C]0.61407[/C][C]0.616484597669385[/C][C]-0.00241459766938451[/C][/ROW]
[ROW][C]13[/C][C]0.62823[/C][C]0.626360279913249[/C][C]0.00186972008675103[/C][/ROW]
[ROW][C]14[/C][C]0.64405[/C][C]0.627992074017129[/C][C]0.0160579259828712[/C][/ROW]
[ROW][C]15[/C][C]0.6387[/C][C]0.65361912726506[/C][C]-0.0149191272650592[/C][/ROW]
[ROW][C]16[/C][C]0.63633[/C][C]0.646299231751325[/C][C]-0.00996923175132522[/C][/ROW]
[ROW][C]17[/C][C]0.63059[/C][C]0.633640264137794[/C][C]-0.00305026413779446[/C][/ROW]
[ROW][C]18[/C][C]0.62994[/C][C]0.635451171765817[/C][C]-0.00551117176581673[/C][/ROW]
[ROW][C]19[/C][C]0.63709[/C][C]0.63210647090523[/C][C]0.00498352909477051[/C][/ROW]
[ROW][C]20[/C][C]0.64217[/C][C]0.64303489120496[/C][C]-0.000864891204959784[/C][/ROW]
[ROW][C]21[/C][C]0.65711[/C][C]0.648435531133738[/C][C]0.00867446886626213[/C][/ROW]
[ROW][C]22[/C][C]0.66977[/C][C]0.6577001232951[/C][C]0.0120698767048996[/C][/ROW]
[ROW][C]23[/C][C]0.68255[/C][C]0.67972621962479[/C][C]0.00282378037521004[/C][/ROW]
[ROW][C]24[/C][C]0.68902[/C][C]0.682814866659478[/C][C]0.00620513334052245[/C][/ROW]
[ROW][C]25[/C][C]0.71322[/C][C]0.697202632531643[/C][C]0.0160173674683568[/C][/ROW]
[ROW][C]26[/C][C]0.70224[/C][C]0.708721179076764[/C][C]-0.00648117907676355[/C][/ROW]
[ROW][C]27[/C][C]0.70045[/C][C]0.701894128346416[/C][C]-0.00144412834641643[/C][/ROW]
[ROW][C]28[/C][C]0.69919[/C][C]0.697155837316589[/C][C]0.00203416268341068[/C][/ROW]
[ROW][C]29[/C][C]0.69693[/C][C]0.693165578859644[/C][C]0.00376442114035555[/C][/ROW]
[ROW][C]30[/C][C]0.69763[/C][C]0.695710567896963[/C][C]0.00191943210303661[/C][/ROW]
[ROW][C]31[/C][C]0.69278[/C][C]0.693422453312738[/C][C]-0.000642453312737655[/C][/ROW]
[ROW][C]32[/C][C]0.70196[/C][C]0.690340493059181[/C][C]0.0116195069408186[/C][/ROW]
[ROW][C]33[/C][C]0.69215[/C][C]0.699325971704917[/C][C]-0.007175971704917[/C][/ROW]
[ROW][C]34[/C][C]0.6769[/C][C]0.683842358553382[/C][C]-0.00694235855338182[/C][/ROW]
[ROW][C]35[/C][C]0.67124[/C][C]0.67293259706391[/C][C]-0.0016925970639105[/C][/ROW]
[ROW][C]36[/C][C]0.66532[/C][C]0.664269327851756[/C][C]0.00105067214824406[/C][/ROW]
[ROW][C]37[/C][C]0.67157[/C][C]0.671848391489266[/C][C]-0.000278391489266206[/C][/ROW]
[ROW][C]38[/C][C]0.66428[/C][C]0.668303115399183[/C][C]-0.00402311539918325[/C][/ROW]
[ROW][C]39[/C][C]0.66576[/C][C]0.667258400014424[/C][C]-0.00149840001442421[/C][/ROW]
[ROW][C]40[/C][C]0.66942[/C][C]0.668736719577007[/C][C]0.000683280422992628[/C][/ROW]
[ROW][C]41[/C][C]0.6813[/C][C]0.668017561999982[/C][C]0.0132824380000182[/C][/ROW]
[ROW][C]42[/C][C]0.69144[/C][C]0.686005689809962[/C][C]0.00543431019003803[/C][/ROW]
[ROW][C]43[/C][C]0.69862[/C][C]0.695100979468859[/C][C]0.00351902053114107[/C][/ROW]
[ROW][C]44[/C][C]0.695[/C][C]0.701183169430719[/C][C]-0.00618316943071869[/C][/ROW]
[ROW][C]45[/C][C]0.69867[/C][C]0.69452897616102[/C][C]0.00414102383898078[/C][/ROW]
[ROW][C]46[/C][C]0.68968[/C][C]0.692122383366518[/C][C]-0.00244238336651763[/C][/ROW]
[ROW][C]47[/C][C]0.69233[/C][C]0.692225413298042[/C][C]0.000104586701957885[/C][/ROW]
[ROW][C]48[/C][C]0.68293[/C][C]0.687771207819382[/C][C]-0.00484120781938201[/C][/ROW]
[ROW][C]49[/C][C]0.68399[/C][C]0.690237835128874[/C][C]-0.00624783512887399[/C][/ROW]
[ROW][C]50[/C][C]0.66895[/C][C]0.67836464312163[/C][C]-0.00941464312162963[/C][/ROW]
[ROW][C]51[/C][C]0.68756[/C][C]0.669575046839794[/C][C]0.0179849531602055[/C][/ROW]
[ROW][C]52[/C][C]0.68527[/C][C]0.69232364964251[/C][C]-0.00705364964250976[/C][/ROW]
[ROW][C]53[/C][C]0.6776[/C][C]0.686916849956856[/C][C]-0.00931684995685614[/C][/ROW]
[ROW][C]54[/C][C]0.68137[/C][C]0.677856584955017[/C][C]0.00351341504498319[/C][/ROW]
[ROW][C]55[/C][C]0.67933[/C][C]0.681790818940613[/C][C]-0.00246081894061341[/C][/ROW]
[ROW][C]56[/C][C]0.67922[/C][C]0.682753939833564[/C][C]-0.00353393983356378[/C][/ROW]
[/TABLE]
Source: https://freestatistics.org/blog/index.php?pk=58016&T=4

Globally Unique Identifier (entire table): ba.freestatistics.org/blog/index.php?pk=58016&T=4

As an alternative you can also use a QR Code:  

The GUIDs for individual cells are displayed in the table below:

Multiple Linear Regression - Actuals, Interpolation, and Residuals
Time or IndexActualsInterpolationForecastResidualsPrediction Error
10.613280.624640860936968-0.0113608609369677
20.60890.6050389883852950.00386101161470527
30.608570.608693297534306-0.000123297534305677
40.626720.6124145617125680.0143054382874317
50.622910.627589745045723-0.00467974504572314
60.623930.629285985572241-0.0053559855722411
70.618380.62377927737256-0.00539927737256051
80.620120.621157506471576-0.00103750647157630
90.616590.622229521000326-0.00563952100032589
100.61160.614285134785-0.00268513478500017
110.615730.616965770013257-0.00123577001325742
120.614070.616484597669385-0.00241459766938451
130.628230.6263602799132490.00186972008675103
140.644050.6279920740171290.0160579259828712
150.63870.65361912726506-0.0149191272650592
160.636330.646299231751325-0.00996923175132522
170.630590.633640264137794-0.00305026413779446
180.629940.635451171765817-0.00551117176581673
190.637090.632106470905230.00498352909477051
200.642170.64303489120496-0.000864891204959784
210.657110.6484355311337380.00867446886626213
220.669770.65770012329510.0120698767048996
230.682550.679726219624790.00282378037521004
240.689020.6828148666594780.00620513334052245
250.713220.6972026325316430.0160173674683568
260.702240.708721179076764-0.00648117907676355
270.700450.701894128346416-0.00144412834641643
280.699190.6971558373165890.00203416268341068
290.696930.6931655788596440.00376442114035555
300.697630.6957105678969630.00191943210303661
310.692780.693422453312738-0.000642453312737655
320.701960.6903404930591810.0116195069408186
330.692150.699325971704917-0.007175971704917
340.67690.683842358553382-0.00694235855338182
350.671240.67293259706391-0.0016925970639105
360.665320.6642693278517560.00105067214824406
370.671570.671848391489266-0.000278391489266206
380.664280.668303115399183-0.00402311539918325
390.665760.667258400014424-0.00149840001442421
400.669420.6687367195770070.000683280422992628
410.68130.6680175619999820.0132824380000182
420.691440.6860056898099620.00543431019003803
430.698620.6951009794688590.00351902053114107
440.6950.701183169430719-0.00618316943071869
450.698670.694528976161020.00414102383898078
460.689680.692122383366518-0.00244238336651763
470.692330.6922254132980420.000104586701957885
480.682930.687771207819382-0.00484120781938201
490.683990.690237835128874-0.00624783512887399
500.668950.67836464312163-0.00941464312162963
510.687560.6695750468397940.0179849531602055
520.685270.69232364964251-0.00705364964250976
530.67760.686916849956856-0.00931684995685614
540.681370.6778565849550170.00351341504498319
550.679330.681790818940613-0.00246081894061341
560.679220.682753939833564-0.00353393983356378


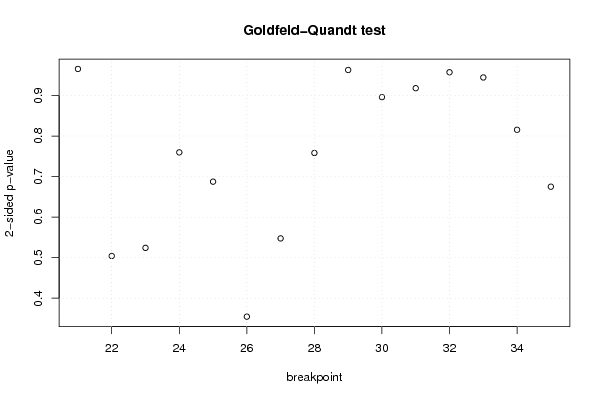
Goldfeld-Quandt test for Heteroskedasticity
p-valuesAlternative Hypothesis
breakpoint indexgreater2-sidedless
210.5173171166273620.9653657667452760.482682883372638
220.7478902900741320.5042194198517350.252109709925868
230.7378752723898560.5242494552202890.262124727610144
240.6201589291135620.7596821417728760.379841070886438
250.6562765099068730.6874469801862540.343723490093127
260.8226997659403680.3546004681192650.177300234059632
270.7262349703380660.5475300593238680.273765029661934
280.620888078889790.7582238422204210.379111921110211
290.5185929094307660.9628141811384690.481407090569234
300.4479718044084020.8959436088168040.552028195591598
310.4589546322948380.9179092645896760.541045367705162
320.4786122845580850.957224569116170.521387715441915
330.472193299406160.944386598812320.52780670059384
340.4076859815146170.8153719630292340.592314018485383
350.6624719180443580.6750561639112830.337528081955642

\begin{tabular}{lllllllll}
\hline
Goldfeld-Quandt test for Heteroskedasticity \tabularnewline
p-values & Alternative Hypothesis \tabularnewline
breakpoint index & greater & 2-sided & less \tabularnewline
21 & 0.517317116627362 & 0.965365766745276 & 0.482682883372638 \tabularnewline
22 & 0.747890290074132 & 0.504219419851735 & 0.252109709925868 \tabularnewline
23 & 0.737875272389856 & 0.524249455220289 & 0.262124727610144 \tabularnewline
24 & 0.620158929113562 & 0.759682141772876 & 0.379841070886438 \tabularnewline
25 & 0.656276509906873 & 0.687446980186254 & 0.343723490093127 \tabularnewline
26 & 0.822699765940368 & 0.354600468119265 & 0.177300234059632 \tabularnewline
27 & 0.726234970338066 & 0.547530059323868 & 0.273765029661934 \tabularnewline
28 & 0.62088807888979 & 0.758223842220421 & 0.379111921110211 \tabularnewline
29 & 0.518592909430766 & 0.962814181138469 & 0.481407090569234 \tabularnewline
30 & 0.447971804408402 & 0.895943608816804 & 0.552028195591598 \tabularnewline
31 & 0.458954632294838 & 0.917909264589676 & 0.541045367705162 \tabularnewline
32 & 0.478612284558085 & 0.95722456911617 & 0.521387715441915 \tabularnewline
33 & 0.47219329940616 & 0.94438659881232 & 0.52780670059384 \tabularnewline
34 & 0.407685981514617 & 0.815371963029234 & 0.592314018485383 \tabularnewline
35 & 0.662471918044358 & 0.675056163911283 & 0.337528081955642 \tabularnewline
\hline
\end{tabular}
%Source: https://freestatistics.org/blog/index.php?pk=58016&T=5

[TABLE]
[ROW][C]Goldfeld-Quandt test for Heteroskedasticity[/C][/ROW]
[ROW][C]p-values[/C][C]Alternative Hypothesis[/C][/ROW]
[ROW][C]breakpoint index[/C][C]greater[/C][C]2-sided[/C][C]less[/C][/ROW]
[ROW][C]21[/C][C]0.517317116627362[/C][C]0.965365766745276[/C][C]0.482682883372638[/C][/ROW]
[ROW][C]22[/C][C]0.747890290074132[/C][C]0.504219419851735[/C][C]0.252109709925868[/C][/ROW]
[ROW][C]23[/C][C]0.737875272389856[/C][C]0.524249455220289[/C][C]0.262124727610144[/C][/ROW]
[ROW][C]24[/C][C]0.620158929113562[/C][C]0.759682141772876[/C][C]0.379841070886438[/C][/ROW]
[ROW][C]25[/C][C]0.656276509906873[/C][C]0.687446980186254[/C][C]0.343723490093127[/C][/ROW]
[ROW][C]26[/C][C]0.822699765940368[/C][C]0.354600468119265[/C][C]0.177300234059632[/C][/ROW]
[ROW][C]27[/C][C]0.726234970338066[/C][C]0.547530059323868[/C][C]0.273765029661934[/C][/ROW]
[ROW][C]28[/C][C]0.62088807888979[/C][C]0.758223842220421[/C][C]0.379111921110211[/C][/ROW]
[ROW][C]29[/C][C]0.518592909430766[/C][C]0.962814181138469[/C][C]0.481407090569234[/C][/ROW]
[ROW][C]30[/C][C]0.447971804408402[/C][C]0.895943608816804[/C][C]0.552028195591598[/C][/ROW]
[ROW][C]31[/C][C]0.458954632294838[/C][C]0.917909264589676[/C][C]0.541045367705162[/C][/ROW]
[ROW][C]32[/C][C]0.478612284558085[/C][C]0.95722456911617[/C][C]0.521387715441915[/C][/ROW]
[ROW][C]33[/C][C]0.47219329940616[/C][C]0.94438659881232[/C][C]0.52780670059384[/C][/ROW]
[ROW][C]34[/C][C]0.407685981514617[/C][C]0.815371963029234[/C][C]0.592314018485383[/C][/ROW]
[ROW][C]35[/C][C]0.662471918044358[/C][C]0.675056163911283[/C][C]0.337528081955642[/C][/ROW]
[/TABLE]
Source: https://freestatistics.org/blog/index.php?pk=58016&T=5

Globally Unique Identifier (entire table): ba.freestatistics.org/blog/index.php?pk=58016&T=5

As an alternative you can also use a QR Code:  

The GUIDs for individual cells are displayed in the table below:

Goldfeld-Quandt test for Heteroskedasticity
p-valuesAlternative Hypothesis
breakpoint indexgreater2-sidedless
210.5173171166273620.9653657667452760.482682883372638
220.7478902900741320.5042194198517350.252109709925868
230.7378752723898560.5242494552202890.262124727610144
240.6201589291135620.7596821417728760.379841070886438
250.6562765099068730.6874469801862540.343723490093127
260.8226997659403680.3546004681192650.177300234059632
270.7262349703380660.5475300593238680.273765029661934
280.620888078889790.7582238422204210.379111921110211
290.5185929094307660.9628141811384690.481407090569234
300.4479718044084020.8959436088168040.552028195591598
310.4589546322948380.9179092645896760.541045367705162
320.4786122845580850.957224569116170.521387715441915
330.472193299406160.944386598812320.52780670059384
340.4076859815146170.8153719630292340.592314018485383
350.6624719180443580.6750561639112830.337528081955642


Meta Analysis of Goldfeld-Quandt test for Heteroskedasticity
Description# significant tests% significant testsOK/NOK
1% type I error level00OK
5% type I error level00OK
10% type I error level00OK

\begin{tabular}{lllllllll}
\hline
Meta Analysis of Goldfeld-Quandt test for Heteroskedasticity \tabularnewline
Description & # significant tests & % significant tests & OK/NOK \tabularnewline
1% type I error level & 0 & 0 & OK \tabularnewline
5% type I error level & 0 & 0 & OK \tabularnewline
10% type I error level & 0 & 0 & OK \tabularnewline
\hline
\end{tabular}
%Source: https://freestatistics.org/blog/index.php?pk=58016&T=6

[TABLE]
[ROW][C]Meta Analysis of Goldfeld-Quandt test for Heteroskedasticity[/C][/ROW]
[ROW][C]Description[/C][C]# significant tests[/C][C]% significant tests[/C][C]OK/NOK[/C][/ROW]
[ROW][C]1% type I error level[/C][C]0[/C][C]0[/C][C]OK[/C][/ROW]
[ROW][C]5% type I error level[/C][C]0[/C][C]0[/C][C]OK[/C][/ROW]
[ROW][C]10% type I error level[/C][C]0[/C][C]0[/C][C]OK[/C][/ROW]
[/TABLE]
Source: https://freestatistics.org/blog/index.php?pk=58016&T=6

Globally Unique Identifier (entire table): ba.freestatistics.org/blog/index.php?pk=58016&T=6

As an alternative you can also use a QR Code:  

The GUIDs for individual cells are displayed in the table below:

Meta Analysis of Goldfeld-Quandt test for Heteroskedasticity
Description# significant tests% significant testsOK/NOK
1% type I error level00OK
5% type I error level00OK
10% type I error level00OK


Parameters (Session):
par1 = 1 ; par2 = Include Monthly Dummies ; par3 = Linear Trend ;
Parameters (R input):
par1 = 1 ; par2 = Include Monthly Dummies ; par3 = Linear Trend ;
R code (references can be found in the software module):
library(lattice)
library(lmtest)
n25 <- 25 #minimum number of obs. for Goldfeld-Quandt test
par1 <- as.numeric(par1)
x <- t(y)
k <- length(x[1,])
n <- length(x[,1])
x1 <- cbind(x[,par1], x[,1:k!=par1])
mycolnames <- c(colnames(x)[par1], colnames(x)[1:k!=par1])
colnames(x1) <- mycolnames #colnames(x)[par1]
x <- x1
if (par3 == 'First Differences'){
x2 <- array(0, dim=c(n-1,k), dimnames=list(1:(n-1), paste('(1-B)',colnames(x),sep='')))
for (i in 1:n-1) {
for (j in 1:k) {
x2[i,j] <- x[i+1,j] - x[i,j]
}
}
x <- x2
}
if (par2 == 'Include Monthly Dummies'){
x2 <- array(0, dim=c(n,11), dimnames=list(1:n, paste('M', seq(1:11), sep ='')))
for (i in 1:11){
x2[seq(i,n,12),i] <- 1
}
x <- cbind(x, x2)
}
if (par2 == 'Include Quarterly Dummies'){
x2 <- array(0, dim=c(n,3), dimnames=list(1:n, paste('Q', seq(1:3), sep ='')))
for (i in 1:3){
x2[seq(i,n,4),i] <- 1
}
x <- cbind(x, x2)
}
k <- length(x[1,])
if (par3 == 'Linear Trend'){
x <- cbind(x, c(1:n))
colnames(x)[k+1] <- 't'
}
x
k <- length(x[1,])
df <- as.data.frame(x)
(mylm <- lm(df))
(mysum <- summary(mylm))
if (n > n25) {
kp3 <- k + 3
nmkm3 <- n - k - 3
gqarr <- array(NA, dim=c(nmkm3-kp3+1,3))
numgqtests <- 0
numsignificant1 <- 0
numsignificant5 <- 0
numsignificant10 <- 0
for (mypoint in kp3:nmkm3) {
j <- 0
numgqtests <- numgqtests + 1
for (myalt in c('greater', 'two.sided', 'less')) {
j <- j + 1
gqarr[mypoint-kp3+1,j] <- gqtest(mylm, point=mypoint, alternative=myalt)$p.value
}
if (gqarr[mypoint-kp3+1,2] < 0.01) numsignificant1 <- numsignificant1 + 1
if (gqarr[mypoint-kp3+1,2] < 0.05) numsignificant5 <- numsignificant5 + 1
if (gqarr[mypoint-kp3+1,2] < 0.10) numsignificant10 <- numsignificant10 + 1
}
gqarr
}
bitmap(file='test0.png')
plot(x[,1], type='l', main='Actuals and Interpolation', ylab='value of Actuals and Interpolation (dots)', xlab='time or index')
points(x[,1]-mysum$resid)
grid()
dev.off()
bitmap(file='test1.png')
plot(mysum$resid, type='b', pch=19, main='Residuals', ylab='value of Residuals', xlab='time or index')
grid()
dev.off()
bitmap(file='test2.png')
hist(mysum$resid, main='Residual Histogram', xlab='values of Residuals')
grid()
dev.off()
bitmap(file='test3.png')
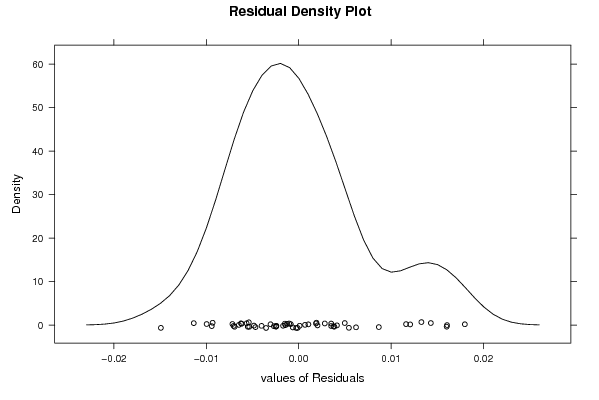
densityplot(~mysum$resid,col='black',main='Residual Density Plot', xlab='values of Residuals')
dev.off()
bitmap(file='test4.png')
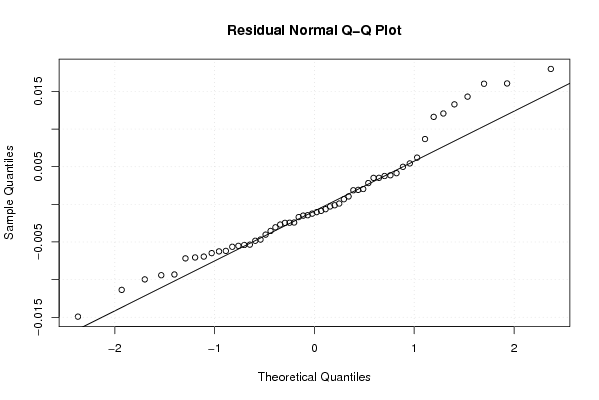
qqnorm(mysum$resid, main='Residual Normal Q-Q Plot')
qqline(mysum$resid)
grid()
dev.off()
(myerror <- as.ts(mysum$resid))
bitmap(file='test5.png')
dum <- cbind(lag(myerror,k=1),myerror)
dum
dum1 <- dum[2:length(myerror),]
dum1
z <- as.data.frame(dum1)
z
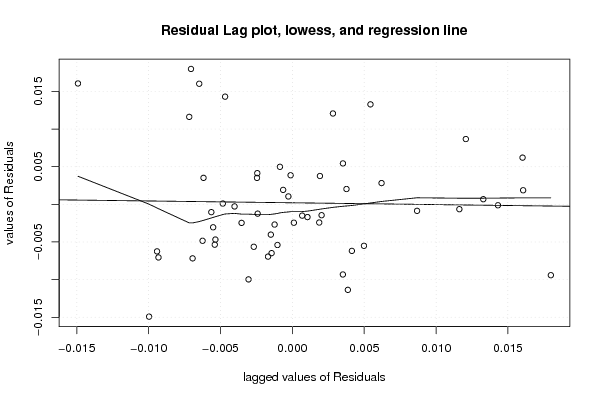
plot(z,main=paste('Residual Lag plot, lowess, and regression line'), ylab='values of Residuals', xlab='lagged values of Residuals')
lines(lowess(z))
abline(lm(z))
grid()
dev.off()
bitmap(file='test6.png')
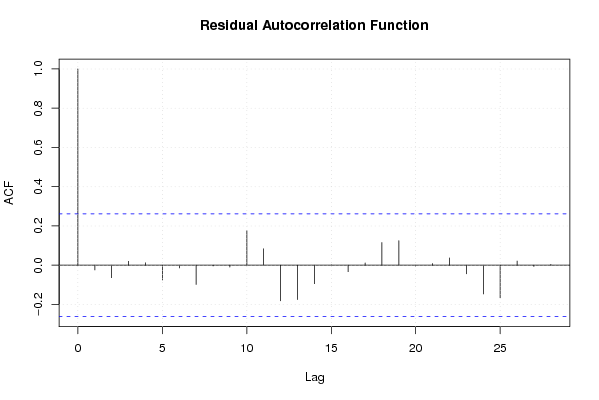
acf(mysum$resid, lag.max=length(mysum$resid)/2, main='Residual Autocorrelation Function')
grid()
dev.off()
bitmap(file='test7.png')
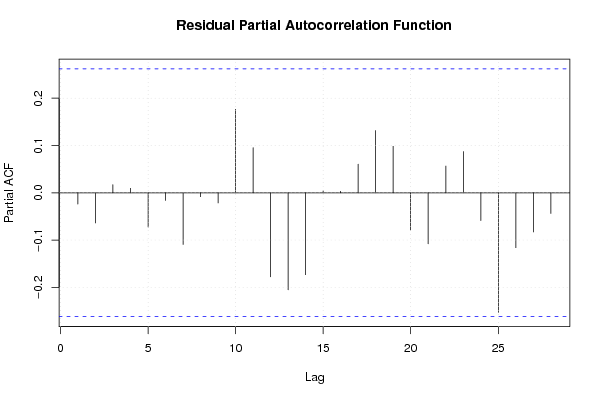
pacf(mysum$resid, lag.max=length(mysum$resid)/2, main='Residual Partial Autocorrelation Function')
grid()
dev.off()
bitmap(file='test8.png')
opar <- par(mfrow = c(2,2), oma = c(0, 0, 1.1, 0))
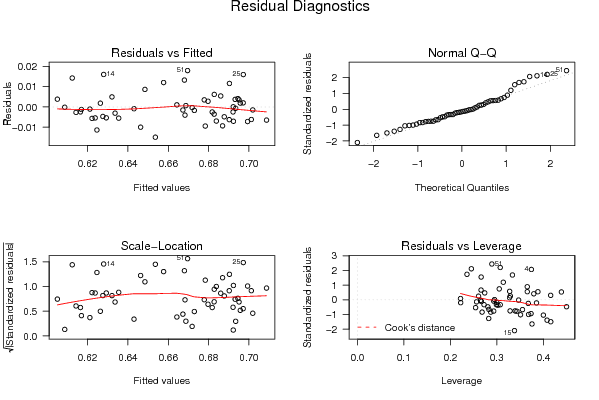
plot(mylm, las = 1, sub='Residual Diagnostics')
par(opar)
dev.off()
if (n > n25) {
bitmap(file='test9.png')
plot(kp3:nmkm3,gqarr[,2], main='Goldfeld-Quandt test',ylab='2-sided p-value',xlab='breakpoint')
grid()
dev.off()
}
load(file='createtable')
a<-table.start()
a<-table.row.start(a)
a<-table.element(a, 'Multiple Linear Regression - Estimated Regression Equation', 1, TRUE)
a<-table.row.end(a)
myeq <- colnames(x)[1]
myeq <- paste(myeq, '[t] = ', sep='')
for (i in 1:k){
if (mysum$coefficients[i,1] > 0) myeq <- paste(myeq, '+', '')
myeq <- paste(myeq, mysum$coefficients[i,1], sep=' ')
if (rownames(mysum$coefficients)[i] != '(Intercept)') {
myeq <- paste(myeq, rownames(mysum$coefficients)[i], sep='')
if (rownames(mysum$coefficients)[i] != 't') myeq <- paste(myeq, '[t]', sep='')
}
}
myeq <- paste(myeq, ' + e[t]')
a<-table.row.start(a)
a<-table.element(a, myeq)
a<-table.row.end(a)
a<-table.end(a)
table.save(a,file='mytable1.tab')
a<-table.start()
a<-table.row.start(a)
a<-table.element(a,hyperlink('ols1.htm','Multiple Linear Regression - Ordinary Least Squares',''), 6, TRUE)
a<-table.row.end(a)
a<-table.row.start(a)
a<-table.element(a,'Variable',header=TRUE)
a<-table.element(a,'Parameter',header=TRUE)
a<-table.element(a,'S.D.',header=TRUE)
a<-table.element(a,'T-STAT
H0: parameter = 0',header=TRUE)
a<-table.element(a,'2-tail p-value',header=TRUE)
a<-table.element(a,'1-tail p-value',header=TRUE)
a<-table.row.end(a)
for (i in 1:k){
a<-table.row.start(a)
a<-table.element(a,rownames(mysum$coefficients)[i],header=TRUE)
a<-table.element(a,mysum$coefficients[i,1])
a<-table.element(a, round(mysum$coefficients[i,2],6))
a<-table.element(a, round(mysum$coefficients[i,3],4))
a<-table.element(a, round(mysum$coefficients[i,4],6))
a<-table.element(a, round(mysum$coefficients[i,4]/2,6))
a<-table.row.end(a)
}
a<-table.end(a)
table.save(a,file='mytable2.tab')
a<-table.start()
a<-table.row.start(a)
a<-table.element(a, 'Multiple Linear Regression - Regression Statistics', 2, TRUE)
a<-table.row.end(a)
a<-table.row.start(a)
a<-table.element(a, 'Multiple R',1,TRUE)
a<-table.element(a, sqrt(mysum$r.squared))
a<-table.row.end(a)
a<-table.row.start(a)
a<-table.element(a, 'R-squared',1,TRUE)
a<-table.element(a, mysum$r.squared)
a<-table.row.end(a)
a<-table.row.start(a)
a<-table.element(a, 'Adjusted R-squared',1,TRUE)
a<-table.element(a, mysum$adj.r.squared)
a<-table.row.end(a)
a<-table.row.start(a)
a<-table.element(a, 'F-TEST (value)',1,TRUE)
a<-table.element(a, mysum$fstatistic[1])
a<-table.row.end(a)
a<-table.row.start(a)
a<-table.element(a, 'F-TEST (DF numerator)',1,TRUE)
a<-table.element(a, mysum$fstatistic[2])
a<-table.row.end(a)
a<-table.row.start(a)
a<-table.element(a, 'F-TEST (DF denominator)',1,TRUE)
a<-table.element(a, mysum$fstatistic[3])
a<-table.row.end(a)
a<-table.row.start(a)
a<-table.element(a, 'p-value',1,TRUE)
a<-table.element(a, 1-pf(mysum$fstatistic[1],mysum$fstatistic[2],mysum$fstatistic[3]))
a<-table.row.end(a)
a<-table.row.start(a)
a<-table.element(a, 'Multiple Linear Regression - Residual Statistics', 2, TRUE)
a<-table.row.end(a)
a<-table.row.start(a)
a<-table.element(a, 'Residual Standard Deviation',1,TRUE)
a<-table.element(a, mysum$sigma)
a<-table.row.end(a)
a<-table.row.start(a)
a<-table.element(a, 'Sum Squared Residuals',1,TRUE)
a<-table.element(a, sum(myerror*myerror))
a<-table.row.end(a)
a<-table.end(a)
table.save(a,file='mytable3.tab')
a<-table.start()
a<-table.row.start(a)
a<-table.element(a, 'Multiple Linear Regression - Actuals, Interpolation, and Residuals', 4, TRUE)
a<-table.row.end(a)
a<-table.row.start(a)
a<-table.element(a, 'Time or Index', 1, TRUE)
a<-table.element(a, 'Actuals', 1, TRUE)
a<-table.element(a, 'Interpolation
Forecast', 1, TRUE)
a<-table.element(a, 'Residuals
Prediction Error', 1, TRUE)
a<-table.row.end(a)
for (i in 1:n) {
a<-table.row.start(a)
a<-table.element(a,i, 1, TRUE)
a<-table.element(a,x[i])
a<-table.element(a,x[i]-mysum$resid[i])
a<-table.element(a,mysum$resid[i])
a<-table.row.end(a)
}
a<-table.end(a)
table.save(a,file='mytable4.tab')
if (n > n25) {
a<-table.start()
a<-table.row.start(a)
a<-table.element(a,'Goldfeld-Quandt test for Heteroskedasticity',4,TRUE)
a<-table.row.end(a)
a<-table.row.start(a)
a<-table.element(a,'p-values',header=TRUE)
a<-table.element(a,'Alternative Hypothesis',3,header=TRUE)
a<-table.row.end(a)
a<-table.row.start(a)
a<-table.element(a,'breakpoint index',header=TRUE)
a<-table.element(a,'greater',header=TRUE)
a<-table.element(a,'2-sided',header=TRUE)
a<-table.element(a,'less',header=TRUE)
a<-table.row.end(a)
for (mypoint in kp3:nmkm3) {
a<-table.row.start(a)
a<-table.element(a,mypoint,header=TRUE)
a<-table.element(a,gqarr[mypoint-kp3+1,1])
a<-table.element(a,gqarr[mypoint-kp3+1,2])
a<-table.element(a,gqarr[mypoint-kp3+1,3])
a<-table.row.end(a)
}
a<-table.end(a)
table.save(a,file='mytable5.tab')
a<-table.start()
a<-table.row.start(a)
a<-table.element(a,'Meta Analysis of Goldfeld-Quandt test for Heteroskedasticity',4,TRUE)
a<-table.row.end(a)
a<-table.row.start(a)
a<-table.element(a,'Description',header=TRUE)
a<-table.element(a,'# significant tests',header=TRUE)
a<-table.element(a,'% significant tests',header=TRUE)
a<-table.element(a,'OK/NOK',header=TRUE)
a<-table.row.end(a)
a<-table.row.start(a)
a<-table.element(a,'1% type I error level',header=TRUE)
a<-table.element(a,numsignificant1)
a<-table.element(a,numsignificant1/numgqtests)
if (numsignificant1/numgqtests < 0.01) dum <- 'OK' else dum <- 'NOK'
a<-table.element(a,dum)
a<-table.row.end(a)
a<-table.row.start(a)
a<-table.element(a,'5% type I error level',header=TRUE)
a<-table.element(a,numsignificant5)
a<-table.element(a,numsignificant5/numgqtests)
if (numsignificant5/numgqtests < 0.05) dum <- 'OK' else dum <- 'NOK'
a<-table.element(a,dum)
a<-table.row.end(a)
a<-table.row.start(a)
a<-table.element(a,'10% type I error level',header=TRUE)
a<-table.element(a,numsignificant10)
a<-table.element(a,numsignificant10/numgqtests)
if (numsignificant10/numgqtests < 0.1) dum <- 'OK' else dum <- 'NOK'
a<-table.element(a,dum)
a<-table.row.end(a)
a<-table.end(a)
table.save(a,file='mytable6.tab')
}