| Multiple Linear Regression - Estimated Regression Equation |
| Investgoed[t] = + 2.26371392062023 + 0.970890252831042Uitvoer[t] -27.0259952474602M1[t] -18.0960455070252M2[t] -10.3481032400426M3[t] -13.9322023492286M4[t] -13.4373301649736M5[t] -0.228784107182265M6[t] -14.9263279733971M7[t] -8.48247154905135M8[t] -4.74716796666329M9[t] -9.9347654845262M10[t] -11.4879879092140M11[t] + e[t] |
| Multiple Linear Regression - Ordinary Least Squares | |||||
| Variable | Parameter | S.D. | T-STAT H0: parameter = 0 | 2-tail p-value | 1-tail p-value |
| (Intercept) | 2.26371392062023 | 7.552077 | 0.2997 | 0.765692 | 0.382846 |
| Uitvoer | 0.970890252831042 | 0.051592 | 18.8186 | 0 | 0 |
| M1 | -27.0259952474602 | 3.190163 | -8.4717 | 0 | 0 |
| M2 | -18.0960455070252 | 3.432269 | -5.2723 | 3e-06 | 2e-06 |
| M3 | -10.3481032400426 | 3.120221 | -3.3165 | 0.001764 | 0.000882 |
| M4 | -13.9322023492286 | 3.117429 | -4.4691 | 4.9e-05 | 2.5e-05 |
| M5 | -13.4373301649736 | 3.149149 | -4.267 | 9.5e-05 | 4.8e-05 |
| M6 | -0.228784107182265 | 3.295157 | -0.0694 | 0.944942 | 0.472471 |
| M7 | -14.9263279733971 | 3.232022 | -4.6183 | 3e-05 | 1.5e-05 |
| M8 | -8.48247154905135 | 3.210537 | -2.6421 | 0.011156 | 0.005578 |
| M9 | -4.74716796666329 | 3.116377 | -1.5233 | 0.134385 | 0.067193 |
| M10 | -9.9347654845262 | 3.169961 | -3.134 | 0.002968 | 0.001484 |
| M11 | -11.4879879092140 | 3.159798 | -3.6357 | 0.000686 | 0.000343 |
| Multiple Linear Regression - Regression Statistics | |
| Multiple R | 0.969120209849607 |
| R-squared | 0.939193981138947 |
| Adjusted R-squared | 0.923669040153146 |
| F-TEST (value) | 60.4958165057075 |
| F-TEST (DF numerator) | 12 |
| F-TEST (DF denominator) | 47 |
| p-value | 0 |
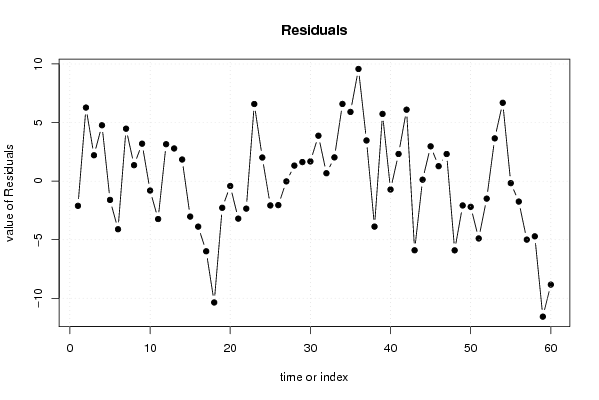
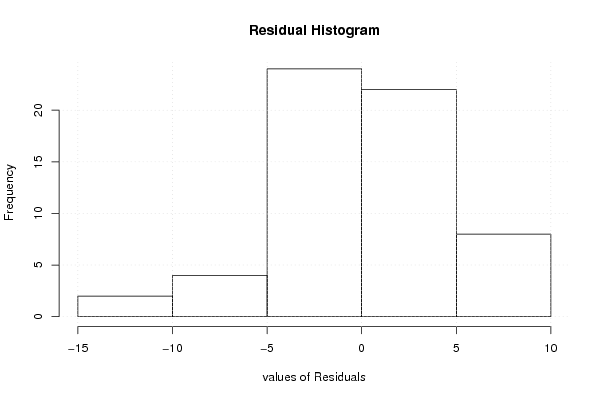
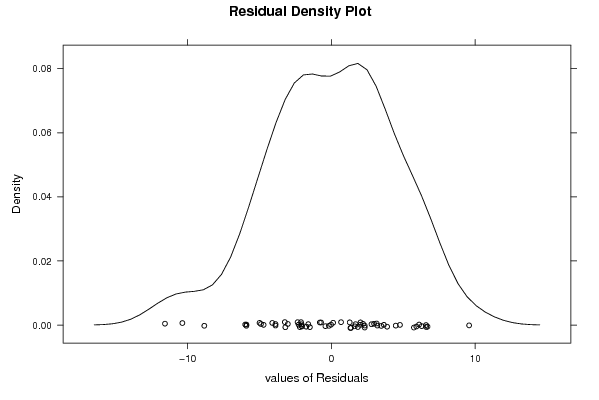
| Multiple Linear Regression - Residual Statistics | |
| Residual Standard Deviation | 4.92674642846338 |
| Sum Squared Residuals | 1140.82302740770 |
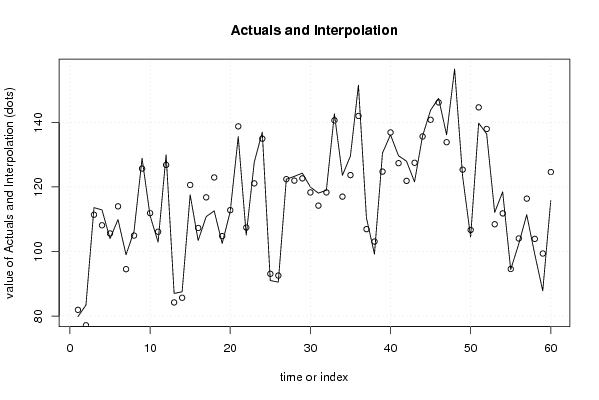
| Multiple Linear Regression - Actuals, Interpolation, and Residuals | |||
| Time or Index | Actuals | Interpolation Forecast | Residuals Prediction Error |
| 1 | 79.8 | 81.9094307517059 | -2.10943075170587 |
| 2 | 83.4 | 77.1207012196388 | 6.27929878036116 |
| 3 | 113.6 | 111.393365193966 | 2.20663480603439 |
| 4 | 112.9 | 108.129659868214 | 4.77034013178617 |
| 5 | 104 | 105.605063366164 | -1.60506336616429 |
| 6 | 109.9 | 114.007702672442 | -4.10770267244194 |
| 7 | 99 | 94.52366985977 | 4.47633014022993 |
| 8 | 106.3 | 104.938467418195 | 1.36153258180521 |
| 9 | 128.9 | 125.703186035239 | 3.19681396476068 |
| 10 | 111.1 | 111.903791974765 | -0.80379197476507 |
| 11 | 102.9 | 106.136905852791 | -3.23690585279057 |
| 12 | 130 | 126.848351163899 | 3.15164883610054 |
| 13 | 87 | 84.210440650916 | 2.78955934908395 |
| 14 | 87.5 | 85.6548265420237 | 1.84517345797628 |
| 15 | 117.6 | 120.626531498389 | -3.0265314983888 |
| 16 | 103.4 | 107.284985348251 | -3.8849853482508 |
| 17 | 110.8 | 116.789719078778 | -5.9897190787779 |
| 18 | 112.6 | 122.959310803544 | -10.3593108035442 |
| 19 | 102.5 | 104.776270929666 | -2.27627092966585 |
| 20 | 112.4 | 112.812387368655 | -0.412387368654536 |
| 21 | 135.6 | 138.80049554593 | -3.20049554593010 |
| 22 | 105.1 | 107.447405714271 | -2.34740571427059 |
| 23 | 127.7 | 121.117742453974 | 6.58225754602643 |
| 24 | 137 | 134.984411482624 | 2.01558851737642 |
| 25 | 91 | 93.0746686592635 | -2.07466865926346 |
| 26 | 90.5 | 92.5481473371241 | -2.04814733712411 |
| 27 | 122.4 | 122.422678466126 | -0.0226784661262075 |
| 28 | 123.3 | 121.974554873584 | 1.32544512641552 |
| 29 | 124.3 | 122.673314010934 | 1.62668598906599 |
| 30 | 120 | 118.318455395012 | 1.68154460498822 |
| 31 | 118.1 | 114.223033089712 | 3.87696691028810 |
| 32 | 119 | 118.327044004735 | 0.672955995265134 |
| 33 | 142.7 | 140.674313733894 | 2.02568626610601 |
| 34 | 123.6 | 117.010674704656 | 6.58932529534365 |
| 35 | 129.6 | 123.690601623976 | 5.90939837602416 |
| 36 | 151.6 | 142.023365815649 | 9.57663418435136 |
| 37 | 110.4 | 106.929272567162 | 3.47072743283759 |
| 38 | 99.2 | 103.082306580341 | -3.88230658034092 |
| 39 | 130.5 | 124.762523975449 | 5.73747602455095 |
| 40 | 136.2 | 136.916555864654 | -0.716555864654212 |
| 41 | 129.7 | 127.382131737165 | 2.31786826283543 |
| 42 | 128 | 121.901040427958 | 6.09895957204168 |
| 43 | 121.6 | 127.504811748441 | -5.90481174844057 |
| 44 | 135.8 | 135.676852822826 | 0.123147177174423 |
| 45 | 143.8 | 140.829656174347 | 2.97034382565304 |
| 46 | 147.5 | 146.224762412342 | 1.27523758765761 |
| 47 | 136.2 | 133.884949278702 | 2.31505072129821 |
| 48 | 156.6 | 162.509150150384 | -5.90915015038364 |
| 49 | 123.3 | 125.376187370952 | -2.07618737095221 |
| 50 | 104.5 | 106.694018320872 | -2.1940183208724 |
| 51 | 139.8 | 144.694900866070 | -4.89490086607033 |
| 52 | 136.5 | 137.994244045297 | -1.49424404529667 |
| 53 | 112.1 | 108.449771806959 | 3.65022819304077 |
| 54 | 118.5 | 111.813490701044 | 6.68650929895621 |
| 55 | 94.4 | 94.5722143724116 | -0.172214372411607 |
| 56 | 102.3 | 104.045248385590 | -1.74524838559023 |
| 57 | 111.4 | 116.392348510590 | -4.99234851058963 |
| 58 | 99.2 | 103.913365193966 | -4.7133651939656 |
| 59 | 87.8 | 99.3698007905582 | -11.5698007905582 |
| 60 | 115.8 | 124.634721387445 | -8.83472138744469 |
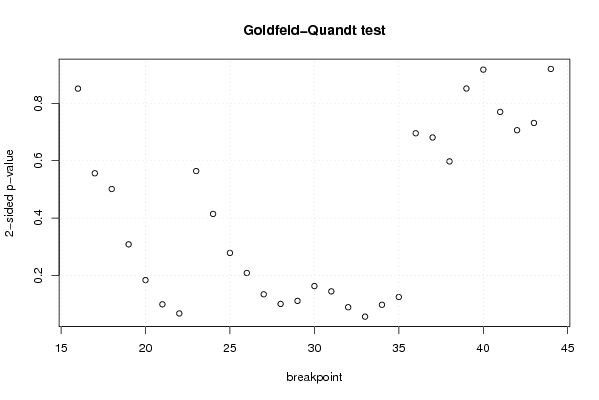
| Goldfeld-Quandt test for Heteroskedasticity | |||
| p-values | Alternative Hypothesis | ||
| breakpoint index | greater | 2-sided | less |
| 16 | 0.42567927537233 | 0.85135855074466 | 0.57432072462767 |
| 17 | 0.278205141820166 | 0.556410283640333 | 0.721794858179833 |
| 18 | 0.250701133668846 | 0.501402267337691 | 0.749298866331154 |
| 19 | 0.154307549099868 | 0.308615098199737 | 0.845692450900132 |
| 20 | 0.0920035425870273 | 0.184007085174055 | 0.907996457412973 |
| 21 | 0.0497721142270282 | 0.0995442284540565 | 0.950227885772972 |
| 22 | 0.0338840099723498 | 0.0677680199446996 | 0.96611599002765 |
| 23 | 0.282027984585377 | 0.564055969170755 | 0.717972015414623 |
| 24 | 0.207292483307993 | 0.414584966615985 | 0.792707516692007 |
| 25 | 0.139321462106380 | 0.278642924212760 | 0.86067853789362 |
| 26 | 0.104406598454236 | 0.208813196908472 | 0.895593401545764 |
| 27 | 0.0672309883276781 | 0.134461976655356 | 0.932769011672322 |
| 28 | 0.0505026578288477 | 0.101005315657695 | 0.949497342171152 |
| 29 | 0.0557484422301361 | 0.111496884460272 | 0.944251557769864 |
| 30 | 0.0815684313546397 | 0.163136862709279 | 0.91843156864536 |
| 31 | 0.0723223421864274 | 0.144644684372855 | 0.927677657813573 |
| 32 | 0.0446921870903954 | 0.0893843741807908 | 0.955307812909605 |
| 33 | 0.0282804214236456 | 0.0565608428472912 | 0.971719578576354 |
| 34 | 0.0489514056610633 | 0.0979028113221265 | 0.951048594338937 |
| 35 | 0.0625016057923279 | 0.125003211584656 | 0.937498394207672 |
| 36 | 0.347875399433127 | 0.695750798866253 | 0.652124600566873 |
| 37 | 0.340546494780574 | 0.681092989561147 | 0.659453505219426 |
| 38 | 0.298796901821419 | 0.597593803642839 | 0.70120309817858 |
| 39 | 0.5741596042603 | 0.8516807914794 | 0.4258403957397 |
| 40 | 0.458789312192327 | 0.917578624384655 | 0.541210687807673 |
| 41 | 0.38508529423509 | 0.77017058847018 | 0.61491470576491 |
| 42 | 0.353211078201432 | 0.706422156402865 | 0.646788921798568 |
| 43 | 0.634170856292149 | 0.731658287415702 | 0.365829143707851 |
| 44 | 0.540025137082665 | 0.91994972583467 | 0.459974862917335 |
| Meta Analysis of Goldfeld-Quandt test for Heteroskedasticity | |||
| Description | # significant tests | % significant tests | OK/NOK |
| 1% type I error level | 0 | 0 | OK |
| 5% type I error level | 0 | 0 | OK |
| 10% type I error level | 5 | 0.172413793103448 | NOK |