| Multiple Linear Regression - Estimated Regression Equation |
| Investgoed[t] = -19.5460387116700 + 1.05414769523628Uitvoer[t] + e[t] |
| Multiple Linear Regression - Ordinary Least Squares | |||||
| Variable | Parameter | S.D. | T-STAT H0: parameter = 0 | 2-tail p-value | 1-tail p-value |
| (Intercept) | -19.5460387116700 | 9.601756 | -2.0357 | 0.04636 | 0.02318 |
| Uitvoer | 1.05414769523628 | 0.073841 | 14.2759 | 0 | 0 |
| Multiple Linear Regression - Regression Statistics | |
| Multiple R | 0.882302368236196 |
| R-squared | 0.7784574689952 |
| Adjusted R-squared | 0.774637770184773 |
| F-TEST (value) | 203.800746506519 |
| F-TEST (DF numerator) | 1 |
| F-TEST (DF denominator) | 58 |
| p-value | 0 |
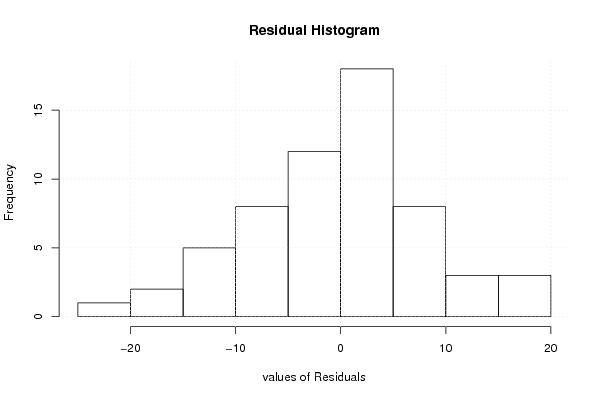
| Multiple Linear Regression - Residual Statistics | |
| Residual Standard Deviation | 8.46545711885406 |
| Sum Squared Residuals | 4156.5099254071 |
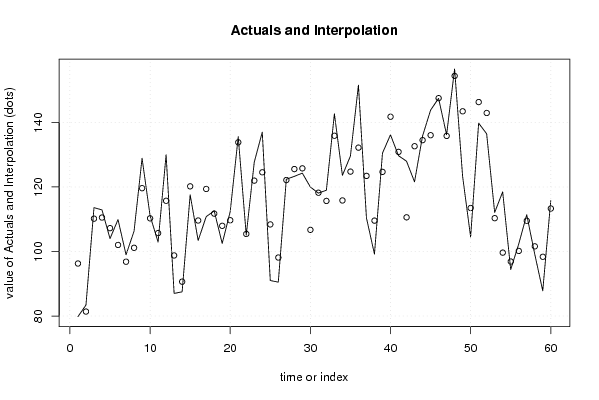
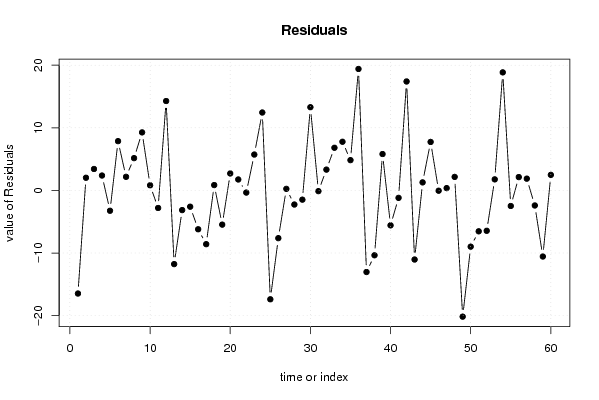
| Multiple Linear Regression - Actuals, Interpolation, and Residuals | |||
| Time or Index | Actuals | Interpolation Forecast | Residuals Prediction Error |
| 1 | 79.8 | 96.2731685639392 | -16.4731685639392 |
| 2 | 83.4 | 81.3780616302512 | 2.02193836974879 |
| 3 | 113.6 | 110.177376664106 | 3.42262333589361 |
| 4 | 112.9 | 110.525245403534 | 2.37475459646565 |
| 5 | 104 | 107.246846071350 | -3.24684607134953 |
| 6 | 109.9 | 102.02881497993 | 7.87118502007006 |
| 7 | 99 | 96.831866842415 | 2.16813315758491 |
| 8 | 106.3 | 101.143330915931 | 5.15666908406853 |
| 9 | 128.9 | 119.633081490376 | 9.2669185096242 |
| 10 | 111.1 | 110.28279143363 | 0.81720856636999 |
| 11 | 102.9 | 105.707790436305 | -2.80779043630455 |
| 12 | 130 | 115.722193541049 | 14.2778064589508 |
| 13 | 87 | 98.7714986016498 | -11.7714986016498 |
| 14 | 87.5 | 90.6440198713781 | -3.14401987137813 |
| 15 | 117.6 | 120.202321245803 | -2.60232124580339 |
| 16 | 103.4 | 109.608136908679 | -6.20813690867878 |
| 17 | 110.8 | 119.390627520471 | -8.59062752047147 |
| 18 | 112.6 | 111.748056730008 | 0.851943269991563 |
| 19 | 102.5 | 107.963666504110 | -5.46366650411019 |
| 20 | 112.4 | 109.692468724298 | 2.70753127570232 |
| 21 | 135.6 | 133.853533899113 | 1.74646610088678 |
| 22 | 105.1 | 105.444253512495 | -0.344253512495486 |
| 23 | 127.7 | 121.973289373800 | 5.72671062619966 |
| 24 | 137 | 124.555951227129 | 12.4440487728708 |
| 25 | 91 | 108.395867059157 | -17.3958670591571 |
| 26 | 90.5 | 98.1284685075557 | -7.62846850755571 |
| 27 | 122.4 | 122.152494481990 | 0.247505518009512 |
| 28 | 123.3 | 125.557391537604 | -2.2573915376037 |
| 29 | 124.3 | 125.778762553603 | -1.47876255360332 |
| 30 | 120 | 106.709230746779 | 13.2907692532210 |
| 31 | 118.1 | 118.220523578759 | -0.12052357875919 |
| 32 | 119 | 115.680027633240 | 3.31997236676024 |
| 33 | 142.7 | 135.888038950919 | 6.81196104908078 |
| 34 | 123.6 | 115.827608310573 | 7.77239168942717 |
| 35 | 129.6 | 124.766780766176 | 4.83321923382351 |
| 36 | 151.6 | 132.198522017592 | 19.4014779824078 |
| 37 | 110.4 | 123.438554670179 | -13.0385546701787 |
| 38 | 99.2 | 109.565971000869 | -10.3659710008693 |
| 39 | 130.5 | 124.69299042751 | 5.80700957249005 |
| 40 | 136.2 | 141.78072456729 | -5.58072456729002 |
| 41 | 129.7 | 130.891378875499 | -1.19137887549928 |
| 42 | 128 | 110.599035742201 | 17.4009642577991 |
| 43 | 121.6 | 132.641264049591 | -11.0412640495915 |
| 44 | 135.8 | 134.517646947112 | 1.28235305288795 |
| 45 | 143.8 | 136.056702582157 | 7.74329741784297 |
| 46 | 147.5 | 147.546912460232 | -0.04691246023245 |
| 47 | 136.2 | 135.835331566157 | 0.364668433842576 |
| 48 | 156.6 | 154.441038387078 | 2.15896161292226 |
| 49 | 123.3 | 143.467360879668 | -20.1673608796681 |
| 50 | 104.5 | 113.487400427148 | -8.9874004271483 |
| 51 | 139.8 | 146.334642610711 | -6.53464261071074 |
| 52 | 136.5 | 142.950828509002 | -6.45082850900229 |
| 53 | 112.1 | 110.335498818392 | 1.76450118160818 |
| 54 | 118.5 | 99.646441188696 | 18.8535588113041 |
| 55 | 94.4 | 96.8845742271769 | -2.4845742271769 |
| 56 | 102.3 | 100.173515036314 | 2.12648496368591 |
| 57 | 111.4 | 109.523805093060 | 1.87619490694012 |
| 58 | 99.2 | 101.607155901835 | -2.40715590183544 |
| 59 | 87.8 | 98.3603810005077 | -10.5603810005077 |
| 60 | 115.8 | 113.318736795910 | 2.4812632040895 |
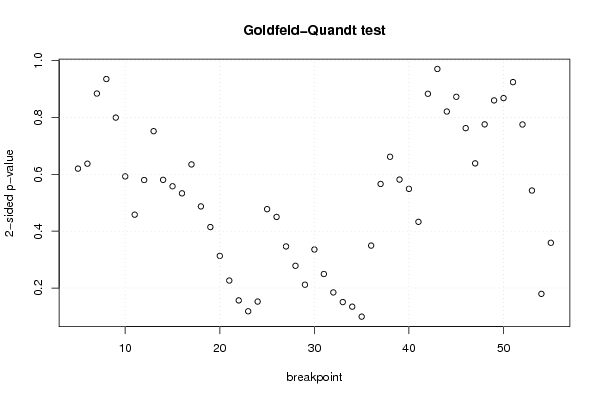
| Goldfeld-Quandt test for Heteroskedasticity | |||
| p-values | Alternative Hypothesis | ||
| breakpoint index | greater | 2-sided | less |
| 5 | 0.689885278567949 | 0.620229442864101 | 0.310114721432051 |
| 6 | 0.681280591178815 | 0.637438817642369 | 0.318719408821185 |
| 7 | 0.557853505457964 | 0.884292989084071 | 0.442146494542036 |
| 8 | 0.46768592606841 | 0.93537185213682 | 0.53231407393159 |
| 9 | 0.399840024239486 | 0.799680048478972 | 0.600159975760514 |
| 10 | 0.296422276171837 | 0.592844552343674 | 0.703577723828163 |
| 11 | 0.229082988929358 | 0.458165977858715 | 0.770917011070642 |
| 12 | 0.290025986739472 | 0.580051973478944 | 0.709974013260528 |
| 13 | 0.375954310006026 | 0.751908620012052 | 0.624045689993974 |
| 14 | 0.290329644564593 | 0.580659289129185 | 0.709670355435407 |
| 15 | 0.279025033639344 | 0.558050067278689 | 0.720974966360656 |
| 16 | 0.266623588752707 | 0.533247177505414 | 0.733376411247293 |
| 17 | 0.317468876119549 | 0.634937752239098 | 0.682531123880451 |
| 18 | 0.243615231711748 | 0.487230463423495 | 0.756384768288252 |
| 19 | 0.207272221034355 | 0.414544442068711 | 0.792727778965645 |
| 20 | 0.156511783428864 | 0.313023566857727 | 0.843488216571136 |
| 21 | 0.113187967986784 | 0.226375935973569 | 0.886812032013216 |
| 22 | 0.0782749386674313 | 0.156549877334863 | 0.921725061332569 |
| 23 | 0.0591284458295114 | 0.118256891659023 | 0.940871554170489 |
| 24 | 0.0762141566088126 | 0.152428313217625 | 0.923785843391187 |
| 25 | 0.238749423316274 | 0.477498846632548 | 0.761250576683726 |
| 26 | 0.225107098918204 | 0.450214197836408 | 0.774892901081796 |
| 27 | 0.173189614723744 | 0.346379229447487 | 0.826810385276256 |
| 28 | 0.139132437392661 | 0.278264874785321 | 0.86086756260734 |
| 29 | 0.105838802953897 | 0.211677605907793 | 0.894161197046103 |
| 30 | 0.167833692206277 | 0.335667384412554 | 0.832166307793723 |
| 31 | 0.124697767284261 | 0.249395534568522 | 0.87530223271574 |
| 32 | 0.0923048414151722 | 0.184609682830344 | 0.907695158584828 |
| 33 | 0.0753405815146284 | 0.150681163029257 | 0.924659418485372 |
| 34 | 0.0672075458736362 | 0.134415091747272 | 0.932792454126364 |
| 35 | 0.0496798373860346 | 0.0993596747720693 | 0.950320162613965 |
| 36 | 0.174703620274923 | 0.349407240549846 | 0.825296379725077 |
| 37 | 0.283145157395556 | 0.566290314791113 | 0.716854842604444 |
| 38 | 0.330913694433938 | 0.661827388867876 | 0.669086305566062 |
| 39 | 0.290799284432918 | 0.581598568865836 | 0.709200715567082 |
| 40 | 0.274429910639939 | 0.548859821279878 | 0.725570089360061 |
| 41 | 0.216468784821717 | 0.432937569643434 | 0.783531215178283 |
| 42 | 0.441744747567693 | 0.883489495135385 | 0.558255252432307 |
| 43 | 0.485429092088717 | 0.970858184177434 | 0.514570907911283 |
| 44 | 0.410541332288996 | 0.821082664577993 | 0.589458667711004 |
| 45 | 0.436439921266179 | 0.872879842532358 | 0.563560078733821 |
| 46 | 0.381297853438221 | 0.762595706876441 | 0.61870214656178 |
| 47 | 0.319345881355341 | 0.638691762710682 | 0.68065411864466 |
| 48 | 0.387928716638451 | 0.775857433276902 | 0.612071283361549 |
| 49 | 0.56987634063798 | 0.86024731872404 | 0.43012365936202 |
| 50 | 0.565849172425393 | 0.868301655149213 | 0.434150827574607 |
| 51 | 0.462293633261849 | 0.924587266523699 | 0.537706366738151 |
| 52 | 0.387737733149169 | 0.775475466298338 | 0.612262266850831 |
| 53 | 0.271544410271027 | 0.543088820542053 | 0.728455589728973 |
| 54 | 0.910201444906525 | 0.179597110186950 | 0.0897985550934752 |
| 55 | 0.820390270275883 | 0.359219459448234 | 0.179609729724117 |
| Meta Analysis of Goldfeld-Quandt test for Heteroskedasticity | |||
| Description | # significant tests | % significant tests | OK/NOK |
| 1% type I error level | 0 | 0 | OK |
| 5% type I error level | 0 | 0 | OK |
| 10% type I error level | 1 | 0.0196078431372549 | OK |