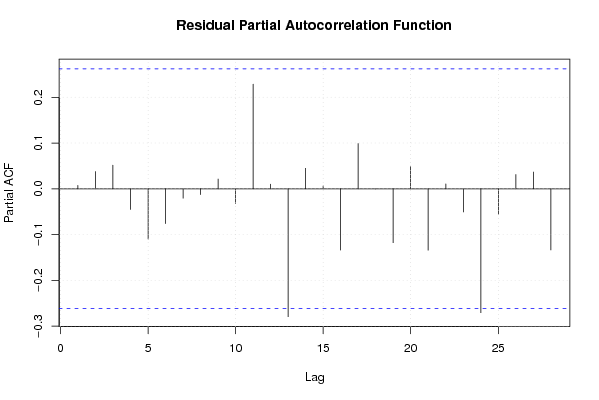
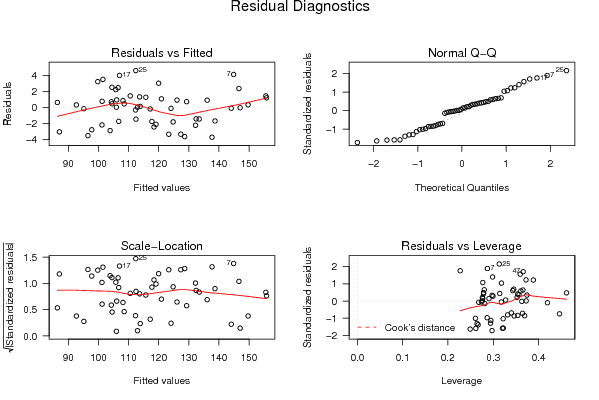
| Multiple Linear Regression - Estimated Regression Equation |
| Y[t] = + 18.7759413459670 + 0.43897739128912X[t] + 1.06333051395152Y1[t] + 0.249611180197316Y2[t] -0.349662551162838Y3[t] -0.075810088056322Y4[t] -0.408726804135841M1[t] -4.56723252040138M2[t] -7.36961206330479M3[t] -5.0991696927366M4[t] -8.4347111814441M5[t] -1.36184987808146M6[t] + 28.6785006089940M7[t] -1.22253043329851M8[t] -18.4328814476152M9[t] -16.4517178213962M10[t] -8.5643761303616M11[t] -0.0744452192710236t + e[t] |
| Multiple Linear Regression - Ordinary Least Squares | |||||
| Variable | Parameter | S.D. | T-STAT H0: parameter = 0 | 2-tail p-value | 1-tail p-value |
| (Intercept) | 18.7759413459670 | 9.864848 | 1.9033 | 0.064594 | 0.032297 |
| X | 0.43897739128912 | 1.456328 | 0.3014 | 0.764732 | 0.382366 |
| Y1 | 1.06333051395152 | 0.162203 | 6.5555 | 0 | 0 |
| Y2 | 0.249611180197316 | 0.236701 | 1.0545 | 0.298294 | 0.149147 |
| Y3 | -0.349662551162838 | 0.244213 | -1.4318 | 0.160377 | 0.080189 |
| Y4 | -0.075810088056322 | 0.184596 | -0.4107 | 0.683613 | 0.341807 |
| M1 | -0.408726804135841 | 2.593196 | -0.1576 | 0.875595 | 0.437797 |
| M2 | -4.56723252040138 | 2.708624 | -1.6862 | 0.099956 | 0.049978 |
| M3 | -7.36961206330479 | 2.486263 | -2.9641 | 0.005217 | 0.002609 |
| M4 | -5.0991696927366 | 2.404027 | -2.1211 | 0.040496 | 0.020248 |
| M5 | -8.4347111814441 | 2.38102 | -3.5425 | 0.001068 | 0.000534 |
| M6 | -1.36184987808146 | 2.590078 | -0.5258 | 0.602086 | 0.301043 |
| M7 | 28.6785006089940 | 2.711993 | 10.5747 | 0 | 0 |
| M8 | -1.22253043329851 | 6.718863 | -0.182 | 0.856585 | 0.428293 |
| M9 | -18.4328814476152 | 7.221391 | -2.5525 | 0.014835 | 0.007418 |
| M10 | -16.4517178213962 | 6.61876 | -2.4856 | 0.017448 | 0.008724 |
| M11 | -8.5643761303616 | 2.682452 | -3.1927 | 0.002829 | 0.001414 |
| t | -0.0744452192710236 | 0.054226 | -1.3729 | 0.177841 | 0.088921 |
| Multiple Linear Regression - Regression Statistics | |
| Multiple R | 0.99241266276863 |
| R-squared | 0.984882893223523 |
| Adjusted R-squared | 0.978119977034046 |
| F-TEST (value) | 145.629912545128 |
| F-TEST (DF numerator) | 17 |
| F-TEST (DF denominator) | 38 |
| p-value | 0 |
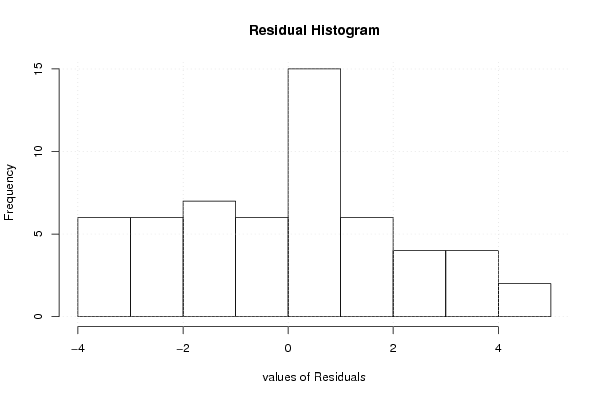
| Multiple Linear Regression - Residual Statistics | |
| Residual Standard Deviation | 2.569251592751 |
| Sum Squared Residuals | 250.840042380435 |
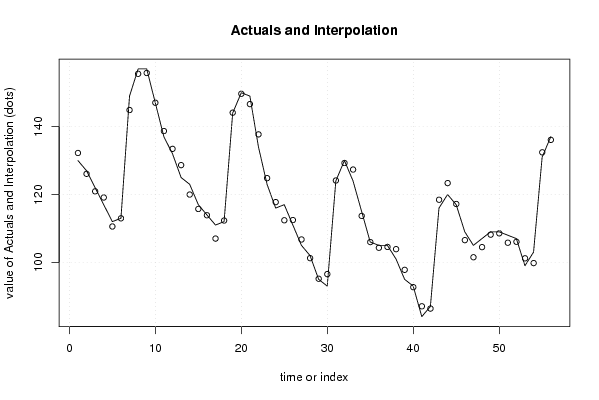
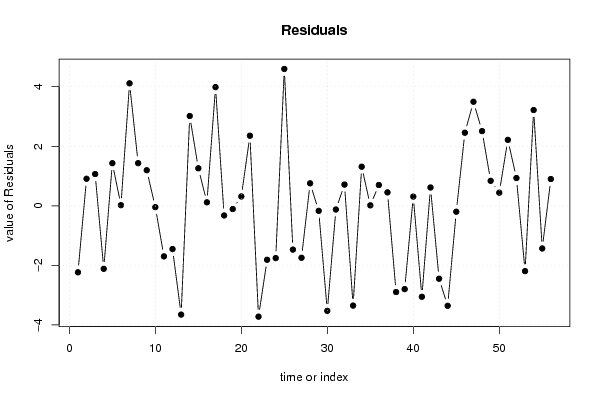
| Multiple Linear Regression - Actuals, Interpolation, and Residuals | |||
| Time or Index | Actuals | Interpolation Forecast | Residuals Prediction Error |
| 1 | 130 | 132.233198453111 | -2.23319845311130 |
| 2 | 127 | 126.091496795332 | 0.908503204667906 |
| 3 | 122 | 120.933375675531 | 1.06662432446888 |
| 4 | 117 | 119.115439824518 | -2.11543982451822 |
| 5 | 112 | 110.568782739566 | 1.43121726043434 |
| 6 | 113 | 112.978233372896 | 0.0217666271037571 |
| 7 | 149 | 144.886776449761 | 4.1132235502386 |
| 8 | 157 | 155.568173066746 | 1.43182693325432 |
| 9 | 157 | 155.805411320992 | 1.19458867900772 |
| 10 | 147 | 147.045357239600 | -0.0453572396002797 |
| 11 | 137 | 138.698484992518 | -1.69848499251837 |
| 12 | 132 | 133.45251825767 | -1.45251825767001 |
| 13 | 125 | 128.653207374161 | -3.65320737416081 |
| 14 | 123 | 119.983613332169 | 3.0163866678314 |
| 15 | 117 | 115.739262917087 | 1.26073708291266 |
| 16 | 114 | 113.882742922702 | 0.117257077297759 |
| 17 | 111 | 107.015093310405 | 3.98490668959482 |
| 18 | 112 | 112.32427979514 | -0.324279795139979 |
| 19 | 144 | 144.108530218130 | -0.108530218130399 |
| 20 | 150 | 149.685659500870 | 0.314340499129698 |
| 21 | 149 | 146.646171830312 | 2.35382816968805 |
| 22 | 134 | 137.722215079225 | -3.72221507922515 |
| 23 | 123 | 124.811644536739 | -1.81164453673928 |
| 24 | 116 | 117.755574114228 | -1.75557411422830 |
| 25 | 117 | 112.404113866489 | 4.59588613351077 |
| 26 | 111 | 112.470654567159 | -1.47065456715903 |
| 27 | 105 | 106.745006728232 | -1.74500672823222 |
| 28 | 102 | 101.244361779868 | 0.75563822013222 |
| 29 | 95 | 95.1688816677715 | -0.168881667771513 |
| 30 | 93 | 96.5279864489255 | -3.52798644892551 |
| 31 | 124 | 124.123800609272 | -0.123800609272107 |
| 32 | 130 | 129.28741604212 | 0.712583957880102 |
| 33 | 124 | 127.350545197078 | -3.35054519707804 |
| 34 | 115 | 113.687028691565 | 1.31297130843456 |
| 35 | 106 | 105.984195419858 | 0.0158045801415627 |
| 36 | 105 | 104.300765862249 | 0.699234137751412 |
| 37 | 105 | 104.548563583207 | 0.451436416793032 |
| 38 | 101 | 103.895255220446 | -2.89525522044554 |
| 39 | 95 | 97.7970617461348 | -2.79706174613477 |
| 40 | 93 | 92.6904411809899 | 0.309558819010125 |
| 41 | 84 | 87.0547765685758 | -3.05477656857577 |
| 42 | 87 | 86.3852113259114 | 0.614788674088596 |
| 43 | 116 | 118.448793144458 | -2.44879314445813 |
| 44 | 120 | 123.357318464659 | -3.35731846465881 |
| 45 | 117 | 117.197871651618 | -0.19787165161773 |
| 46 | 109 | 106.545398989609 | 2.45460101039087 |
| 47 | 105 | 101.505675050884 | 3.49432494911609 |
| 48 | 107 | 104.491141765853 | 2.50885823414690 |
| 49 | 109 | 108.160916723032 | 0.83908327696831 |
| 50 | 109 | 108.558980084895 | 0.441019915105264 |
| 51 | 108 | 105.785292933015 | 2.21470706698545 |
| 52 | 107 | 106.067014291922 | 0.932985708078123 |
| 53 | 99 | 101.192465713682 | -2.19246571368187 |
| 54 | 103 | 99.7842890571269 | 3.21571094287314 |
| 55 | 131 | 132.432099578378 | -1.43209957837797 |
| 56 | 137 | 136.101432925605 | 0.898567074394699 |
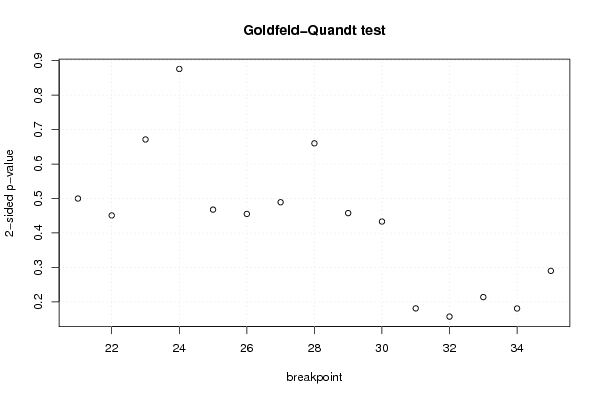
| Goldfeld-Quandt test for Heteroskedasticity | |||
| p-values | Alternative Hypothesis | ||
| breakpoint index | greater | 2-sided | less |
| 21 | 0.249958727363467 | 0.499917454726934 | 0.750041272636533 |
| 22 | 0.77455260270758 | 0.450894794584840 | 0.225447397292420 |
| 23 | 0.664279642287847 | 0.671440715424307 | 0.335720357712153 |
| 24 | 0.561926616149368 | 0.876146767701265 | 0.438073383850632 |
| 25 | 0.766115767680358 | 0.467768464639284 | 0.233884232319642 |
| 26 | 0.77241699970985 | 0.455166000580301 | 0.227583000290151 |
| 27 | 0.755418740625895 | 0.48916251874821 | 0.244581259374105 |
| 28 | 0.669902495308256 | 0.660195009383487 | 0.330097504691744 |
| 29 | 0.771208230255386 | 0.457583539489228 | 0.228791769744614 |
| 30 | 0.783425491009329 | 0.433149017981343 | 0.216574508990671 |
| 31 | 0.909450811272196 | 0.181098377455609 | 0.0905491887278044 |
| 32 | 0.921487528457456 | 0.157024943085087 | 0.0785124715425436 |
| 33 | 0.893089977647141 | 0.213820044705717 | 0.106910022352859 |
| 34 | 0.909606872183835 | 0.180786255632330 | 0.0903931278161648 |
| 35 | 0.855002073601457 | 0.289995852797087 | 0.144997926398543 |
| Meta Analysis of Goldfeld-Quandt test for Heteroskedasticity | |||
| Description | # significant tests | % significant tests | OK/NOK |
| 1% type I error level | 0 | 0 | OK |
| 5% type I error level | 0 | 0 | OK |
| 10% type I error level | 0 | 0 | OK |