| Multiple Linear Regression - Estimated Regression Equation |
| Y-1[t] = + 3.06826597807372 + 1.72596113445732`Y-7`[t] + 0.265700076265070`Y-8`[t] -1.32495159043329`Y-11`[t] -0.0604280458310303M1[t] -0.103472111491764M2[t] -0.0640751407679319M3[t] -0.217516798129260M4[t] -0.135389671420886M5[t] -0.174165679050416M6[t] -0.223052423531165M7[t] -0.168679402799261M8[t] -0.160923645373383M9[t] -0.0802778065192143M10[t] -0.084028575548143M11[t] -0.00606277831804904t + e[t] |
| Multiple Linear Regression - Ordinary Least Squares | |||||
| Variable | Parameter | S.D. | T-STAT H0: parameter = 0 | 2-tail p-value | 1-tail p-value |
| (Intercept) | 3.06826597807372 | 1.22986 | 2.4948 | 0.017471 | 0.008735 |
| `Y-7` | 1.72596113445732 | 0.449823 | 3.837 | 0.000499 | 0.000249 |
| `Y-8` | 0.265700076265070 | 0.570509 | 0.4657 | 0.644298 | 0.322149 |
| `Y-11` | -1.32495159043329 | 0.230478 | -5.7487 | 2e-06 | 1e-06 |
| M1 | -0.0604280458310303 | 0.135006 | -0.4476 | 0.657203 | 0.328602 |
| M2 | -0.103472111491764 | 0.127033 | -0.8145 | 0.420849 | 0.210425 |
| M3 | -0.0640751407679319 | 0.126967 | -0.5047 | 0.61696 | 0.30848 |
| M4 | -0.217516798129260 | 0.133917 | -1.6243 | 0.113291 | 0.056646 |
| M5 | -0.135389671420886 | 0.132595 | -1.0211 | 0.314224 | 0.157112 |
| M6 | -0.174165679050416 | 0.136201 | -1.2787 | 0.209404 | 0.104702 |
| M7 | -0.223052423531165 | 0.132209 | -1.6871 | 0.100474 | 0.050237 |
| M8 | -0.168679402799261 | 0.133242 | -1.266 | 0.213887 | 0.106944 |
| M9 | -0.160923645373383 | 0.132056 | -1.2186 | 0.231144 | 0.115572 |
| M10 | -0.0802778065192143 | 0.132017 | -0.6081 | 0.547056 | 0.273528 |
| M11 | -0.084028575548143 | 0.133353 | -0.6301 | 0.532706 | 0.266353 |
| t | -0.00606277831804904 | 0.006136 | -0.988 | 0.329914 | 0.164957 |
| Multiple Linear Regression - Regression Statistics | |
| Multiple R | 0.972818282888942 |
| R-squared | 0.94637541152299 |
| Adjusted R-squared | 0.923393445032841 |
| F-TEST (value) | 41.1790440965398 |
| F-TEST (DF numerator) | 15 |
| F-TEST (DF denominator) | 35 |
| p-value | 0 |
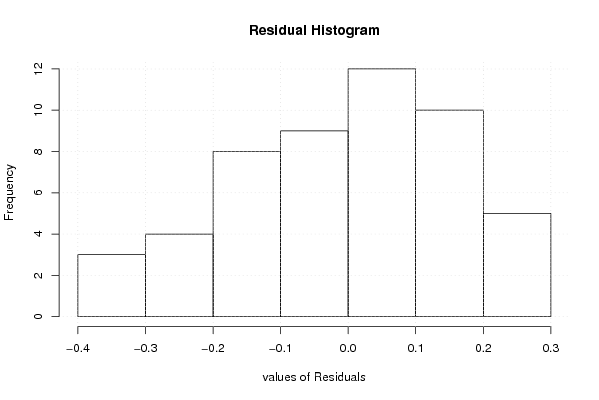
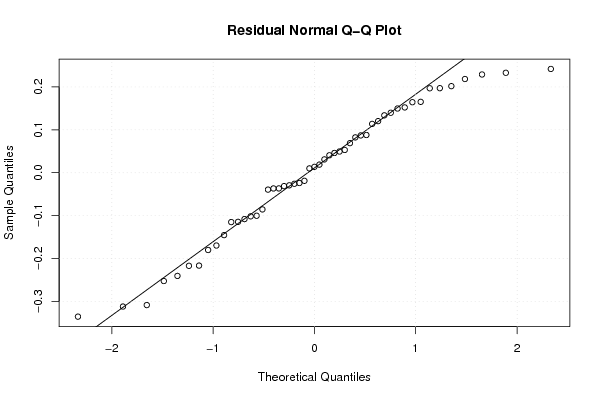
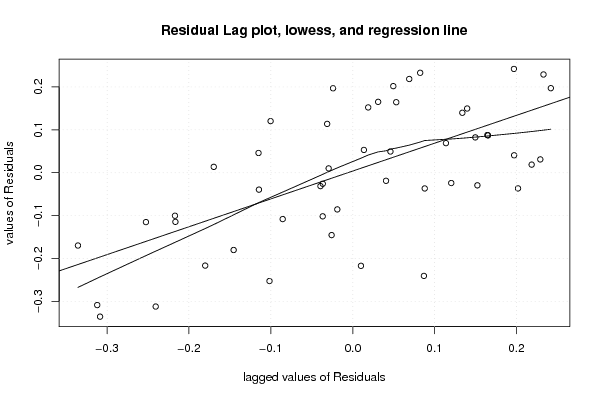
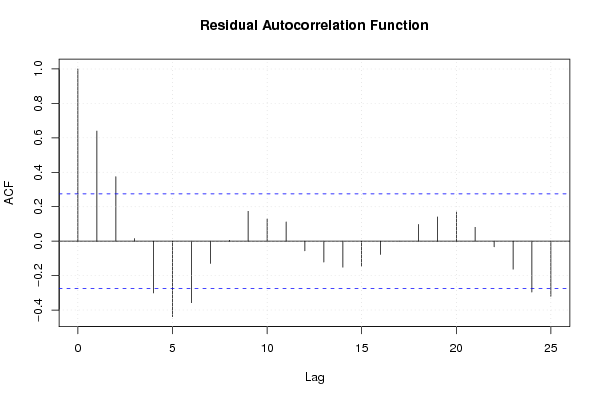
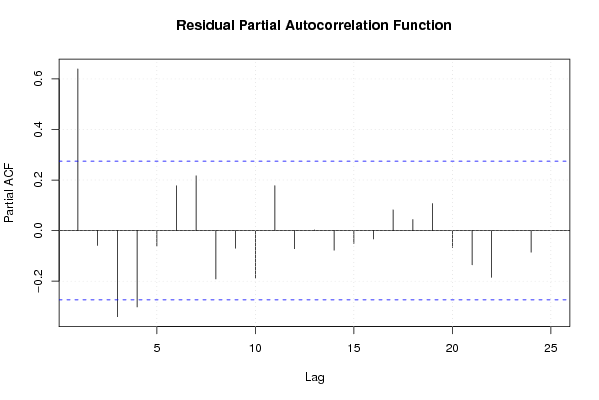
| Multiple Linear Regression - Residual Statistics | |
| Residual Standard Deviation | 0.185945402320779 |
| Sum Squared Residuals | 1.21014924254827 |
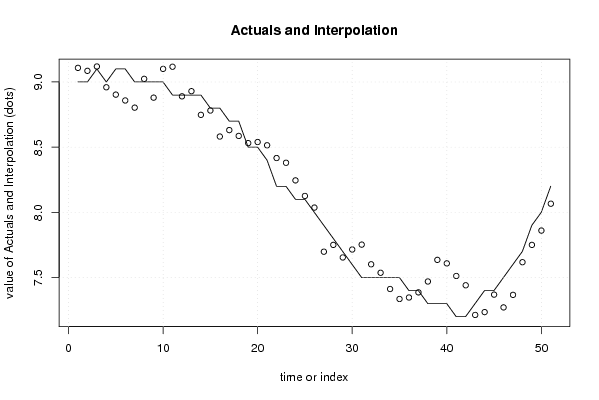
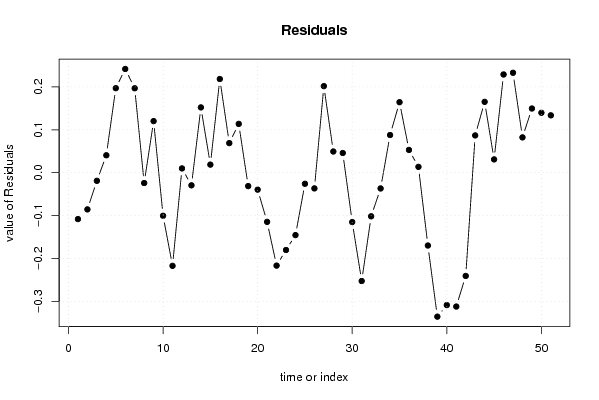
| Multiple Linear Regression - Actuals, Interpolation, and Residuals | |||
| Time or Index | Actuals | Interpolation Forecast | Residuals Prediction Error |
| 1 | 9 | 9.10808688794345 | -0.108086887943447 |
| 2 | 9 | 9.08555005159114 | -0.0855500515911418 |
| 3 | 9.1 | 9.11888424399692 | -0.0188842439969227 |
| 4 | 9 | 8.95937980831754 | 0.0406201916824546 |
| 5 | 9.1 | 8.90294899766454 | 0.197051002335458 |
| 6 | 9.1 | 8.85811021171696 | 0.241889788283037 |
| 7 | 9 | 8.80316068891817 | 0.196839311081836 |
| 8 | 9 | 9.02406704477775 | -0.0240670447777507 |
| 9 | 9 | 8.87973391806636 | 0.120266081933645 |
| 10 | 9 | 9.1003430844217 | -0.100343084421699 |
| 11 | 8.9 | 9.11709954470123 | -0.217099544701229 |
| 12 | 8.9 | 8.88997406944226 | 0.0100259305577380 |
| 13 | 8.9 | 8.92940839671 | -0.0294083967100043 |
| 14 | 8.9 | 8.7478063936879 | 0.152193606312107 |
| 15 | 8.8 | 8.78114058609368 | 0.0188594139063243 |
| 16 | 8.8 | 8.5815351960119 | 0.218464803988105 |
| 17 | 8.7 | 8.63102953677571 | 0.0689704632242854 |
| 18 | 8.7 | 8.58619075082814 | 0.113809249171864 |
| 19 | 8.5 | 8.53124122802934 | -0.0312412280293368 |
| 20 | 8.5 | 8.53945051604079 | -0.039450516040788 |
| 21 | 8.4 | 8.51457348752211 | -0.114573487522110 |
| 22 | 8.2 | 8.4165604346125 | -0.216560434612496 |
| 23 | 8.2 | 8.38017687963901 | -0.180176879639011 |
| 24 | 8.1 | 8.24544560902097 | -0.145445609020969 |
| 25 | 8.1 | 8.12581476961888 | -0.0258147696188757 |
| 26 | 8 | 8.03660697123769 | -0.0366069712376917 |
| 27 | 7.9 | 7.6981789291255 | 0.201821070874500 |
| 28 | 7.8 | 7.75052479627977 | 0.0494752037202332 |
| 29 | 7.7 | 7.65399303122436 | 0.0460069687756409 |
| 30 | 7.6 | 7.7150793966936 | -0.115079396693603 |
| 31 | 7.5 | 7.75252407853573 | -0.252524078535731 |
| 32 | 7.5 | 7.60166819987735 | -0.101668199877347 |
| 33 | 7.5 | 7.53669021695626 | -0.0366902169562639 |
| 34 | 7.5 | 7.41210715642015 | 0.0878928435798552 |
| 35 | 7.5 | 7.33562264704426 | 0.164377352955745 |
| 36 | 7.4 | 7.34691748224544 | 0.0530825177545618 |
| 37 | 7.4 | 7.38635180951318 | 0.0136481904868184 |
| 38 | 7.3 | 7.46974012457773 | -0.169740124577728 |
| 39 | 7.3 | 7.63556947602684 | -0.335569476026841 |
| 40 | 7.3 | 7.6085601993908 | -0.308560199390792 |
| 41 | 7.2 | 7.51202843433538 | -0.312028434335385 |
| 42 | 7.2 | 7.4406196407613 | -0.240619640761299 |
| 43 | 7.3 | 7.21307400451677 | 0.0869259954832325 |
| 44 | 7.4 | 7.23481423930412 | 0.165185760695885 |
| 45 | 7.4 | 7.36900237745527 | 0.0309976225447282 |
| 46 | 7.5 | 7.27098932454566 | 0.22901067545434 |
| 47 | 7.6 | 7.3671009286155 | 0.232899071384494 |
| 48 | 7.7 | 7.61766283929133 | 0.082337160708669 |
| 49 | 7.9 | 7.7503381362145 | 0.149661863785508 |
| 50 | 8 | 7.86029645890555 | 0.139703541094455 |
| 51 | 8.2 | 8.06622676475706 | 0.133773235242939 |
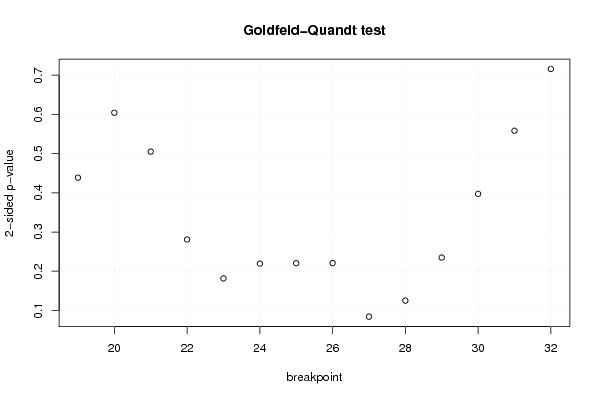
| Goldfeld-Quandt test for Heteroskedasticity | |||
| p-values | Alternative Hypothesis | ||
| breakpoint index | greater | 2-sided | less |
| 19 | 0.219250011706482 | 0.438500023412964 | 0.780749988293518 |
| 20 | 0.30208202999869 | 0.60416405999738 | 0.69791797000131 |
| 21 | 0.747485017375572 | 0.505029965248855 | 0.252514982624428 |
| 22 | 0.859595583382911 | 0.280808833234177 | 0.140404416617089 |
| 23 | 0.909151310589183 | 0.181697378821634 | 0.0908486894108172 |
| 24 | 0.890322044645973 | 0.219355910708053 | 0.109677955354027 |
| 25 | 0.88976168925678 | 0.220476621486442 | 0.110238310743221 |
| 26 | 0.88966547294002 | 0.220669054119959 | 0.110334527059979 |
| 27 | 0.957936028444937 | 0.0841279431101252 | 0.0420639715550626 |
| 28 | 0.937442446072261 | 0.125115107855477 | 0.0625575539277385 |
| 29 | 0.882562902320241 | 0.234874195359518 | 0.117437097679759 |
| 30 | 0.801255912397305 | 0.397488175205390 | 0.198744087602695 |
| 31 | 0.720813250014837 | 0.558373499970325 | 0.279186749985163 |
| 32 | 0.642029050172715 | 0.71594189965457 | 0.357970949827285 |
| Meta Analysis of Goldfeld-Quandt test for Heteroskedasticity | |||
| Description | # significant tests | % significant tests | OK/NOK |
| 1% type I error level | 0 | 0 | OK |
| 5% type I error level | 0 | 0 | OK |
| 10% type I error level | 1 | 0.0714285714285714 | OK |