| Multiple Linear Regression - Estimated Regression Equation |
| Y[t] = + 11.6689654284348 -0.0291376935120574X[t] + 0.607321306663722M1[t] + 0.600890186123138M2[t] + 0.217393662901691M3[t] + 0.127998655073318M4[t] + 0.0859694305114406M5[t] + 0.0723797230840934M6[t] -0.0891585214799912M7[t] -0.0927468185738858M8[t] -0.5528177644784M9[t] -0.549134872845152M10[t] + 0.539514661336017M11[t] + e[t] |
| Multiple Linear Regression - Ordinary Least Squares | |||||
| Variable | Parameter | S.D. | T-STAT H0: parameter = 0 | 2-tail p-value | 1-tail p-value |
| (Intercept) | 11.6689654284348 | 1.947937 | 5.9904 | 0 | 0 |
| X | -0.0291376935120574 | 0.021719 | -1.3416 | 0.186175 | 0.093087 |
| M1 | 0.607321306663722 | 0.660507 | 0.9195 | 0.362541 | 0.181271 |
| M2 | 0.600890186123138 | 0.841453 | 0.7141 | 0.478691 | 0.239345 |
| M3 | 0.217393662901691 | 0.839653 | 0.2589 | 0.796836 | 0.398418 |
| M4 | 0.127998655073318 | 0.749226 | 0.1708 | 0.865082 | 0.432541 |
| M5 | 0.0859694305114406 | 0.666078 | 0.1291 | 0.897855 | 0.448927 |
| M6 | 0.0723797230840934 | 0.668049 | 0.1083 | 0.914183 | 0.457092 |
| M7 | -0.0891585214799912 | 0.68046 | -0.131 | 0.896313 | 0.448157 |
| M8 | -0.0927468185738858 | 0.785247 | -0.1181 | 0.906483 | 0.453241 |
| M9 | -0.5528177644784 | 0.707895 | -0.7809 | 0.438759 | 0.219379 |
| M10 | -0.549134872845152 | 0.701734 | -0.7825 | 0.437822 | 0.218911 |
| M11 | 0.539514661336017 | 0.820422 | 0.6576 | 0.513999 | 0.257 |
| Multiple Linear Regression - Regression Statistics | |
| Multiple R | 0.432682466581798 |
| R-squared | 0.187214116887309 |
| Adjusted R-squared | -0.0203056830563568 |
| F-TEST (value) | 0.902150623401385 |
| F-TEST (DF numerator) | 12 |
| F-TEST (DF denominator) | 47 |
| p-value | 0.551517837201219 |
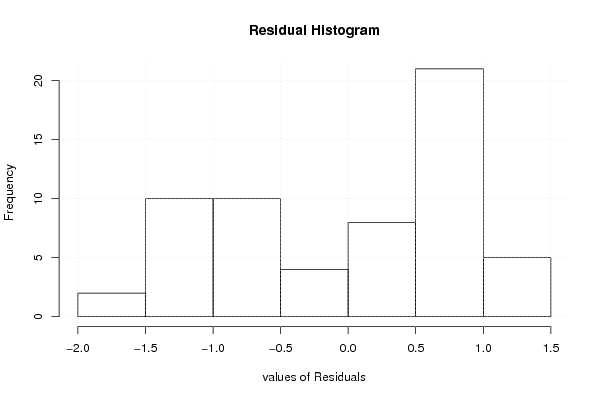
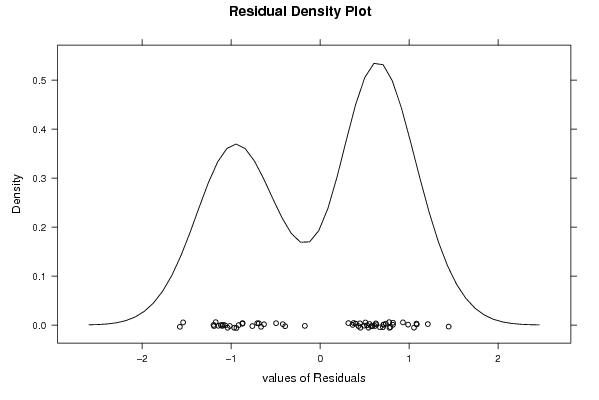
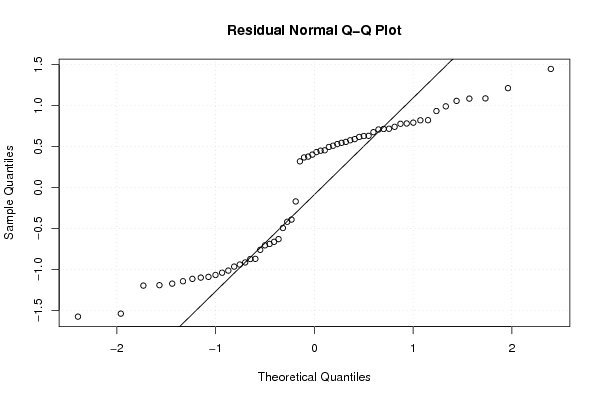
| Multiple Linear Regression - Residual Statistics | |
| Residual Standard Deviation | 0.960789905971162 |
| Sum Squared Residuals | 43.3865104405554 |
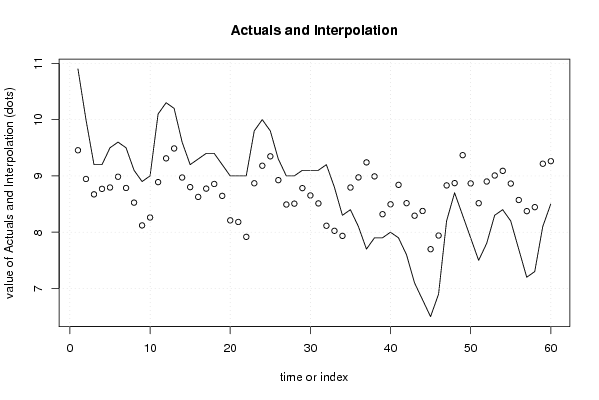
| Multiple Linear Regression - Actuals, Interpolation, and Residuals | |||
| Time or Index | Actuals | Interpolation Forecast | Residuals Prediction Error |
| 1 | 10.9 | 9.45575800313136 | 1.44424199686864 |
| 2 | 10 | 8.94524478483217 | 1.05475521516783 |
| 3 | 9.2 | 8.67247149695654 | 0.527528503043458 |
| 4 | 9.2 | 8.76955772760533 | 0.430442272394663 |
| 5 | 9.5 | 8.79454519812119 | 0.70545480187881 |
| 6 | 9.6 | 8.98491934527824 | 0.615080654721755 |
| 7 | 9.5 | 8.78550209914848 | 0.714497900851515 |
| 8 | 9.1 | 8.52550209914849 | 0.574497900851514 |
| 9 | 8.9 | 8.12079277091688 | 0.77920722908312 |
| 10 | 9 | 8.2614228220568 | 0.738577177943202 |
| 11 | 10.1 | 8.88969679874746 | 1.21030320125254 |
| 12 | 10.3 | 9.31172602330934 | 0.988273976690663 |
| 13 | 10.2 | 9.48780946599461 | 0.712190534005389 |
| 14 | 9.6 | 8.97146870899302 | 0.628531291006978 |
| 15 | 9.2 | 8.8006773484096 | 0.399322651590406 |
| 16 | 9.3 | 8.62678302939625 | 0.673216970603746 |
| 17 | 9.4 | 8.77414881266275 | 0.62585118733725 |
| 18 | 9.4 | 8.8567134938252 | 0.543286506174808 |
| 19 | 9.2 | 8.64564117029061 | 0.554358829709389 |
| 20 | 9 | 8.21081500921827 | 0.789184990781734 |
| 21 | 9 | 8.1819819272922 | 0.818018072707799 |
| 22 | 9 | 7.91759803861452 | 1.08240196138548 |
| 23 | 9.8 | 8.86930041328902 | 0.93069958671098 |
| 24 | 10 | 9.18060640250508 | 0.81939359749492 |
| 25 | 9.8 | 9.34794853713674 | 0.452051462863265 |
| 26 | 9.3 | 8.92484839937373 | 0.37515160062627 |
| 27 | 9 | 8.49181779718178 | 0.508182202818215 |
| 28 | 9 | 8.50731848599682 | 0.492681514003181 |
| 29 | 9.1 | 8.78289012071637 | 0.317109879283632 |
| 30 | 9.1 | 8.65274963924079 | 0.447250360759209 |
| 31 | 9.1 | 8.51160778013515 | 0.588392219864854 |
| 32 | 9.2 | 8.11466062062848 | 1.08533937937152 |
| 33 | 8.8 | 8.02463838232709 | 0.775361617672909 |
| 34 | 8.3 | 7.93508065472176 | 0.364919345278245 |
| 35 | 8.4 | 8.79354241015767 | -0.39354241015767 |
| 36 | 8.1 | 8.97372877856947 | -0.873728778569473 |
| 37 | 7.7 | 9.24013907114212 | -1.54013907114212 |
| 38 | 7.9 | 8.99186509445146 | -1.09186509445146 |
| 39 | 7.9 | 8.31990540546065 | -0.419905405460646 |
| 40 | 8 | 8.495663408592 | -0.495663408591996 |
| 41 | 7.9 | 8.84116550774048 | -0.941165507740482 |
| 42 | 7.6 | 8.51580247973412 | -0.915802479734121 |
| 43 | 7.1 | 8.29307507879472 | -1.19307507879472 |
| 44 | 6.8 | 8.376899862237 | -1.57689986223699 |
| 45 | 6.5 | 7.69829621499205 | -1.19829621499205 |
| 46 | 6.9 | 7.94090819342417 | -1.04090819342417 |
| 47 | 8.2 | 8.83142141172335 | -0.631421411723346 |
| 48 | 8.7 | 8.87174685127727 | -0.171746851277272 |
| 49 | 8.3 | 9.36834492259518 | -1.06834492259518 |
| 50 | 7.9 | 8.86657301234962 | -0.966573012349615 |
| 51 | 7.5 | 8.51512795199143 | -1.01512795199143 |
| 52 | 7.8 | 8.9006773484096 | -1.10067734840959 |
| 53 | 8.3 | 9.00725036075921 | -0.707250360759209 |
| 54 | 8.4 | 9.08981504192165 | -0.689815041921651 |
| 55 | 8.2 | 8.86417387163104 | -0.664173871631041 |
| 56 | 7.7 | 8.57212240876778 | -0.872122408767777 |
| 57 | 7.2 | 8.37429070447178 | -1.17429070447178 |
| 58 | 7.3 | 8.44499029118276 | -1.14499029118276 |
| 59 | 8.1 | 9.2160389660825 | -1.11603896608250 |
| 60 | 8.5 | 9.26219194433884 | -0.762191944338841 |
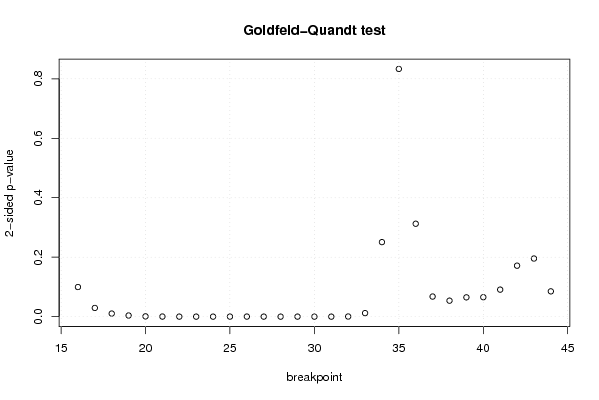
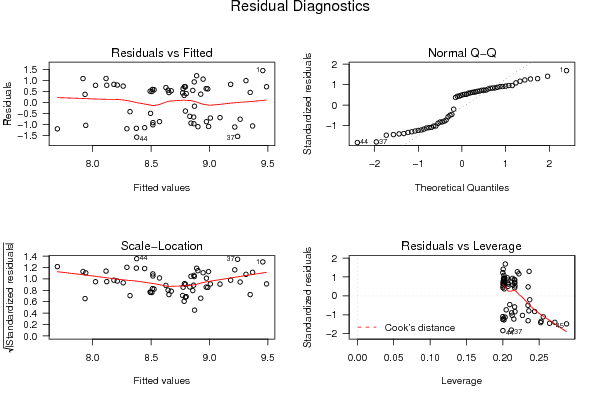
| Goldfeld-Quandt test for Heteroskedasticity | |||
| p-values | Alternative Hypothesis | ||
| breakpoint index | greater | 2-sided | less |
| 16 | 0.0498302496425607 | 0.0996604992851213 | 0.95016975035744 |
| 17 | 0.0146418057354139 | 0.0292836114708277 | 0.985358194264586 |
| 18 | 0.00522302863954832 | 0.0104460572790966 | 0.994776971360452 |
| 19 | 0.00193967031361146 | 0.00387934062722291 | 0.998060329686389 |
| 20 | 0.000519175917824384 | 0.00103835183564877 | 0.999480824082176 |
| 21 | 0.000158765815371608 | 0.000317531630743217 | 0.999841234184628 |
| 22 | 4.98165637385357e-05 | 9.96331274770715e-05 | 0.999950183436261 |
| 23 | 2.65793975185048e-05 | 5.31587950370097e-05 | 0.999973420602482 |
| 24 | 1.45243702952421e-05 | 2.90487405904843e-05 | 0.999985475629705 |
| 25 | 0.000105811826105529 | 0.000211623652211059 | 0.999894188173895 |
| 26 | 0.000138051186280616 | 0.000276102372561232 | 0.99986194881372 |
| 27 | 7.36906955640018e-05 | 0.000147381391128004 | 0.999926309304436 |
| 28 | 3.59986462488199e-05 | 7.19972924976397e-05 | 0.999964001353751 |
| 29 | 2.81432395056632e-05 | 5.62864790113264e-05 | 0.999971856760494 |
| 30 | 1.71129168146047e-05 | 3.42258336292093e-05 | 0.999982887083185 |
| 31 | 1.68471852572519e-05 | 3.36943705145037e-05 | 0.999983152814743 |
| 32 | 0.000231862239657164 | 0.000463724479314328 | 0.999768137760343 |
| 33 | 0.00598736939097136 | 0.0119747387819427 | 0.994012630609029 |
| 34 | 0.125368425707098 | 0.250736851414196 | 0.874631574292902 |
| 35 | 0.583463184585617 | 0.833073630828765 | 0.416536815414383 |
| 36 | 0.843760862661957 | 0.312478274676086 | 0.156239137338043 |
| 37 | 0.966202592577284 | 0.0675948148454324 | 0.0337974074227162 |
| 38 | 0.973122443685408 | 0.0537551126291846 | 0.0268775563145923 |
| 39 | 0.967523704320857 | 0.0649525913582868 | 0.0324762956791434 |
| 40 | 0.967273199392877 | 0.0654536012142463 | 0.0327268006071232 |
| 41 | 0.954540549066303 | 0.0909189018673943 | 0.0454594509336971 |
| 42 | 0.914284036542032 | 0.171431926915935 | 0.0857159634579677 |
| 43 | 0.902273208460038 | 0.195453583079923 | 0.0977267915399617 |
| 44 | 0.957417211526802 | 0.0851655769463962 | 0.0425827884731981 |
| Meta Analysis of Goldfeld-Quandt test for Heteroskedasticity | |||
| Description | # significant tests | % significant tests | OK/NOK |
| 1% type I error level | 14 | 0.482758620689655 | NOK |
| 5% type I error level | 17 | 0.586206896551724 | NOK |
| 10% type I error level | 24 | 0.827586206896552 | NOK |