Free Statistics

of Irreproducible Research!

Author's title

Author*The author of this computation has been verified*
R Software Modulerwasp_multipleregression.wasp
Title produced by softwareMultiple Regression
Date of computationFri, 20 Nov 2009 02:43:44 -0700
Cite this page as followsStatistical Computations at FreeStatistics.org, Office for Research Development and Education, URL https://freestatistics.org/blog/index.php?v=date/2009/Nov/20/t1258710298l8w6f17ag8ht0i5.htm/, Retrieved Sat, 20 Apr 2024 01:51:04 +0000
Statistical Computations at FreeStatistics.org, Office for Research Development and Education, URL https://freestatistics.org/blog/index.php?pk=57998, Retrieved Sat, 20 Apr 2024 01:51:04 +0000
QR Codes:

Original text written by user:
IsPrivate?No (this computation is public)
User-defined keywords
Estimated Impact183
Family? (F = Feedback message, R = changed R code, M = changed R Module, P = changed Parameters, D = changed Data)
-     [Multiple Regression] [Q1 The Seatbeltlaw] [2007-11-14 19:27:43] [8cd6641b921d30ebe00b648d1481bba0]
- RMPD  [Multiple Regression] [Seatbelt] [2009-11-12 14:03:14] [b98453cac15ba1066b407e146608df68]
-    D      [Multiple Regression] [WS7-2] [2009-11-20 09:43:44] [30970b478e356ce7f8c2e9fca280b230] [Current]
Feedback Forum

Post a new message
Dataseries X:
10.9	96.8
10	114.1
9.2	110.3
9.2	103.9
9.5	101.6
9.6	94.6
9.5	95.9
9.1	104.7
8.9	102.8
9	98.1
10.1	113.9
10.3	80.9
10.2	95.7
9.6	113.2
9.2	105.9
9.3	108.8
9.4	102.3
9.4	99
9.2	100.7
9	115.5
9	100.7
9	109.9
9.8	114.6
10	85.4
9.8	100.5
9.3	114.8
9	116.5
9	112.9
9.1	102
9.1	106
9.1	105.3
9.2	118.8
8.8	106.1
8.3	109.3
8.4	117.2
8.1	92.5
7.7	104.2
7.9	112.5
7.9	122.4
8	113.3
7.9	100
7.6	110.7
7.1	112.8
6.8	109.8
6.5	117.3
6.9	109.1
8.2	115.9
8.7	96
8.3	99.8
7.9	116.8
7.5	115.7
7.8	99.4
8.3	94.3
8.4	91
8.2	93.2
7.7	103.1
7.2	94.1
7.3	91.8
8.1	102.7
8.5	82.6


Summary of computational transaction
Raw Inputview raw input (R code)
Raw Outputview raw output of R engine
Computing time3 seconds
R Server'Gwilym Jenkins' @ 72.249.127.135

\begin{tabular}{lllllllll}
\hline
Summary of computational transaction \tabularnewline
Raw Input & view raw input (R code)  \tabularnewline
Raw Output & view raw output of R engine  \tabularnewline
Computing time & 3 seconds \tabularnewline
R Server & 'Gwilym Jenkins' @ 72.249.127.135 \tabularnewline
\hline
\end{tabular}
%Source: https://freestatistics.org/blog/index.php?pk=57998&T=0

[TABLE]
[ROW][C]Summary of computational transaction[/C][/ROW]
[ROW][C]Raw Input[/C][C]view raw input (R code) [/C][/ROW]
[ROW][C]Raw Output[/C][C]view raw output of R engine [/C][/ROW]
[ROW][C]Computing time[/C][C]3 seconds[/C][/ROW]
[ROW][C]R Server[/C][C]'Gwilym Jenkins' @ 72.249.127.135[/C][/ROW]
[/TABLE]
Source: https://freestatistics.org/blog/index.php?pk=57998&T=0

Globally Unique Identifier (entire table): ba.freestatistics.org/blog/index.php?pk=57998&T=0

As an alternative you can also use a QR Code:  

The GUIDs for individual cells are displayed in the table below:

Summary of computational transaction
Raw Inputview raw input (R code)
Raw Outputview raw output of R engine
Computing time3 seconds
R Server'Gwilym Jenkins' @ 72.249.127.135


Multiple Linear Regression - Estimated Regression Equation
Y[t] = + 11.6689654284348 -0.0291376935120574X[t] + 0.607321306663722M1[t] + 0.600890186123138M2[t] + 0.217393662901691M3[t] + 0.127998655073318M4[t] + 0.0859694305114406M5[t] + 0.0723797230840934M6[t] -0.0891585214799912M7[t] -0.0927468185738858M8[t] -0.5528177644784M9[t] -0.549134872845152M10[t] + 0.539514661336017M11[t] + e[t]

\begin{tabular}{lllllllll}
\hline
Multiple Linear Regression - Estimated Regression Equation \tabularnewline
Y[t] =  +  11.6689654284348 -0.0291376935120574X[t] +  0.607321306663722M1[t] +  0.600890186123138M2[t] +  0.217393662901691M3[t] +  0.127998655073318M4[t] +  0.0859694305114406M5[t] +  0.0723797230840934M6[t] -0.0891585214799912M7[t] -0.0927468185738858M8[t] -0.5528177644784M9[t] -0.549134872845152M10[t] +  0.539514661336017M11[t]  + e[t] \tabularnewline
\hline
\end{tabular}
%Source: https://freestatistics.org/blog/index.php?pk=57998&T=1

[TABLE]
[ROW][C]Multiple Linear Regression - Estimated Regression Equation[/C][/ROW]
[ROW][C]Y[t] =  +  11.6689654284348 -0.0291376935120574X[t] +  0.607321306663722M1[t] +  0.600890186123138M2[t] +  0.217393662901691M3[t] +  0.127998655073318M4[t] +  0.0859694305114406M5[t] +  0.0723797230840934M6[t] -0.0891585214799912M7[t] -0.0927468185738858M8[t] -0.5528177644784M9[t] -0.549134872845152M10[t] +  0.539514661336017M11[t]  + e[t][/C][/ROW]
[/TABLE]
Source: https://freestatistics.org/blog/index.php?pk=57998&T=1

Globally Unique Identifier (entire table): ba.freestatistics.org/blog/index.php?pk=57998&T=1

As an alternative you can also use a QR Code:  

The GUIDs for individual cells are displayed in the table below:

Multiple Linear Regression - Estimated Regression Equation
Y[t] = + 11.6689654284348 -0.0291376935120574X[t] + 0.607321306663722M1[t] + 0.600890186123138M2[t] + 0.217393662901691M3[t] + 0.127998655073318M4[t] + 0.0859694305114406M5[t] + 0.0723797230840934M6[t] -0.0891585214799912M7[t] -0.0927468185738858M8[t] -0.5528177644784M9[t] -0.549134872845152M10[t] + 0.539514661336017M11[t] + e[t]


Multiple Linear Regression - Ordinary Least Squares
VariableParameterS.D.T-STATH0: parameter = 02-tail p-value1-tail p-value
(Intercept)11.66896542843481.9479375.990400
X-0.02913769351205740.021719-1.34160.1861750.093087
M10.6073213066637220.6605070.91950.3625410.181271
M20.6008901861231380.8414530.71410.4786910.239345
M30.2173936629016910.8396530.25890.7968360.398418
M40.1279986550733180.7492260.17080.8650820.432541
M50.08596943051144060.6660780.12910.8978550.448927
M60.07237972308409340.6680490.10830.9141830.457092
M7-0.08915852147999120.68046-0.1310.8963130.448157
M8-0.09274681857388580.785247-0.11810.9064830.453241
M9-0.55281776447840.707895-0.78090.4387590.219379
M10-0.5491348728451520.701734-0.78250.4378220.218911
M110.5395146613360170.8204220.65760.5139990.257

\begin{tabular}{lllllllll}
\hline
Multiple Linear Regression - Ordinary Least Squares \tabularnewline
Variable & Parameter & S.D. & T-STATH0: parameter = 0 & 2-tail p-value & 1-tail p-value \tabularnewline
(Intercept) & 11.6689654284348 & 1.947937 & 5.9904 & 0 & 0 \tabularnewline
X & -0.0291376935120574 & 0.021719 & -1.3416 & 0.186175 & 0.093087 \tabularnewline
M1 & 0.607321306663722 & 0.660507 & 0.9195 & 0.362541 & 0.181271 \tabularnewline
M2 & 0.600890186123138 & 0.841453 & 0.7141 & 0.478691 & 0.239345 \tabularnewline
M3 & 0.217393662901691 & 0.839653 & 0.2589 & 0.796836 & 0.398418 \tabularnewline
M4 & 0.127998655073318 & 0.749226 & 0.1708 & 0.865082 & 0.432541 \tabularnewline
M5 & 0.0859694305114406 & 0.666078 & 0.1291 & 0.897855 & 0.448927 \tabularnewline
M6 & 0.0723797230840934 & 0.668049 & 0.1083 & 0.914183 & 0.457092 \tabularnewline
M7 & -0.0891585214799912 & 0.68046 & -0.131 & 0.896313 & 0.448157 \tabularnewline
M8 & -0.0927468185738858 & 0.785247 & -0.1181 & 0.906483 & 0.453241 \tabularnewline
M9 & -0.5528177644784 & 0.707895 & -0.7809 & 0.438759 & 0.219379 \tabularnewline
M10 & -0.549134872845152 & 0.701734 & -0.7825 & 0.437822 & 0.218911 \tabularnewline
M11 & 0.539514661336017 & 0.820422 & 0.6576 & 0.513999 & 0.257 \tabularnewline
\hline
\end{tabular}
%Source: https://freestatistics.org/blog/index.php?pk=57998&T=2

[TABLE]
[ROW][C]Multiple Linear Regression - Ordinary Least Squares[/C][/ROW]
[ROW][C]Variable[/C][C]Parameter[/C][C]S.D.[/C][C]T-STATH0: parameter = 0[/C][C]2-tail p-value[/C][C]1-tail p-value[/C][/ROW]
[ROW][C](Intercept)[/C][C]11.6689654284348[/C][C]1.947937[/C][C]5.9904[/C][C]0[/C][C]0[/C][/ROW]
[ROW][C]X[/C][C]-0.0291376935120574[/C][C]0.021719[/C][C]-1.3416[/C][C]0.186175[/C][C]0.093087[/C][/ROW]
[ROW][C]M1[/C][C]0.607321306663722[/C][C]0.660507[/C][C]0.9195[/C][C]0.362541[/C][C]0.181271[/C][/ROW]
[ROW][C]M2[/C][C]0.600890186123138[/C][C]0.841453[/C][C]0.7141[/C][C]0.478691[/C][C]0.239345[/C][/ROW]
[ROW][C]M3[/C][C]0.217393662901691[/C][C]0.839653[/C][C]0.2589[/C][C]0.796836[/C][C]0.398418[/C][/ROW]
[ROW][C]M4[/C][C]0.127998655073318[/C][C]0.749226[/C][C]0.1708[/C][C]0.865082[/C][C]0.432541[/C][/ROW]
[ROW][C]M5[/C][C]0.0859694305114406[/C][C]0.666078[/C][C]0.1291[/C][C]0.897855[/C][C]0.448927[/C][/ROW]
[ROW][C]M6[/C][C]0.0723797230840934[/C][C]0.668049[/C][C]0.1083[/C][C]0.914183[/C][C]0.457092[/C][/ROW]
[ROW][C]M7[/C][C]-0.0891585214799912[/C][C]0.68046[/C][C]-0.131[/C][C]0.896313[/C][C]0.448157[/C][/ROW]
[ROW][C]M8[/C][C]-0.0927468185738858[/C][C]0.785247[/C][C]-0.1181[/C][C]0.906483[/C][C]0.453241[/C][/ROW]
[ROW][C]M9[/C][C]-0.5528177644784[/C][C]0.707895[/C][C]-0.7809[/C][C]0.438759[/C][C]0.219379[/C][/ROW]
[ROW][C]M10[/C][C]-0.549134872845152[/C][C]0.701734[/C][C]-0.7825[/C][C]0.437822[/C][C]0.218911[/C][/ROW]
[ROW][C]M11[/C][C]0.539514661336017[/C][C]0.820422[/C][C]0.6576[/C][C]0.513999[/C][C]0.257[/C][/ROW]
[/TABLE]
Source: https://freestatistics.org/blog/index.php?pk=57998&T=2

Globally Unique Identifier (entire table): ba.freestatistics.org/blog/index.php?pk=57998&T=2

As an alternative you can also use a QR Code:  

The GUIDs for individual cells are displayed in the table below:

Multiple Linear Regression - Ordinary Least Squares
VariableParameterS.D.T-STATH0: parameter = 02-tail p-value1-tail p-value
(Intercept)11.66896542843481.9479375.990400
X-0.02913769351205740.021719-1.34160.1861750.093087
M10.6073213066637220.6605070.91950.3625410.181271
M20.6008901861231380.8414530.71410.4786910.239345
M30.2173936629016910.8396530.25890.7968360.398418
M40.1279986550733180.7492260.17080.8650820.432541
M50.08596943051144060.6660780.12910.8978550.448927
M60.07237972308409340.6680490.10830.9141830.457092
M7-0.08915852147999120.68046-0.1310.8963130.448157
M8-0.09274681857388580.785247-0.11810.9064830.453241
M9-0.55281776447840.707895-0.78090.4387590.219379
M10-0.5491348728451520.701734-0.78250.4378220.218911
M110.5395146613360170.8204220.65760.5139990.257


Multiple Linear Regression - Regression Statistics
Multiple R0.432682466581798
R-squared0.187214116887309
Adjusted R-squared-0.0203056830563568
F-TEST (value)0.902150623401385
F-TEST (DF numerator)12
F-TEST (DF denominator)47
p-value0.551517837201219
Multiple Linear Regression - Residual Statistics
Residual Standard Deviation0.960789905971162
Sum Squared Residuals43.3865104405554

\begin{tabular}{lllllllll}
\hline
Multiple Linear Regression - Regression Statistics \tabularnewline
Multiple R & 0.432682466581798 \tabularnewline
R-squared & 0.187214116887309 \tabularnewline
Adjusted R-squared & -0.0203056830563568 \tabularnewline
F-TEST (value) & 0.902150623401385 \tabularnewline
F-TEST (DF numerator) & 12 \tabularnewline
F-TEST (DF denominator) & 47 \tabularnewline
p-value & 0.551517837201219 \tabularnewline
Multiple Linear Regression - Residual Statistics \tabularnewline
Residual Standard Deviation & 0.960789905971162 \tabularnewline
Sum Squared Residuals & 43.3865104405554 \tabularnewline
\hline
\end{tabular}
%Source: https://freestatistics.org/blog/index.php?pk=57998&T=3

[TABLE]
[ROW][C]Multiple Linear Regression - Regression Statistics[/C][/ROW]
[ROW][C]Multiple R[/C][C]0.432682466581798[/C][/ROW]
[ROW][C]R-squared[/C][C]0.187214116887309[/C][/ROW]
[ROW][C]Adjusted R-squared[/C][C]-0.0203056830563568[/C][/ROW]
[ROW][C]F-TEST (value)[/C][C]0.902150623401385[/C][/ROW]
[ROW][C]F-TEST (DF numerator)[/C][C]12[/C][/ROW]
[ROW][C]F-TEST (DF denominator)[/C][C]47[/C][/ROW]
[ROW][C]p-value[/C][C]0.551517837201219[/C][/ROW]
[ROW][C]Multiple Linear Regression - Residual Statistics[/C][/ROW]
[ROW][C]Residual Standard Deviation[/C][C]0.960789905971162[/C][/ROW]
[ROW][C]Sum Squared Residuals[/C][C]43.3865104405554[/C][/ROW]
[/TABLE]
Source: https://freestatistics.org/blog/index.php?pk=57998&T=3

Globally Unique Identifier (entire table): ba.freestatistics.org/blog/index.php?pk=57998&T=3

As an alternative you can also use a QR Code:  

The GUIDs for individual cells are displayed in the table below:

Multiple Linear Regression - Regression Statistics
Multiple R0.432682466581798
R-squared0.187214116887309
Adjusted R-squared-0.0203056830563568
F-TEST (value)0.902150623401385
F-TEST (DF numerator)12
F-TEST (DF denominator)47
p-value0.551517837201219
Multiple Linear Regression - Residual Statistics
Residual Standard Deviation0.960789905971162
Sum Squared Residuals43.3865104405554


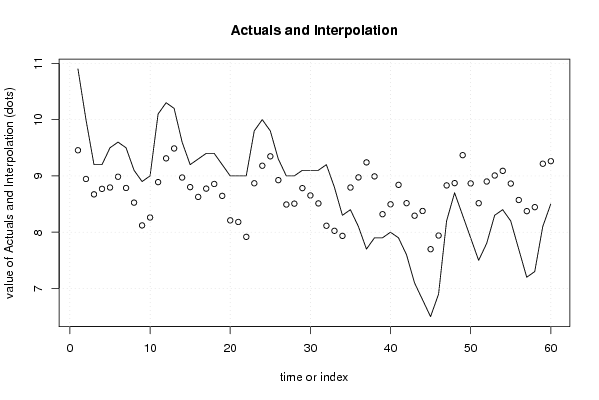
Multiple Linear Regression - Actuals, Interpolation, and Residuals
Time or IndexActualsInterpolationForecastResidualsPrediction Error
110.99.455758003131361.44424199686864
2108.945244784832171.05475521516783
39.28.672471496956540.527528503043458
49.28.769557727605330.430442272394663
59.58.794545198121190.70545480187881
69.68.984919345278240.615080654721755
79.58.785502099148480.714497900851515
89.18.525502099148490.574497900851514
98.98.120792770916880.77920722908312
1098.26142282205680.738577177943202
1110.18.889696798747461.21030320125254
1210.39.311726023309340.988273976690663
1310.29.487809465994610.712190534005389
149.68.971468708993020.628531291006978
159.28.80067734840960.399322651590406
169.38.626783029396250.673216970603746
179.48.774148812662750.62585118733725
189.48.85671349382520.543286506174808
199.28.645641170290610.554358829709389
2098.210815009218270.789184990781734
2198.18198192729220.818018072707799
2297.917598038614521.08240196138548
239.88.869300413289020.93069958671098
24109.180606402505080.81939359749492
259.89.347948537136740.452051462863265
269.38.924848399373730.37515160062627
2798.491817797181780.508182202818215
2898.507318485996820.492681514003181
299.18.782890120716370.317109879283632
309.18.652749639240790.447250360759209
319.18.511607780135150.588392219864854
329.28.114660620628481.08533937937152
338.88.024638382327090.775361617672909
348.37.935080654721760.364919345278245
358.48.79354241015767-0.39354241015767
368.18.97372877856947-0.873728778569473
377.79.24013907114212-1.54013907114212
387.98.99186509445146-1.09186509445146
397.98.31990540546065-0.419905405460646
4088.495663408592-0.495663408591996
417.98.84116550774048-0.941165507740482
427.68.51580247973412-0.915802479734121
437.18.29307507879472-1.19307507879472
446.88.376899862237-1.57689986223699
456.57.69829621499205-1.19829621499205
466.97.94090819342417-1.04090819342417
478.28.83142141172335-0.631421411723346
488.78.87174685127727-0.171746851277272
498.39.36834492259518-1.06834492259518
507.98.86657301234962-0.966573012349615
517.58.51512795199143-1.01512795199143
527.88.9006773484096-1.10067734840959
538.39.00725036075921-0.707250360759209
548.49.08981504192165-0.689815041921651
558.28.86417387163104-0.664173871631041
567.78.57212240876778-0.872122408767777
577.28.37429070447178-1.17429070447178
587.38.44499029118276-1.14499029118276
598.19.2160389660825-1.11603896608250
608.59.26219194433884-0.762191944338841

\begin{tabular}{lllllllll}
\hline
Multiple Linear Regression - Actuals, Interpolation, and Residuals \tabularnewline
Time or Index & Actuals & InterpolationForecast & ResidualsPrediction Error \tabularnewline
1 & 10.9 & 9.45575800313136 & 1.44424199686864 \tabularnewline
2 & 10 & 8.94524478483217 & 1.05475521516783 \tabularnewline
3 & 9.2 & 8.67247149695654 & 0.527528503043458 \tabularnewline
4 & 9.2 & 8.76955772760533 & 0.430442272394663 \tabularnewline
5 & 9.5 & 8.79454519812119 & 0.70545480187881 \tabularnewline
6 & 9.6 & 8.98491934527824 & 0.615080654721755 \tabularnewline
7 & 9.5 & 8.78550209914848 & 0.714497900851515 \tabularnewline
8 & 9.1 & 8.52550209914849 & 0.574497900851514 \tabularnewline
9 & 8.9 & 8.12079277091688 & 0.77920722908312 \tabularnewline
10 & 9 & 8.2614228220568 & 0.738577177943202 \tabularnewline
11 & 10.1 & 8.88969679874746 & 1.21030320125254 \tabularnewline
12 & 10.3 & 9.31172602330934 & 0.988273976690663 \tabularnewline
13 & 10.2 & 9.48780946599461 & 0.712190534005389 \tabularnewline
14 & 9.6 & 8.97146870899302 & 0.628531291006978 \tabularnewline
15 & 9.2 & 8.8006773484096 & 0.399322651590406 \tabularnewline
16 & 9.3 & 8.62678302939625 & 0.673216970603746 \tabularnewline
17 & 9.4 & 8.77414881266275 & 0.62585118733725 \tabularnewline
18 & 9.4 & 8.8567134938252 & 0.543286506174808 \tabularnewline
19 & 9.2 & 8.64564117029061 & 0.554358829709389 \tabularnewline
20 & 9 & 8.21081500921827 & 0.789184990781734 \tabularnewline
21 & 9 & 8.1819819272922 & 0.818018072707799 \tabularnewline
22 & 9 & 7.91759803861452 & 1.08240196138548 \tabularnewline
23 & 9.8 & 8.86930041328902 & 0.93069958671098 \tabularnewline
24 & 10 & 9.18060640250508 & 0.81939359749492 \tabularnewline
25 & 9.8 & 9.34794853713674 & 0.452051462863265 \tabularnewline
26 & 9.3 & 8.92484839937373 & 0.37515160062627 \tabularnewline
27 & 9 & 8.49181779718178 & 0.508182202818215 \tabularnewline
28 & 9 & 8.50731848599682 & 0.492681514003181 \tabularnewline
29 & 9.1 & 8.78289012071637 & 0.317109879283632 \tabularnewline
30 & 9.1 & 8.65274963924079 & 0.447250360759209 \tabularnewline
31 & 9.1 & 8.51160778013515 & 0.588392219864854 \tabularnewline
32 & 9.2 & 8.11466062062848 & 1.08533937937152 \tabularnewline
33 & 8.8 & 8.02463838232709 & 0.775361617672909 \tabularnewline
34 & 8.3 & 7.93508065472176 & 0.364919345278245 \tabularnewline
35 & 8.4 & 8.79354241015767 & -0.39354241015767 \tabularnewline
36 & 8.1 & 8.97372877856947 & -0.873728778569473 \tabularnewline
37 & 7.7 & 9.24013907114212 & -1.54013907114212 \tabularnewline
38 & 7.9 & 8.99186509445146 & -1.09186509445146 \tabularnewline
39 & 7.9 & 8.31990540546065 & -0.419905405460646 \tabularnewline
40 & 8 & 8.495663408592 & -0.495663408591996 \tabularnewline
41 & 7.9 & 8.84116550774048 & -0.941165507740482 \tabularnewline
42 & 7.6 & 8.51580247973412 & -0.915802479734121 \tabularnewline
43 & 7.1 & 8.29307507879472 & -1.19307507879472 \tabularnewline
44 & 6.8 & 8.376899862237 & -1.57689986223699 \tabularnewline
45 & 6.5 & 7.69829621499205 & -1.19829621499205 \tabularnewline
46 & 6.9 & 7.94090819342417 & -1.04090819342417 \tabularnewline
47 & 8.2 & 8.83142141172335 & -0.631421411723346 \tabularnewline
48 & 8.7 & 8.87174685127727 & -0.171746851277272 \tabularnewline
49 & 8.3 & 9.36834492259518 & -1.06834492259518 \tabularnewline
50 & 7.9 & 8.86657301234962 & -0.966573012349615 \tabularnewline
51 & 7.5 & 8.51512795199143 & -1.01512795199143 \tabularnewline
52 & 7.8 & 8.9006773484096 & -1.10067734840959 \tabularnewline
53 & 8.3 & 9.00725036075921 & -0.707250360759209 \tabularnewline
54 & 8.4 & 9.08981504192165 & -0.689815041921651 \tabularnewline
55 & 8.2 & 8.86417387163104 & -0.664173871631041 \tabularnewline
56 & 7.7 & 8.57212240876778 & -0.872122408767777 \tabularnewline
57 & 7.2 & 8.37429070447178 & -1.17429070447178 \tabularnewline
58 & 7.3 & 8.44499029118276 & -1.14499029118276 \tabularnewline
59 & 8.1 & 9.2160389660825 & -1.11603896608250 \tabularnewline
60 & 8.5 & 9.26219194433884 & -0.762191944338841 \tabularnewline
\hline
\end{tabular}
%Source: https://freestatistics.org/blog/index.php?pk=57998&T=4

[TABLE]
[ROW][C]Multiple Linear Regression - Actuals, Interpolation, and Residuals[/C][/ROW]
[ROW][C]Time or Index[/C][C]Actuals[/C][C]InterpolationForecast[/C][C]ResidualsPrediction Error[/C][/ROW]
[ROW][C]1[/C][C]10.9[/C][C]9.45575800313136[/C][C]1.44424199686864[/C][/ROW]
[ROW][C]2[/C][C]10[/C][C]8.94524478483217[/C][C]1.05475521516783[/C][/ROW]
[ROW][C]3[/C][C]9.2[/C][C]8.67247149695654[/C][C]0.527528503043458[/C][/ROW]
[ROW][C]4[/C][C]9.2[/C][C]8.76955772760533[/C][C]0.430442272394663[/C][/ROW]
[ROW][C]5[/C][C]9.5[/C][C]8.79454519812119[/C][C]0.70545480187881[/C][/ROW]
[ROW][C]6[/C][C]9.6[/C][C]8.98491934527824[/C][C]0.615080654721755[/C][/ROW]
[ROW][C]7[/C][C]9.5[/C][C]8.78550209914848[/C][C]0.714497900851515[/C][/ROW]
[ROW][C]8[/C][C]9.1[/C][C]8.52550209914849[/C][C]0.574497900851514[/C][/ROW]
[ROW][C]9[/C][C]8.9[/C][C]8.12079277091688[/C][C]0.77920722908312[/C][/ROW]
[ROW][C]10[/C][C]9[/C][C]8.2614228220568[/C][C]0.738577177943202[/C][/ROW]
[ROW][C]11[/C][C]10.1[/C][C]8.88969679874746[/C][C]1.21030320125254[/C][/ROW]
[ROW][C]12[/C][C]10.3[/C][C]9.31172602330934[/C][C]0.988273976690663[/C][/ROW]
[ROW][C]13[/C][C]10.2[/C][C]9.48780946599461[/C][C]0.712190534005389[/C][/ROW]
[ROW][C]14[/C][C]9.6[/C][C]8.97146870899302[/C][C]0.628531291006978[/C][/ROW]
[ROW][C]15[/C][C]9.2[/C][C]8.8006773484096[/C][C]0.399322651590406[/C][/ROW]
[ROW][C]16[/C][C]9.3[/C][C]8.62678302939625[/C][C]0.673216970603746[/C][/ROW]
[ROW][C]17[/C][C]9.4[/C][C]8.77414881266275[/C][C]0.62585118733725[/C][/ROW]
[ROW][C]18[/C][C]9.4[/C][C]8.8567134938252[/C][C]0.543286506174808[/C][/ROW]
[ROW][C]19[/C][C]9.2[/C][C]8.64564117029061[/C][C]0.554358829709389[/C][/ROW]
[ROW][C]20[/C][C]9[/C][C]8.21081500921827[/C][C]0.789184990781734[/C][/ROW]
[ROW][C]21[/C][C]9[/C][C]8.1819819272922[/C][C]0.818018072707799[/C][/ROW]
[ROW][C]22[/C][C]9[/C][C]7.91759803861452[/C][C]1.08240196138548[/C][/ROW]
[ROW][C]23[/C][C]9.8[/C][C]8.86930041328902[/C][C]0.93069958671098[/C][/ROW]
[ROW][C]24[/C][C]10[/C][C]9.18060640250508[/C][C]0.81939359749492[/C][/ROW]
[ROW][C]25[/C][C]9.8[/C][C]9.34794853713674[/C][C]0.452051462863265[/C][/ROW]
[ROW][C]26[/C][C]9.3[/C][C]8.92484839937373[/C][C]0.37515160062627[/C][/ROW]
[ROW][C]27[/C][C]9[/C][C]8.49181779718178[/C][C]0.508182202818215[/C][/ROW]
[ROW][C]28[/C][C]9[/C][C]8.50731848599682[/C][C]0.492681514003181[/C][/ROW]
[ROW][C]29[/C][C]9.1[/C][C]8.78289012071637[/C][C]0.317109879283632[/C][/ROW]
[ROW][C]30[/C][C]9.1[/C][C]8.65274963924079[/C][C]0.447250360759209[/C][/ROW]
[ROW][C]31[/C][C]9.1[/C][C]8.51160778013515[/C][C]0.588392219864854[/C][/ROW]
[ROW][C]32[/C][C]9.2[/C][C]8.11466062062848[/C][C]1.08533937937152[/C][/ROW]
[ROW][C]33[/C][C]8.8[/C][C]8.02463838232709[/C][C]0.775361617672909[/C][/ROW]
[ROW][C]34[/C][C]8.3[/C][C]7.93508065472176[/C][C]0.364919345278245[/C][/ROW]
[ROW][C]35[/C][C]8.4[/C][C]8.79354241015767[/C][C]-0.39354241015767[/C][/ROW]
[ROW][C]36[/C][C]8.1[/C][C]8.97372877856947[/C][C]-0.873728778569473[/C][/ROW]
[ROW][C]37[/C][C]7.7[/C][C]9.24013907114212[/C][C]-1.54013907114212[/C][/ROW]
[ROW][C]38[/C][C]7.9[/C][C]8.99186509445146[/C][C]-1.09186509445146[/C][/ROW]
[ROW][C]39[/C][C]7.9[/C][C]8.31990540546065[/C][C]-0.419905405460646[/C][/ROW]
[ROW][C]40[/C][C]8[/C][C]8.495663408592[/C][C]-0.495663408591996[/C][/ROW]
[ROW][C]41[/C][C]7.9[/C][C]8.84116550774048[/C][C]-0.941165507740482[/C][/ROW]
[ROW][C]42[/C][C]7.6[/C][C]8.51580247973412[/C][C]-0.915802479734121[/C][/ROW]
[ROW][C]43[/C][C]7.1[/C][C]8.29307507879472[/C][C]-1.19307507879472[/C][/ROW]
[ROW][C]44[/C][C]6.8[/C][C]8.376899862237[/C][C]-1.57689986223699[/C][/ROW]
[ROW][C]45[/C][C]6.5[/C][C]7.69829621499205[/C][C]-1.19829621499205[/C][/ROW]
[ROW][C]46[/C][C]6.9[/C][C]7.94090819342417[/C][C]-1.04090819342417[/C][/ROW]
[ROW][C]47[/C][C]8.2[/C][C]8.83142141172335[/C][C]-0.631421411723346[/C][/ROW]
[ROW][C]48[/C][C]8.7[/C][C]8.87174685127727[/C][C]-0.171746851277272[/C][/ROW]
[ROW][C]49[/C][C]8.3[/C][C]9.36834492259518[/C][C]-1.06834492259518[/C][/ROW]
[ROW][C]50[/C][C]7.9[/C][C]8.86657301234962[/C][C]-0.966573012349615[/C][/ROW]
[ROW][C]51[/C][C]7.5[/C][C]8.51512795199143[/C][C]-1.01512795199143[/C][/ROW]
[ROW][C]52[/C][C]7.8[/C][C]8.9006773484096[/C][C]-1.10067734840959[/C][/ROW]
[ROW][C]53[/C][C]8.3[/C][C]9.00725036075921[/C][C]-0.707250360759209[/C][/ROW]
[ROW][C]54[/C][C]8.4[/C][C]9.08981504192165[/C][C]-0.689815041921651[/C][/ROW]
[ROW][C]55[/C][C]8.2[/C][C]8.86417387163104[/C][C]-0.664173871631041[/C][/ROW]
[ROW][C]56[/C][C]7.7[/C][C]8.57212240876778[/C][C]-0.872122408767777[/C][/ROW]
[ROW][C]57[/C][C]7.2[/C][C]8.37429070447178[/C][C]-1.17429070447178[/C][/ROW]
[ROW][C]58[/C][C]7.3[/C][C]8.44499029118276[/C][C]-1.14499029118276[/C][/ROW]
[ROW][C]59[/C][C]8.1[/C][C]9.2160389660825[/C][C]-1.11603896608250[/C][/ROW]
[ROW][C]60[/C][C]8.5[/C][C]9.26219194433884[/C][C]-0.762191944338841[/C][/ROW]
[/TABLE]
Source: https://freestatistics.org/blog/index.php?pk=57998&T=4

Globally Unique Identifier (entire table): ba.freestatistics.org/blog/index.php?pk=57998&T=4

As an alternative you can also use a QR Code:  

The GUIDs for individual cells are displayed in the table below:

Multiple Linear Regression - Actuals, Interpolation, and Residuals
Time or IndexActualsInterpolationForecastResidualsPrediction Error
110.99.455758003131361.44424199686864
2108.945244784832171.05475521516783
39.28.672471496956540.527528503043458
49.28.769557727605330.430442272394663
59.58.794545198121190.70545480187881
69.68.984919345278240.615080654721755
79.58.785502099148480.714497900851515
89.18.525502099148490.574497900851514
98.98.120792770916880.77920722908312
1098.26142282205680.738577177943202
1110.18.889696798747461.21030320125254
1210.39.311726023309340.988273976690663
1310.29.487809465994610.712190534005389
149.68.971468708993020.628531291006978
159.28.80067734840960.399322651590406
169.38.626783029396250.673216970603746
179.48.774148812662750.62585118733725
189.48.85671349382520.543286506174808
199.28.645641170290610.554358829709389
2098.210815009218270.789184990781734
2198.18198192729220.818018072707799
2297.917598038614521.08240196138548
239.88.869300413289020.93069958671098
24109.180606402505080.81939359749492
259.89.347948537136740.452051462863265
269.38.924848399373730.37515160062627
2798.491817797181780.508182202818215
2898.507318485996820.492681514003181
299.18.782890120716370.317109879283632
309.18.652749639240790.447250360759209
319.18.511607780135150.588392219864854
329.28.114660620628481.08533937937152
338.88.024638382327090.775361617672909
348.37.935080654721760.364919345278245
358.48.79354241015767-0.39354241015767
368.18.97372877856947-0.873728778569473
377.79.24013907114212-1.54013907114212
387.98.99186509445146-1.09186509445146
397.98.31990540546065-0.419905405460646
4088.495663408592-0.495663408591996
417.98.84116550774048-0.941165507740482
427.68.51580247973412-0.915802479734121
437.18.29307507879472-1.19307507879472
446.88.376899862237-1.57689986223699
456.57.69829621499205-1.19829621499205
466.97.94090819342417-1.04090819342417
478.28.83142141172335-0.631421411723346
488.78.87174685127727-0.171746851277272
498.39.36834492259518-1.06834492259518
507.98.86657301234962-0.966573012349615
517.58.51512795199143-1.01512795199143
527.88.9006773484096-1.10067734840959
538.39.00725036075921-0.707250360759209
548.49.08981504192165-0.689815041921651
558.28.86417387163104-0.664173871631041
567.78.57212240876778-0.872122408767777
577.28.37429070447178-1.17429070447178
587.38.44499029118276-1.14499029118276
598.19.2160389660825-1.11603896608250
608.59.26219194433884-0.762191944338841


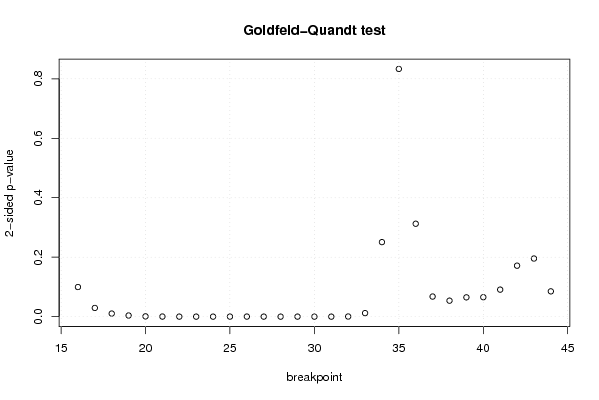
Goldfeld-Quandt test for Heteroskedasticity
p-valuesAlternative Hypothesis
breakpoint indexgreater2-sidedless
160.04983024964256070.09966049928512130.95016975035744
170.01464180573541390.02928361147082770.985358194264586
180.005223028639548320.01044605727909660.994776971360452
190.001939670313611460.003879340627222910.998060329686389
200.0005191759178243840.001038351835648770.999480824082176
210.0001587658153716080.0003175316307432170.999841234184628
224.98165637385357e-059.96331274770715e-050.999950183436261
232.65793975185048e-055.31587950370097e-050.999973420602482
241.45243702952421e-052.90487405904843e-050.999985475629705
250.0001058118261055290.0002116236522110590.999894188173895
260.0001380511862806160.0002761023725612320.99986194881372
277.36906955640018e-050.0001473813911280040.999926309304436
283.59986462488199e-057.19972924976397e-050.999964001353751
292.81432395056632e-055.62864790113264e-050.999971856760494
301.71129168146047e-053.42258336292093e-050.999982887083185
311.68471852572519e-053.36943705145037e-050.999983152814743
320.0002318622396571640.0004637244793143280.999768137760343
330.005987369390971360.01197473878194270.994012630609029
340.1253684257070980.2507368514141960.874631574292902
350.5834631845856170.8330736308287650.416536815414383
360.8437608626619570.3124782746760860.156239137338043
370.9662025925772840.06759481484543240.0337974074227162
380.9731224436854080.05375511262918460.0268775563145923
390.9675237043208570.06495259135828680.0324762956791434
400.9672731993928770.06545360121424630.0327268006071232
410.9545405490663030.09091890186739430.0454594509336971
420.9142840365420320.1714319269159350.0857159634579677
430.9022732084600380.1954535830799230.0977267915399617
440.9574172115268020.08516557694639620.0425827884731981

\begin{tabular}{lllllllll}
\hline
Goldfeld-Quandt test for Heteroskedasticity \tabularnewline
p-values & Alternative Hypothesis \tabularnewline
breakpoint index & greater & 2-sided & less \tabularnewline
16 & 0.0498302496425607 & 0.0996604992851213 & 0.95016975035744 \tabularnewline
17 & 0.0146418057354139 & 0.0292836114708277 & 0.985358194264586 \tabularnewline
18 & 0.00522302863954832 & 0.0104460572790966 & 0.994776971360452 \tabularnewline
19 & 0.00193967031361146 & 0.00387934062722291 & 0.998060329686389 \tabularnewline
20 & 0.000519175917824384 & 0.00103835183564877 & 0.999480824082176 \tabularnewline
21 & 0.000158765815371608 & 0.000317531630743217 & 0.999841234184628 \tabularnewline
22 & 4.98165637385357e-05 & 9.96331274770715e-05 & 0.999950183436261 \tabularnewline
23 & 2.65793975185048e-05 & 5.31587950370097e-05 & 0.999973420602482 \tabularnewline
24 & 1.45243702952421e-05 & 2.90487405904843e-05 & 0.999985475629705 \tabularnewline
25 & 0.000105811826105529 & 0.000211623652211059 & 0.999894188173895 \tabularnewline
26 & 0.000138051186280616 & 0.000276102372561232 & 0.99986194881372 \tabularnewline
27 & 7.36906955640018e-05 & 0.000147381391128004 & 0.999926309304436 \tabularnewline
28 & 3.59986462488199e-05 & 7.19972924976397e-05 & 0.999964001353751 \tabularnewline
29 & 2.81432395056632e-05 & 5.62864790113264e-05 & 0.999971856760494 \tabularnewline
30 & 1.71129168146047e-05 & 3.42258336292093e-05 & 0.999982887083185 \tabularnewline
31 & 1.68471852572519e-05 & 3.36943705145037e-05 & 0.999983152814743 \tabularnewline
32 & 0.000231862239657164 & 0.000463724479314328 & 0.999768137760343 \tabularnewline
33 & 0.00598736939097136 & 0.0119747387819427 & 0.994012630609029 \tabularnewline
34 & 0.125368425707098 & 0.250736851414196 & 0.874631574292902 \tabularnewline
35 & 0.583463184585617 & 0.833073630828765 & 0.416536815414383 \tabularnewline
36 & 0.843760862661957 & 0.312478274676086 & 0.156239137338043 \tabularnewline
37 & 0.966202592577284 & 0.0675948148454324 & 0.0337974074227162 \tabularnewline
38 & 0.973122443685408 & 0.0537551126291846 & 0.0268775563145923 \tabularnewline
39 & 0.967523704320857 & 0.0649525913582868 & 0.0324762956791434 \tabularnewline
40 & 0.967273199392877 & 0.0654536012142463 & 0.0327268006071232 \tabularnewline
41 & 0.954540549066303 & 0.0909189018673943 & 0.0454594509336971 \tabularnewline
42 & 0.914284036542032 & 0.171431926915935 & 0.0857159634579677 \tabularnewline
43 & 0.902273208460038 & 0.195453583079923 & 0.0977267915399617 \tabularnewline
44 & 0.957417211526802 & 0.0851655769463962 & 0.0425827884731981 \tabularnewline
\hline
\end{tabular}
%Source: https://freestatistics.org/blog/index.php?pk=57998&T=5

[TABLE]
[ROW][C]Goldfeld-Quandt test for Heteroskedasticity[/C][/ROW]
[ROW][C]p-values[/C][C]Alternative Hypothesis[/C][/ROW]
[ROW][C]breakpoint index[/C][C]greater[/C][C]2-sided[/C][C]less[/C][/ROW]
[ROW][C]16[/C][C]0.0498302496425607[/C][C]0.0996604992851213[/C][C]0.95016975035744[/C][/ROW]
[ROW][C]17[/C][C]0.0146418057354139[/C][C]0.0292836114708277[/C][C]0.985358194264586[/C][/ROW]
[ROW][C]18[/C][C]0.00522302863954832[/C][C]0.0104460572790966[/C][C]0.994776971360452[/C][/ROW]
[ROW][C]19[/C][C]0.00193967031361146[/C][C]0.00387934062722291[/C][C]0.998060329686389[/C][/ROW]
[ROW][C]20[/C][C]0.000519175917824384[/C][C]0.00103835183564877[/C][C]0.999480824082176[/C][/ROW]
[ROW][C]21[/C][C]0.000158765815371608[/C][C]0.000317531630743217[/C][C]0.999841234184628[/C][/ROW]
[ROW][C]22[/C][C]4.98165637385357e-05[/C][C]9.96331274770715e-05[/C][C]0.999950183436261[/C][/ROW]
[ROW][C]23[/C][C]2.65793975185048e-05[/C][C]5.31587950370097e-05[/C][C]0.999973420602482[/C][/ROW]
[ROW][C]24[/C][C]1.45243702952421e-05[/C][C]2.90487405904843e-05[/C][C]0.999985475629705[/C][/ROW]
[ROW][C]25[/C][C]0.000105811826105529[/C][C]0.000211623652211059[/C][C]0.999894188173895[/C][/ROW]
[ROW][C]26[/C][C]0.000138051186280616[/C][C]0.000276102372561232[/C][C]0.99986194881372[/C][/ROW]
[ROW][C]27[/C][C]7.36906955640018e-05[/C][C]0.000147381391128004[/C][C]0.999926309304436[/C][/ROW]
[ROW][C]28[/C][C]3.59986462488199e-05[/C][C]7.19972924976397e-05[/C][C]0.999964001353751[/C][/ROW]
[ROW][C]29[/C][C]2.81432395056632e-05[/C][C]5.62864790113264e-05[/C][C]0.999971856760494[/C][/ROW]
[ROW][C]30[/C][C]1.71129168146047e-05[/C][C]3.42258336292093e-05[/C][C]0.999982887083185[/C][/ROW]
[ROW][C]31[/C][C]1.68471852572519e-05[/C][C]3.36943705145037e-05[/C][C]0.999983152814743[/C][/ROW]
[ROW][C]32[/C][C]0.000231862239657164[/C][C]0.000463724479314328[/C][C]0.999768137760343[/C][/ROW]
[ROW][C]33[/C][C]0.00598736939097136[/C][C]0.0119747387819427[/C][C]0.994012630609029[/C][/ROW]
[ROW][C]34[/C][C]0.125368425707098[/C][C]0.250736851414196[/C][C]0.874631574292902[/C][/ROW]
[ROW][C]35[/C][C]0.583463184585617[/C][C]0.833073630828765[/C][C]0.416536815414383[/C][/ROW]
[ROW][C]36[/C][C]0.843760862661957[/C][C]0.312478274676086[/C][C]0.156239137338043[/C][/ROW]
[ROW][C]37[/C][C]0.966202592577284[/C][C]0.0675948148454324[/C][C]0.0337974074227162[/C][/ROW]
[ROW][C]38[/C][C]0.973122443685408[/C][C]0.0537551126291846[/C][C]0.0268775563145923[/C][/ROW]
[ROW][C]39[/C][C]0.967523704320857[/C][C]0.0649525913582868[/C][C]0.0324762956791434[/C][/ROW]
[ROW][C]40[/C][C]0.967273199392877[/C][C]0.0654536012142463[/C][C]0.0327268006071232[/C][/ROW]
[ROW][C]41[/C][C]0.954540549066303[/C][C]0.0909189018673943[/C][C]0.0454594509336971[/C][/ROW]
[ROW][C]42[/C][C]0.914284036542032[/C][C]0.171431926915935[/C][C]0.0857159634579677[/C][/ROW]
[ROW][C]43[/C][C]0.902273208460038[/C][C]0.195453583079923[/C][C]0.0977267915399617[/C][/ROW]
[ROW][C]44[/C][C]0.957417211526802[/C][C]0.0851655769463962[/C][C]0.0425827884731981[/C][/ROW]
[/TABLE]
Source: https://freestatistics.org/blog/index.php?pk=57998&T=5

Globally Unique Identifier (entire table): ba.freestatistics.org/blog/index.php?pk=57998&T=5

As an alternative you can also use a QR Code:  

The GUIDs for individual cells are displayed in the table below:

Goldfeld-Quandt test for Heteroskedasticity
p-valuesAlternative Hypothesis
breakpoint indexgreater2-sidedless
160.04983024964256070.09966049928512130.95016975035744
170.01464180573541390.02928361147082770.985358194264586
180.005223028639548320.01044605727909660.994776971360452
190.001939670313611460.003879340627222910.998060329686389
200.0005191759178243840.001038351835648770.999480824082176
210.0001587658153716080.0003175316307432170.999841234184628
224.98165637385357e-059.96331274770715e-050.999950183436261
232.65793975185048e-055.31587950370097e-050.999973420602482
241.45243702952421e-052.90487405904843e-050.999985475629705
250.0001058118261055290.0002116236522110590.999894188173895
260.0001380511862806160.0002761023725612320.99986194881372
277.36906955640018e-050.0001473813911280040.999926309304436
283.59986462488199e-057.19972924976397e-050.999964001353751
292.81432395056632e-055.62864790113264e-050.999971856760494
301.71129168146047e-053.42258336292093e-050.999982887083185
311.68471852572519e-053.36943705145037e-050.999983152814743
320.0002318622396571640.0004637244793143280.999768137760343
330.005987369390971360.01197473878194270.994012630609029
340.1253684257070980.2507368514141960.874631574292902
350.5834631845856170.8330736308287650.416536815414383
360.8437608626619570.3124782746760860.156239137338043
370.9662025925772840.06759481484543240.0337974074227162
380.9731224436854080.05375511262918460.0268775563145923
390.9675237043208570.06495259135828680.0324762956791434
400.9672731993928770.06545360121424630.0327268006071232
410.9545405490663030.09091890186739430.0454594509336971
420.9142840365420320.1714319269159350.0857159634579677
430.9022732084600380.1954535830799230.0977267915399617
440.9574172115268020.08516557694639620.0425827884731981


Meta Analysis of Goldfeld-Quandt test for Heteroskedasticity
Description# significant tests% significant testsOK/NOK
1% type I error level140.482758620689655NOK
5% type I error level170.586206896551724NOK
10% type I error level240.827586206896552NOK

\begin{tabular}{lllllllll}
\hline
Meta Analysis of Goldfeld-Quandt test for Heteroskedasticity \tabularnewline
Description & # significant tests & % significant tests & OK/NOK \tabularnewline
1% type I error level & 14 & 0.482758620689655 & NOK \tabularnewline
5% type I error level & 17 & 0.586206896551724 & NOK \tabularnewline
10% type I error level & 24 & 0.827586206896552 & NOK \tabularnewline
\hline
\end{tabular}
%Source: https://freestatistics.org/blog/index.php?pk=57998&T=6

[TABLE]
[ROW][C]Meta Analysis of Goldfeld-Quandt test for Heteroskedasticity[/C][/ROW]
[ROW][C]Description[/C][C]# significant tests[/C][C]% significant tests[/C][C]OK/NOK[/C][/ROW]
[ROW][C]1% type I error level[/C][C]14[/C][C]0.482758620689655[/C][C]NOK[/C][/ROW]
[ROW][C]5% type I error level[/C][C]17[/C][C]0.586206896551724[/C][C]NOK[/C][/ROW]
[ROW][C]10% type I error level[/C][C]24[/C][C]0.827586206896552[/C][C]NOK[/C][/ROW]
[/TABLE]
Source: https://freestatistics.org/blog/index.php?pk=57998&T=6

Globally Unique Identifier (entire table): ba.freestatistics.org/blog/index.php?pk=57998&T=6

As an alternative you can also use a QR Code:  

The GUIDs for individual cells are displayed in the table below:

Meta Analysis of Goldfeld-Quandt test for Heteroskedasticity
Description# significant tests% significant testsOK/NOK
1% type I error level140.482758620689655NOK
5% type I error level170.586206896551724NOK
10% type I error level240.827586206896552NOK


Parameters (Session):
par1 = 1 ; par2 = Include Monthly Dummies ; par3 = No Linear Trend ;
Parameters (R input):
par1 = 1 ; par2 = Include Monthly Dummies ; par3 = No Linear Trend ;
R code (references can be found in the software module):
library(lattice)
library(lmtest)
n25 <- 25 #minimum number of obs. for Goldfeld-Quandt test
par1 <- as.numeric(par1)
x <- t(y)
k <- length(x[1,])
n <- length(x[,1])
x1 <- cbind(x[,par1], x[,1:k!=par1])
mycolnames <- c(colnames(x)[par1], colnames(x)[1:k!=par1])
colnames(x1) <- mycolnames #colnames(x)[par1]
x <- x1
if (par3 == 'First Differences'){
x2 <- array(0, dim=c(n-1,k), dimnames=list(1:(n-1), paste('(1-B)',colnames(x),sep='')))
for (i in 1:n-1) {
for (j in 1:k) {
x2[i,j] <- x[i+1,j] - x[i,j]
}
}
x <- x2
}
if (par2 == 'Include Monthly Dummies'){
x2 <- array(0, dim=c(n,11), dimnames=list(1:n, paste('M', seq(1:11), sep ='')))
for (i in 1:11){
x2[seq(i,n,12),i] <- 1
}
x <- cbind(x, x2)
}
if (par2 == 'Include Quarterly Dummies'){
x2 <- array(0, dim=c(n,3), dimnames=list(1:n, paste('Q', seq(1:3), sep ='')))
for (i in 1:3){
x2[seq(i,n,4),i] <- 1
}
x <- cbind(x, x2)
}
k <- length(x[1,])
if (par3 == 'Linear Trend'){
x <- cbind(x, c(1:n))
colnames(x)[k+1] <- 't'
}
x
k <- length(x[1,])
df <- as.data.frame(x)
(mylm <- lm(df))
(mysum <- summary(mylm))
if (n > n25) {
kp3 <- k + 3
nmkm3 <- n - k - 3
gqarr <- array(NA, dim=c(nmkm3-kp3+1,3))
numgqtests <- 0
numsignificant1 <- 0
numsignificant5 <- 0
numsignificant10 <- 0
for (mypoint in kp3:nmkm3) {
j <- 0
numgqtests <- numgqtests + 1
for (myalt in c('greater', 'two.sided', 'less')) {
j <- j + 1
gqarr[mypoint-kp3+1,j] <- gqtest(mylm, point=mypoint, alternative=myalt)$p.value
}
if (gqarr[mypoint-kp3+1,2] < 0.01) numsignificant1 <- numsignificant1 + 1
if (gqarr[mypoint-kp3+1,2] < 0.05) numsignificant5 <- numsignificant5 + 1
if (gqarr[mypoint-kp3+1,2] < 0.10) numsignificant10 <- numsignificant10 + 1
}
gqarr
}
bitmap(file='test0.png')
plot(x[,1], type='l', main='Actuals and Interpolation', ylab='value of Actuals and Interpolation (dots)', xlab='time or index')
points(x[,1]-mysum$resid)
grid()
dev.off()
bitmap(file='test1.png')
plot(mysum$resid, type='b', pch=19, main='Residuals', ylab='value of Residuals', xlab='time or index')
grid()
dev.off()
bitmap(file='test2.png')
hist(mysum$resid, main='Residual Histogram', xlab='values of Residuals')
grid()
dev.off()
bitmap(file='test3.png')
densityplot(~mysum$resid,col='black',main='Residual Density Plot', xlab='values of Residuals')
dev.off()
bitmap(file='test4.png')
qqnorm(mysum$resid, main='Residual Normal Q-Q Plot')
qqline(mysum$resid)
grid()
dev.off()
(myerror <- as.ts(mysum$resid))
bitmap(file='test5.png')
dum <- cbind(lag(myerror,k=1),myerror)
dum
dum1 <- dum[2:length(myerror),]
dum1
z <- as.data.frame(dum1)
z
plot(z,main=paste('Residual Lag plot, lowess, and regression line'), ylab='values of Residuals', xlab='lagged values of Residuals')
lines(lowess(z))
abline(lm(z))
grid()
dev.off()
bitmap(file='test6.png')
acf(mysum$resid, lag.max=length(mysum$resid)/2, main='Residual Autocorrelation Function')
grid()
dev.off()
bitmap(file='test7.png')
pacf(mysum$resid, lag.max=length(mysum$resid)/2, main='Residual Partial Autocorrelation Function')
grid()
dev.off()
bitmap(file='test8.png')
opar <- par(mfrow = c(2,2), oma = c(0, 0, 1.1, 0))
plot(mylm, las = 1, sub='Residual Diagnostics')
par(opar)
dev.off()
if (n > n25) {
bitmap(file='test9.png')
plot(kp3:nmkm3,gqarr[,2], main='Goldfeld-Quandt test',ylab='2-sided p-value',xlab='breakpoint')
grid()
dev.off()
}
load(file='createtable')
a<-table.start()
a<-table.row.start(a)
a<-table.element(a, 'Multiple Linear Regression - Estimated Regression Equation', 1, TRUE)
a<-table.row.end(a)
myeq <- colnames(x)[1]
myeq <- paste(myeq, '[t] = ', sep='')
for (i in 1:k){
if (mysum$coefficients[i,1] > 0) myeq <- paste(myeq, '+', '')
myeq <- paste(myeq, mysum$coefficients[i,1], sep=' ')
if (rownames(mysum$coefficients)[i] != '(Intercept)') {
myeq <- paste(myeq, rownames(mysum$coefficients)[i], sep='')
if (rownames(mysum$coefficients)[i] != 't') myeq <- paste(myeq, '[t]', sep='')
}
}
myeq <- paste(myeq, ' + e[t]')
a<-table.row.start(a)
a<-table.element(a, myeq)
a<-table.row.end(a)
a<-table.end(a)
table.save(a,file='mytable1.tab')
a<-table.start()
a<-table.row.start(a)
a<-table.element(a,hyperlink('ols1.htm','Multiple Linear Regression - Ordinary Least Squares',''), 6, TRUE)
a<-table.row.end(a)
a<-table.row.start(a)
a<-table.element(a,'Variable',header=TRUE)
a<-table.element(a,'Parameter',header=TRUE)
a<-table.element(a,'S.D.',header=TRUE)
a<-table.element(a,'T-STAT
H0: parameter = 0',header=TRUE)
a<-table.element(a,'2-tail p-value',header=TRUE)
a<-table.element(a,'1-tail p-value',header=TRUE)
a<-table.row.end(a)
for (i in 1:k){
a<-table.row.start(a)
a<-table.element(a,rownames(mysum$coefficients)[i],header=TRUE)
a<-table.element(a,mysum$coefficients[i,1])
a<-table.element(a, round(mysum$coefficients[i,2],6))
a<-table.element(a, round(mysum$coefficients[i,3],4))
a<-table.element(a, round(mysum$coefficients[i,4],6))
a<-table.element(a, round(mysum$coefficients[i,4]/2,6))
a<-table.row.end(a)
}
a<-table.end(a)
table.save(a,file='mytable2.tab')
a<-table.start()
a<-table.row.start(a)
a<-table.element(a, 'Multiple Linear Regression - Regression Statistics', 2, TRUE)
a<-table.row.end(a)
a<-table.row.start(a)
a<-table.element(a, 'Multiple R',1,TRUE)
a<-table.element(a, sqrt(mysum$r.squared))
a<-table.row.end(a)
a<-table.row.start(a)
a<-table.element(a, 'R-squared',1,TRUE)
a<-table.element(a, mysum$r.squared)
a<-table.row.end(a)
a<-table.row.start(a)
a<-table.element(a, 'Adjusted R-squared',1,TRUE)
a<-table.element(a, mysum$adj.r.squared)
a<-table.row.end(a)
a<-table.row.start(a)
a<-table.element(a, 'F-TEST (value)',1,TRUE)
a<-table.element(a, mysum$fstatistic[1])
a<-table.row.end(a)
a<-table.row.start(a)
a<-table.element(a, 'F-TEST (DF numerator)',1,TRUE)
a<-table.element(a, mysum$fstatistic[2])
a<-table.row.end(a)
a<-table.row.start(a)
a<-table.element(a, 'F-TEST (DF denominator)',1,TRUE)
a<-table.element(a, mysum$fstatistic[3])
a<-table.row.end(a)
a<-table.row.start(a)
a<-table.element(a, 'p-value',1,TRUE)
a<-table.element(a, 1-pf(mysum$fstatistic[1],mysum$fstatistic[2],mysum$fstatistic[3]))
a<-table.row.end(a)
a<-table.row.start(a)
a<-table.element(a, 'Multiple Linear Regression - Residual Statistics', 2, TRUE)
a<-table.row.end(a)
a<-table.row.start(a)
a<-table.element(a, 'Residual Standard Deviation',1,TRUE)
a<-table.element(a, mysum$sigma)
a<-table.row.end(a)
a<-table.row.start(a)
a<-table.element(a, 'Sum Squared Residuals',1,TRUE)
a<-table.element(a, sum(myerror*myerror))
a<-table.row.end(a)
a<-table.end(a)
table.save(a,file='mytable3.tab')
a<-table.start()
a<-table.row.start(a)
a<-table.element(a, 'Multiple Linear Regression - Actuals, Interpolation, and Residuals', 4, TRUE)
a<-table.row.end(a)
a<-table.row.start(a)
a<-table.element(a, 'Time or Index', 1, TRUE)
a<-table.element(a, 'Actuals', 1, TRUE)
a<-table.element(a, 'Interpolation
Forecast', 1, TRUE)
a<-table.element(a, 'Residuals
Prediction Error', 1, TRUE)
a<-table.row.end(a)
for (i in 1:n) {
a<-table.row.start(a)
a<-table.element(a,i, 1, TRUE)
a<-table.element(a,x[i])
a<-table.element(a,x[i]-mysum$resid[i])
a<-table.element(a,mysum$resid[i])
a<-table.row.end(a)
}
a<-table.end(a)
table.save(a,file='mytable4.tab')
if (n > n25) {
a<-table.start()
a<-table.row.start(a)
a<-table.element(a,'Goldfeld-Quandt test for Heteroskedasticity',4,TRUE)
a<-table.row.end(a)
a<-table.row.start(a)
a<-table.element(a,'p-values',header=TRUE)
a<-table.element(a,'Alternative Hypothesis',3,header=TRUE)
a<-table.row.end(a)
a<-table.row.start(a)
a<-table.element(a,'breakpoint index',header=TRUE)
a<-table.element(a,'greater',header=TRUE)
a<-table.element(a,'2-sided',header=TRUE)
a<-table.element(a,'less',header=TRUE)
a<-table.row.end(a)
for (mypoint in kp3:nmkm3) {
a<-table.row.start(a)
a<-table.element(a,mypoint,header=TRUE)
a<-table.element(a,gqarr[mypoint-kp3+1,1])
a<-table.element(a,gqarr[mypoint-kp3+1,2])
a<-table.element(a,gqarr[mypoint-kp3+1,3])
a<-table.row.end(a)
}
a<-table.end(a)
table.save(a,file='mytable5.tab')
a<-table.start()
a<-table.row.start(a)
a<-table.element(a,'Meta Analysis of Goldfeld-Quandt test for Heteroskedasticity',4,TRUE)
a<-table.row.end(a)
a<-table.row.start(a)
a<-table.element(a,'Description',header=TRUE)
a<-table.element(a,'# significant tests',header=TRUE)
a<-table.element(a,'% significant tests',header=TRUE)
a<-table.element(a,'OK/NOK',header=TRUE)
a<-table.row.end(a)
a<-table.row.start(a)
a<-table.element(a,'1% type I error level',header=TRUE)
a<-table.element(a,numsignificant1)
a<-table.element(a,numsignificant1/numgqtests)
if (numsignificant1/numgqtests < 0.01) dum <- 'OK' else dum <- 'NOK'
a<-table.element(a,dum)
a<-table.row.end(a)
a<-table.row.start(a)
a<-table.element(a,'5% type I error level',header=TRUE)
a<-table.element(a,numsignificant5)
a<-table.element(a,numsignificant5/numgqtests)
if (numsignificant5/numgqtests < 0.05) dum <- 'OK' else dum <- 'NOK'
a<-table.element(a,dum)
a<-table.row.end(a)
a<-table.row.start(a)
a<-table.element(a,'10% type I error level',header=TRUE)
a<-table.element(a,numsignificant10)
a<-table.element(a,numsignificant10/numgqtests)
if (numsignificant10/numgqtests < 0.1) dum <- 'OK' else dum <- 'NOK'
a<-table.element(a,dum)
a<-table.row.end(a)
a<-table.end(a)
table.save(a,file='mytable6.tab')
}