| Multiple Linear Regression - Estimated Regression Equation |
| Y[t] = + 1.29280924113589 + 0.893229584469757X[t] -0.132239691962144M1[t] -0.136510508583347M2[t] -0.120781325204556M3[t] -0.109322958446975M4[t] -0.0871875501363702M5[t] -0.0714583667575799M6[t] -0.162916733515161M7[t] -0.162916733515161M8[t] -0.129322958446975M9[t] -0.0357291833787896M10[t] + 0.0157291833787906M11[t] + e[t] |
| Multiple Linear Regression - Ordinary Least Squares | |||||
| Variable | Parameter | S.D. | T-STAT H0: parameter = 0 | 2-tail p-value | 1-tail p-value |
| (Intercept) | 1.29280924113589 | 0.653735 | 1.9776 | 0.053857 | 0.026929 |
| X | 0.893229584469757 | 0.080575 | 11.0857 | 0 | 0 |
| M1 | -0.132239691962144 | 0.255315 | -0.5179 | 0.606925 | 0.303463 |
| M2 | -0.136510508583347 | 0.255071 | -0.5352 | 0.595044 | 0.297522 |
| M3 | -0.120781325204556 | 0.254867 | -0.4739 | 0.637766 | 0.318883 |
| M4 | -0.109322958446975 | 0.254582 | -0.4294 | 0.669579 | 0.334789 |
| M5 | -0.0871875501363702 | 0.254638 | -0.3424 | 0.733578 | 0.366789 |
| M6 | -0.0714583667575799 | 0.254536 | -0.2807 | 0.780142 | 0.390071 |
| M7 | -0.162916733515161 | 0.254781 | -0.6394 | 0.525642 | 0.262821 |
| M8 | -0.162916733515161 | 0.254781 | -0.6394 | 0.525642 | 0.262821 |
| M9 | -0.129322958446975 | 0.254582 | -0.508 | 0.613842 | 0.306921 |
| M10 | -0.0357291833787896 | 0.254475 | -0.1404 | 0.888941 | 0.444471 |
| M11 | 0.0157291833787906 | 0.254475 | 0.0618 | 0.950976 | 0.475488 |
| Multiple Linear Regression - Regression Statistics | |
| Multiple R | 0.851031331526163 |
| R-squared | 0.724254327239195 |
| Adjusted R-squared | 0.653851176747074 |
| F-TEST (value) | 10.2872431443285 |
| F-TEST (DF numerator) | 12 |
| F-TEST (DF denominator) | 47 |
| p-value | 1.65884173064512e-09 |
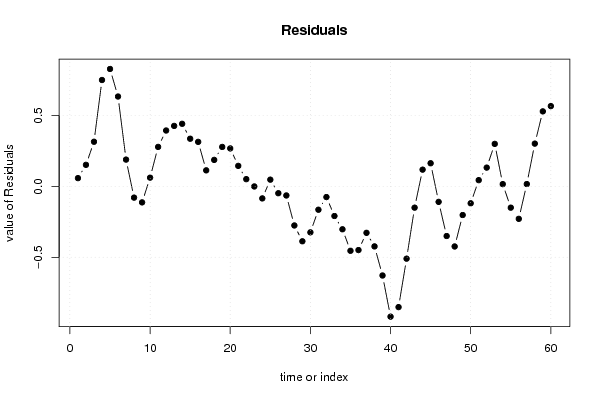
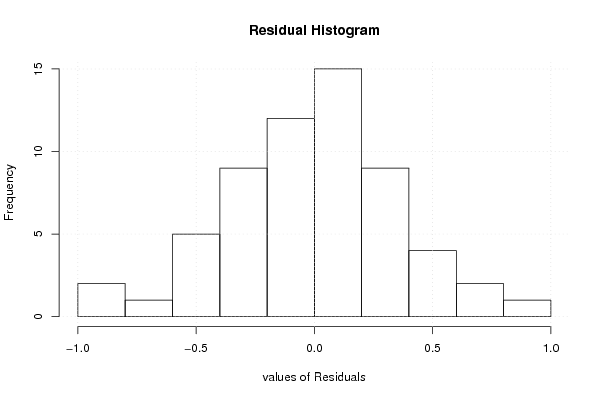
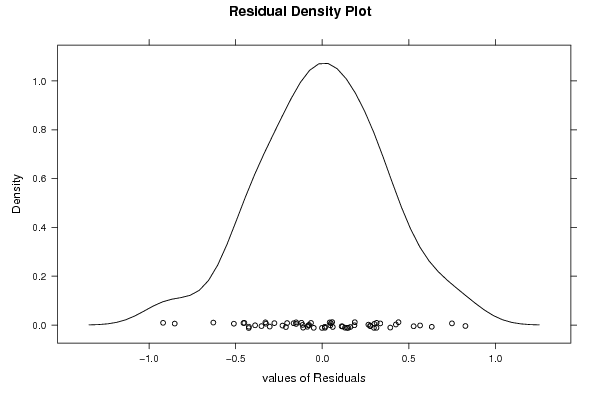
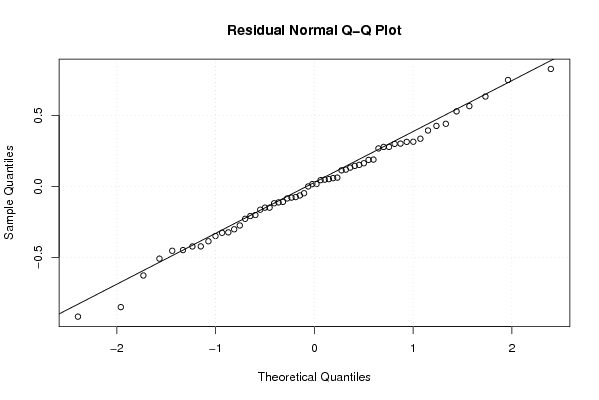
| Multiple Linear Regression - Residual Statistics | |
| Residual Standard Deviation | 0.40232772588807 |
| Sum Squared Residuals | 7.60777715385849 |
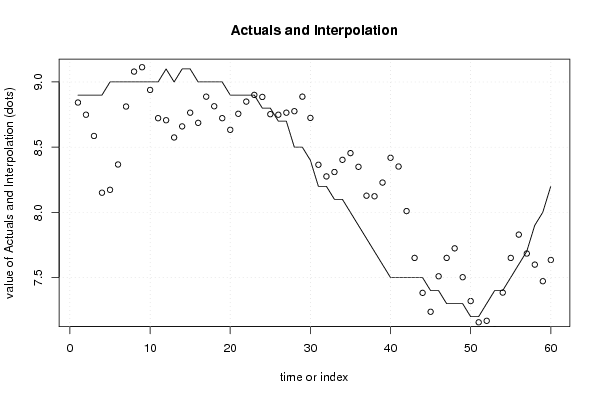
| Multiple Linear Regression - Actuals, Interpolation, and Residuals | |||
| Time or Index | Actuals | Interpolation Forecast | Residuals Prediction Error |
| 1 | 8.9 | 8.8423439756137 | 0.0576560243863022 |
| 2 | 8.9 | 8.74875020054548 | 0.151249799454517 |
| 3 | 8.9 | 8.58583346703032 | 0.314166532969678 |
| 4 | 8.9 | 8.15067704155302 | 0.749322958446976 |
| 5 | 9 | 8.17281244986363 | 0.82718755013637 |
| 6 | 9 | 8.36718755013637 | 0.632812449863629 |
| 7 | 9 | 8.81166693406064 | 0.188333065939356 |
| 8 | 9 | 9.07963580940157 | -0.0796358094015717 |
| 9 | 9 | 9.11322958446976 | -0.113229584469757 |
| 10 | 9 | 8.93885448419702 | 0.0611455158029848 |
| 11 | 9 | 8.72234397561367 | 0.277656024386331 |
| 12 | 9.1 | 8.70661479223488 | 0.393385207765121 |
| 13 | 9 | 8.57437510027274 | 0.425624899727265 |
| 14 | 9.1 | 8.6594272420985 | 0.440572757901492 |
| 15 | 9.1 | 8.76447938392427 | 0.335520616075726 |
| 16 | 9 | 8.68661479223488 | 0.313385207765121 |
| 17 | 9 | 8.88739611743943 | 0.112603882560565 |
| 18 | 9 | 8.81380234237125 | 0.186197657628751 |
| 19 | 9 | 8.72234397561367 | 0.277656024386331 |
| 20 | 8.9 | 8.63302101716669 | 0.266978982833307 |
| 21 | 8.9 | 8.75593775068185 | 0.144062249318146 |
| 22 | 8.9 | 8.84953152575004 | 0.0504684742499605 |
| 23 | 8.9 | 8.90098989250762 | -0.000989892507619604 |
| 24 | 8.8 | 8.88526070912883 | -0.0852607091288288 |
| 25 | 8.8 | 8.75302101716669 | 0.0469789828333149 |
| 26 | 8.7 | 8.74875020054548 | -0.0487502005454838 |
| 27 | 8.7 | 8.76447938392427 | -0.0644793839242739 |
| 28 | 8.5 | 8.77593775068185 | -0.275937750681854 |
| 29 | 8.5 | 8.88739611743943 | -0.387396117439435 |
| 30 | 8.4 | 8.72447938392427 | -0.324479383924274 |
| 31 | 8.2 | 8.36505214182577 | -0.165052141825766 |
| 32 | 8.2 | 8.27572918337879 | -0.0757291833787907 |
| 33 | 8.1 | 8.30932295844697 | -0.209322958446976 |
| 34 | 8.1 | 8.40291673351516 | -0.302916733515162 |
| 35 | 8 | 8.45437510027274 | -0.454375100272742 |
| 36 | 7.9 | 8.34932295844698 | -0.449322958446975 |
| 37 | 7.8 | 8.12776030803786 | -0.327760308037856 |
| 38 | 7.7 | 8.12348949141665 | -0.423489491416653 |
| 39 | 7.6 | 8.22854163324242 | -0.62854163324242 |
| 40 | 7.5 | 8.41864591689395 | -0.918645916893951 |
| 41 | 7.5 | 8.35145836675758 | -0.85145836675758 |
| 42 | 7.5 | 8.00989571634847 | -0.509895716348468 |
| 43 | 7.5 | 7.65046847424996 | -0.150468474249960 |
| 44 | 7.5 | 7.38249959890903 | 0.117500401090967 |
| 45 | 7.4 | 7.23744745708327 | 0.162552542916733 |
| 46 | 7.4 | 7.5096871490454 | -0.109687149045404 |
| 47 | 7.3 | 7.65046847424996 | -0.35046847424996 |
| 48 | 7.3 | 7.72406224931815 | -0.424062249318146 |
| 49 | 7.3 | 7.50249959890903 | -0.202499598909026 |
| 50 | 7.2 | 7.31958286539387 | -0.119582865393872 |
| 51 | 7.2 | 7.15666613187871 | 0.0433338681212891 |
| 52 | 7.3 | 7.16812449863629 | 0.131875501363708 |
| 53 | 7.4 | 7.10093694849992 | 0.299063051500079 |
| 54 | 7.4 | 7.38463500721964 | 0.0153649927803616 |
| 55 | 7.5 | 7.65046847424996 | -0.150468474249960 |
| 56 | 7.6 | 7.82911439114391 | -0.229114391143912 |
| 57 | 7.7 | 7.68406224931815 | 0.0159377506818545 |
| 58 | 7.9 | 7.59901010749238 | 0.300989892507620 |
| 59 | 8 | 7.47182255735601 | 0.528177442643991 |
| 60 | 8.2 | 7.63473929087117 | 0.56526070912883 |
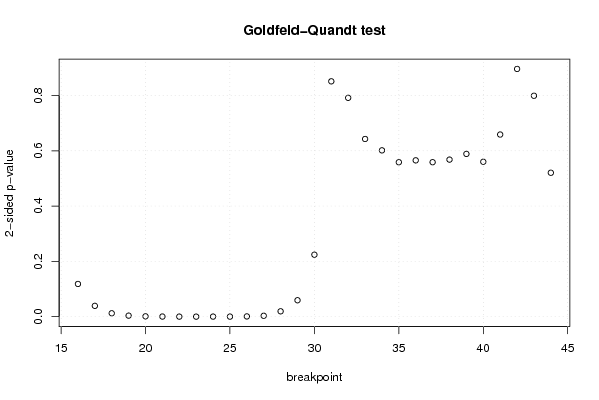
| Goldfeld-Quandt test for Heteroskedasticity | |||
| p-values | Alternative Hypothesis | ||
| breakpoint index | greater | 2-sided | less |
| 16 | 0.0591436358642762 | 0.118287271728552 | 0.940856364135724 |
| 17 | 0.0195706844427628 | 0.0391413688855256 | 0.980429315557237 |
| 18 | 0.00613296986511946 | 0.0122659397302389 | 0.99386703013488 |
| 19 | 0.00188243651159189 | 0.00376487302318378 | 0.998117563488408 |
| 20 | 0.000645844864909 | 0.001291689729818 | 0.99935415513509 |
| 21 | 0.000203887873636862 | 0.000407775747273725 | 0.999796112126363 |
| 22 | 7.00172062510889e-05 | 0.000140034412502178 | 0.999929982793749 |
| 23 | 2.97533403541544e-05 | 5.95066807083089e-05 | 0.999970246659646 |
| 24 | 0.000118775122735336 | 0.000237550245470672 | 0.999881224877265 |
| 25 | 0.000106980508553051 | 0.000213961017106103 | 0.999893019491447 |
| 26 | 0.000450393979264859 | 0.000900787958529717 | 0.999549606020735 |
| 27 | 0.00159308907565576 | 0.00318617815131152 | 0.998406910924344 |
| 28 | 0.00969314577197446 | 0.0193862915439489 | 0.990306854228026 |
| 29 | 0.0296907195928844 | 0.0593814391857687 | 0.970309280407116 |
| 30 | 0.112075304837800 | 0.224150609675601 | 0.8879246951622 |
| 31 | 0.4255721336463 | 0.8511442672926 | 0.5744278663537 |
| 32 | 0.604256005221389 | 0.791487989557221 | 0.395743994778611 |
| 33 | 0.678673469658677 | 0.642653060682645 | 0.321326530341323 |
| 34 | 0.699214375969072 | 0.601571248061857 | 0.300785624030928 |
| 35 | 0.72071741891226 | 0.558565162175479 | 0.279282581087740 |
| 36 | 0.717305513531532 | 0.565388972936936 | 0.282694486468468 |
| 37 | 0.720670528792788 | 0.558658942414424 | 0.279329471207212 |
| 38 | 0.716003976645226 | 0.567992046709547 | 0.283996023354774 |
| 39 | 0.705654698786697 | 0.588690602426605 | 0.294345301213303 |
| 40 | 0.719891051662843 | 0.560217896674314 | 0.280108948337157 |
| 41 | 0.670628359298518 | 0.658743281402964 | 0.329371640701482 |
| 42 | 0.552033319699904 | 0.895933360600193 | 0.447966680300096 |
| 43 | 0.399473384974539 | 0.798946769949079 | 0.600526615025461 |
| 44 | 0.260253603819089 | 0.520507207638177 | 0.739746396180911 |
| Meta Analysis of Goldfeld-Quandt test for Heteroskedasticity | |||
| Description | # significant tests | % significant tests | OK/NOK |
| 1% type I error level | 9 | 0.310344827586207 | NOK |
| 5% type I error level | 12 | 0.413793103448276 | NOK |
| 10% type I error level | 13 | 0.448275862068966 | NOK |