| Multiple Linear Regression - Estimated Regression Equation |
| bouwaanvragen[t] = + 4316.33430518384 + 0.0110801554434606inschrijvingen_autos[t] + e[t] |
| Multiple Linear Regression - Ordinary Least Squares | |||||
| Variable | Parameter | S.D. | T-STAT H0: parameter = 0 | 2-tail p-value | 1-tail p-value |
| (Intercept) | 4316.33430518384 | 329.916793 | 13.0831 | 0 | 0 |
| inschrijvingen_autos | 0.0110801554434606 | 0.014082 | 0.7868 | 0.434587 | 0.217294 |
| Multiple Linear Regression - Regression Statistics | |
| Multiple R | 0.102768301789830 |
| R-squared | 0.0105613238527655 |
| Adjusted R-squared | -0.00649796366701438 |
| F-TEST (value) | 0.619095248879525 |
| F-TEST (DF numerator) | 1 |
| F-TEST (DF denominator) | 58 |
| p-value | 0.434587018191825 |
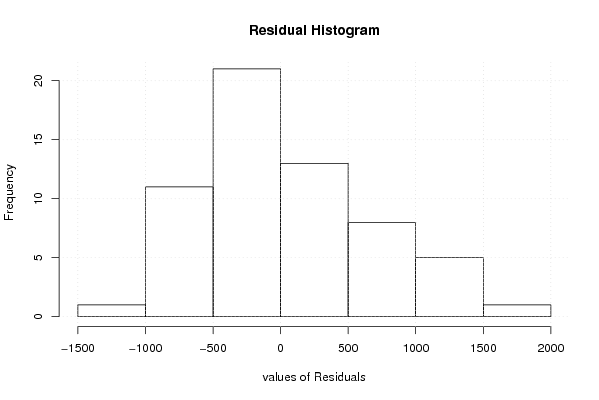
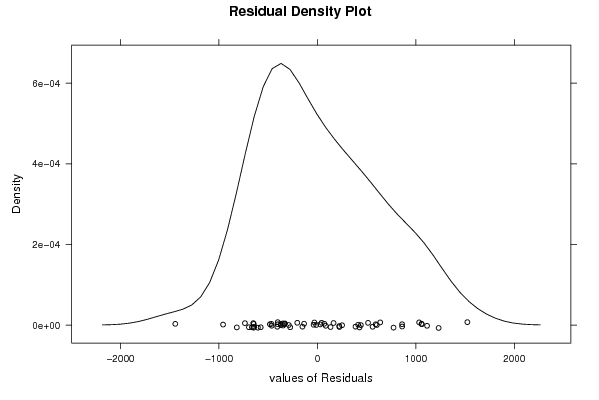
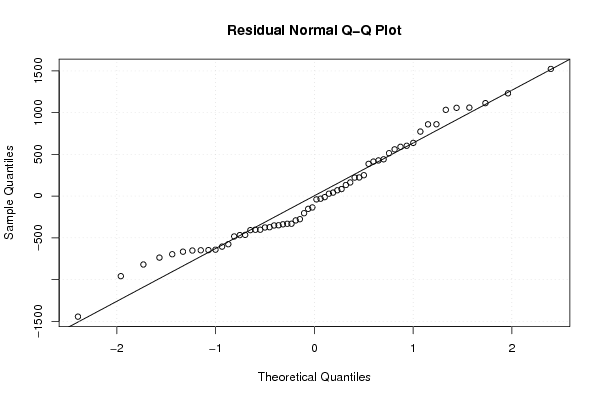
| Multiple Linear Regression - Residual Statistics | |
| Residual Standard Deviation | 627.789965491755 |
| Sum Squared Residuals | 22858973.9647841 |
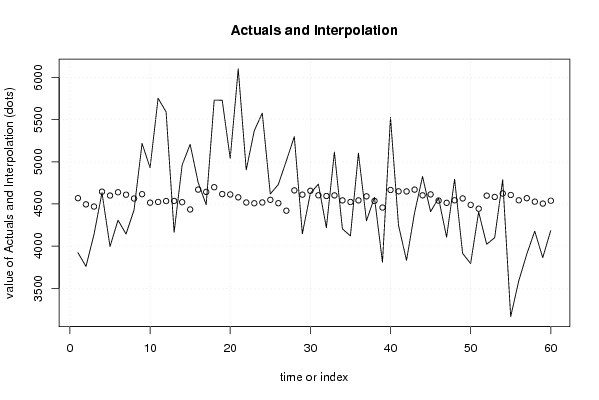
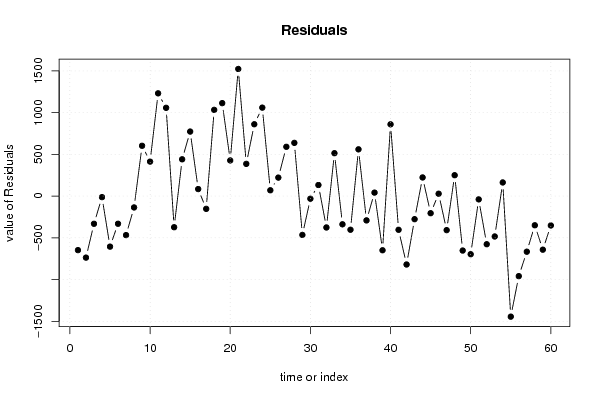
| Multiple Linear Regression - Actuals, Interpolation, and Residuals | |||
| Time or Index | Actuals | Interpolation Forecast | Residuals Prediction Error |
| 1 | 3922 | 4568.76240649678 | -646.762406496776 |
| 2 | 3759 | 4495.48933854916 | -736.489338549158 |
| 3 | 4138 | 4469.31801139171 | -331.318011391705 |
| 4 | 4634 | 4645.89136853869 | -11.8913685386938 |
| 5 | 3995 | 4599.88656313745 | -604.886563137445 |
| 6 | 4308 | 4638.72250796678 | -330.722507966775 |
| 7 | 4143 | 4609.75898163757 | -466.758981637569 |
| 8 | 4429 | 4564.57410773914 | -135.574107739136 |
| 9 | 5219 | 4615.98602899679 | 603.013971003207 |
| 10 | 4929 | 4515.44469850283 | 413.555301497168 |
| 11 | 5755 | 4523.86561663986 | 1231.13438336014 |
| 12 | 5592 | 4534.43608493292 | 1057.56391506708 |
| 13 | 4163 | 4535.55518063271 | -372.555180632713 |
| 14 | 4962 | 4521.08449762355 | 440.915502376447 |
| 15 | 5208 | 4434.86980811799 | 773.130191882014 |
| 16 | 4755 | 4670.41175253507 | 84.5882474649278 |
| 17 | 4491 | 4643.26537169859 | -152.265371698594 |
| 18 | 5732 | 4698.6661489159 | 1033.33385108410 |
| 19 | 5731 | 4617.32672780545 | 1113.67327219455 |
| 20 | 5040 | 4612.57334112021 | 427.426658879792 |
| 21 | 6102 | 4578.83426779487 | 1523.16573220513 |
| 22 | 4904 | 4517.51668757076 | 386.483312429241 |
| 23 | 5369 | 4508.33123870813 | 860.66876129187 |
| 24 | 5578 | 4518.04853503205 | 1059.95146496795 |
| 25 | 4619 | 4548.9621687193 | 70.0378312807 |
| 26 | 4731 | 4508.92956710208 | 222.070432897923 |
| 27 | 5011 | 4420.12212122274 | 590.87787877726 |
| 28 | 5299 | 4661.19306320611 | 637.806936793887 |
| 29 | 4146 | 4610.52351236317 | -464.523512363167 |
| 30 | 4625 | 4655.95214968136 | -30.9521496813561 |
| 31 | 4736 | 4602.85604479629 | 133.143955203707 |
| 32 | 4219 | 4594.44620681471 | -375.446206814706 |
| 33 | 5116 | 4601.95855220537 | 514.041447794628 |
| 34 | 4205 | 4542.56891902842 | -337.568919028423 |
| 35 | 4121 | 4523.40025011124 | -402.400250111236 |
| 36 | 5103 | 4542.63539996108 | 560.364600038916 |
| 37 | 4300 | 4590.85623645102 | -290.856236451025 |
| 38 | 4578 | 4535.87650514057 | 42.1234948594270 |
| 39 | 3809 | 4457.47332522265 | -648.473325222645 |
| 40 | 5526 | 4666.09049191212 | 859.909508087877 |
| 41 | 4247 | 4649.96886574189 | -402.968865741887 |
| 42 | 3830 | 4648.94949144109 | -818.949491441089 |
| 43 | 4394 | 4670.16798911532 | -276.167989115316 |
| 44 | 4826 | 4602.49039966666 | 223.509600333342 |
| 45 | 4409 | 4613.67027650911 | -204.670276509110 |
| 46 | 4569 | 4540.20884591897 | 28.7911540810339 |
| 47 | 4106 | 4513.43919036757 | -407.439190367565 |
| 48 | 4794 | 4543.69909488366 | 250.300905116344 |
| 49 | 3914 | 4565.83724545969 | -651.83724545969 |
| 50 | 3793 | 4488.87448574941 | -695.874485749413 |
| 51 | 4405 | 4443.85581418263 | -38.8558141826323 |
| 52 | 4022 | 4598.29102075359 | -576.291020753587 |
| 53 | 4100 | 4583.25524981681 | -483.255249816811 |
| 54 | 4788 | 4624.20750433584 | 163.792495664159 |
| 55 | 3163 | 4606.57897702530 | -1443.57897702530 |
| 56 | 3585 | 4543.65477426188 | -958.654774261882 |
| 57 | 3903 | 4568.50756292156 | -665.507562921565 |
| 58 | 4178 | 4527.16750296201 | -349.167502962013 |
| 59 | 3863 | 4504.37562321481 | -641.375623214814 |
| 60 | 4187 | 4538.33629964902 | -351.336299649021 |
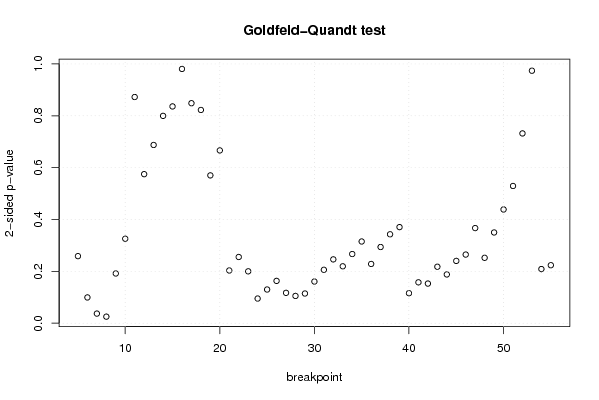
| Goldfeld-Quandt test for Heteroskedasticity | |||
| p-values | Alternative Hypothesis | ||
| breakpoint index | greater | 2-sided | less |
| 5 | 0.129349209030593 | 0.258698418061187 | 0.870650790969407 |
| 6 | 0.0497226287893394 | 0.0994452575786789 | 0.95027737121066 |
| 7 | 0.018580179201132 | 0.037160358402264 | 0.981419820798868 |
| 8 | 0.0126618264193884 | 0.0253236528387767 | 0.987338173580612 |
| 9 | 0.0958925350080506 | 0.191785070016101 | 0.90410746499195 |
| 10 | 0.162912083438284 | 0.325824166876569 | 0.837087916561716 |
| 11 | 0.563905278912074 | 0.872189442175851 | 0.436094721087926 |
| 12 | 0.712629761482145 | 0.57474047703571 | 0.287370238517855 |
| 13 | 0.65631172704128 | 0.687376545917439 | 0.343688272958719 |
| 14 | 0.600256722049485 | 0.79948655590103 | 0.399743277950515 |
| 15 | 0.582035238417111 | 0.835929523165778 | 0.417964761582889 |
| 16 | 0.509765546294941 | 0.980468907410118 | 0.490234453705059 |
| 17 | 0.424154044027371 | 0.848308088054742 | 0.575845955972629 |
| 18 | 0.588829231877188 | 0.822341536245624 | 0.411170768122812 |
| 19 | 0.714962019049523 | 0.570075961900953 | 0.285037980950477 |
| 20 | 0.66682144570697 | 0.66635710858606 | 0.33317855429303 |
| 21 | 0.898322195980536 | 0.203355608038929 | 0.101677804019464 |
| 22 | 0.872319944976305 | 0.255360110047391 | 0.127680055023695 |
| 23 | 0.89993179351886 | 0.200136412962281 | 0.100068206481141 |
| 24 | 0.952415461636498 | 0.0951690767270034 | 0.0475845383635017 |
| 25 | 0.935010438693762 | 0.129979122612476 | 0.0649895613062381 |
| 26 | 0.918372962249314 | 0.163254075501371 | 0.0816270377506857 |
| 27 | 0.941440477132764 | 0.117119045734472 | 0.058559522867236 |
| 28 | 0.947410073932567 | 0.105179852134866 | 0.0525899260674331 |
| 29 | 0.942711695227769 | 0.114576609544463 | 0.0572883047722314 |
| 30 | 0.919623929627446 | 0.160752140745108 | 0.0803760703725542 |
| 31 | 0.897004885200274 | 0.205990229599452 | 0.102995114799726 |
| 32 | 0.876897793702558 | 0.246204412594884 | 0.123102206297442 |
| 33 | 0.890251562311802 | 0.219496875376396 | 0.109748437688198 |
| 34 | 0.866625679618426 | 0.266748640763148 | 0.133374320381574 |
| 35 | 0.84243342710119 | 0.315133145797621 | 0.157566572898810 |
| 36 | 0.885774706412105 | 0.22845058717579 | 0.114225293587895 |
| 37 | 0.853087827689057 | 0.293824344621886 | 0.146912172310943 |
| 38 | 0.828539915989134 | 0.342920168021732 | 0.171460084010866 |
| 39 | 0.814679064723102 | 0.370641870553796 | 0.185320935276898 |
| 40 | 0.94209676004102 | 0.115806479917960 | 0.0579032399589798 |
| 41 | 0.921153526473788 | 0.157692947052425 | 0.0788464735262123 |
| 42 | 0.92355327642166 | 0.152893447156681 | 0.0764467235783404 |
| 43 | 0.891116767171938 | 0.217766465656124 | 0.108883232828062 |
| 44 | 0.905949695744399 | 0.188100608511202 | 0.094050304255601 |
| 45 | 0.879842427298586 | 0.240315145402829 | 0.120157572701414 |
| 46 | 0.867641647653206 | 0.264716704693588 | 0.132358352346794 |
| 47 | 0.816550489876367 | 0.366899020247265 | 0.183449510123633 |
| 48 | 0.87389186254734 | 0.252216274905319 | 0.126108137452660 |
| 49 | 0.825029197410252 | 0.349941605179497 | 0.174970802589748 |
| 50 | 0.780681757029495 | 0.438636485941010 | 0.219318242970505 |
| 51 | 0.735424299717114 | 0.529151400565772 | 0.264575700282886 |
| 52 | 0.634038431268874 | 0.731923137462252 | 0.365961568731126 |
| 53 | 0.51317856133544 | 0.97364287732912 | 0.48682143866456 |
| 54 | 0.895604050174316 | 0.208791899651368 | 0.104395949825684 |
| 55 | 0.888187215568403 | 0.223625568863193 | 0.111812784431597 |
| Meta Analysis of Goldfeld-Quandt test for Heteroskedasticity | |||
| Description | # significant tests | % significant tests | OK/NOK |
| 1% type I error level | 0 | 0 | OK |
| 5% type I error level | 2 | 0.0392156862745098 | OK |
| 10% type I error level | 4 | 0.0784313725490196 | OK |