| Multiple Linear Regression - Estimated Regression Equation |
| Britse_pond[t] = + 0.261141331976786 + 0.241000719518527Zwitserse_frank[t] + 0.00488968621576873M1[t] -0.000975010761816689M2[t] + 0.000415678146259142M3[t] -0.00451061566544505M4[t] + 0.00190711140066335M5[t] -0.00375862229591785M6[t] -0.00306619760422058M7[t] -0.00108835102738477M8[t] -0.00311442237833564M9[t] -0.00068715391636125M10[t] -0.000232003526077248M11[t] + 0.00114231325047974t + e[t] |
| Multiple Linear Regression - Ordinary Least Squares | |||||
| Variable | Parameter | S.D. | T-STAT H0: parameter = 0 | 2-tail p-value | 1-tail p-value |
| (Intercept) | 0.261141331976786 | 0.138032 | 1.8919 | 0.064811 | 0.032406 |
| Zwitserse_frank | 0.241000719518527 | 0.09358 | 2.5754 | 0.013294 | 0.006647 |
| M1 | 0.00488968621576873 | 0.013263 | 0.3687 | 0.714066 | 0.357033 |
| M2 | -0.000975010761816689 | 0.013283 | -0.0734 | 0.941804 | 0.470902 |
| M3 | 0.000415678146259142 | 0.013222 | 0.0314 | 0.975057 | 0.487528 |
| M4 | -0.00451061566544505 | 0.013202 | -0.3417 | 0.734168 | 0.367084 |
| M5 | 0.00190711140066335 | 0.013175 | 0.1448 | 0.885539 | 0.442769 |
| M6 | -0.00375862229591785 | 0.013158 | -0.2856 | 0.77643 | 0.388215 |
| M7 | -0.00306619760422058 | 0.013159 | -0.233 | 0.816792 | 0.408396 |
| M8 | -0.00108835102738477 | 0.013143 | -0.0828 | 0.934364 | 0.467182 |
| M9 | -0.00311442237833564 | 0.013114 | -0.2375 | 0.813329 | 0.406665 |
| M10 | -0.00068715391636125 | 0.013097 | -0.0525 | 0.958384 | 0.479192 |
| M11 | -0.000232003526077248 | 0.013094 | -0.0177 | 0.985941 | 0.49297 |
| t | 0.00114231325047974 | 0.000197 | 5.7852 | 1e-06 | 0 |
| Multiple Linear Regression - Regression Statistics | |
| Multiple R | 0.818420057509127 |
| R-squared | 0.669811390533243 |
| Adjusted R-squared | 0.576497218292637 |
| F-TEST (value) | 7.17802424272887 |
| F-TEST (DF numerator) | 13 |
| F-TEST (DF denominator) | 46 |
| p-value | 2.32630924967836e-07 |
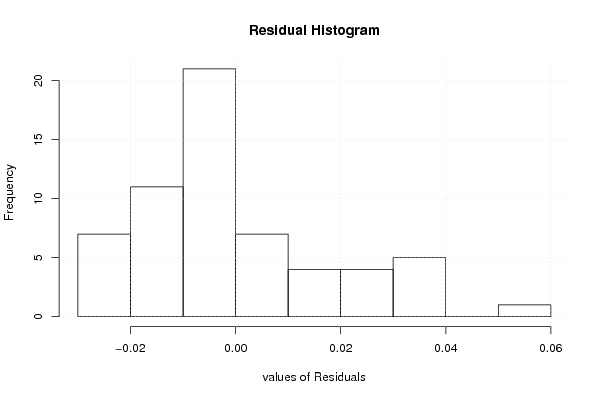
| Multiple Linear Regression - Residual Statistics | |
| Residual Standard Deviation | 0.0206969578926357 |
| Sum Squared Residuals | 0.0197047470364387 |
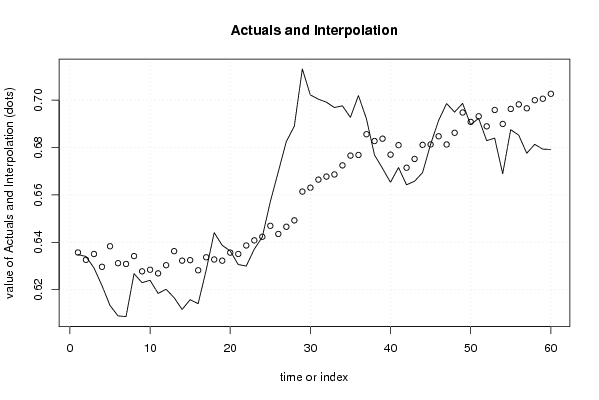
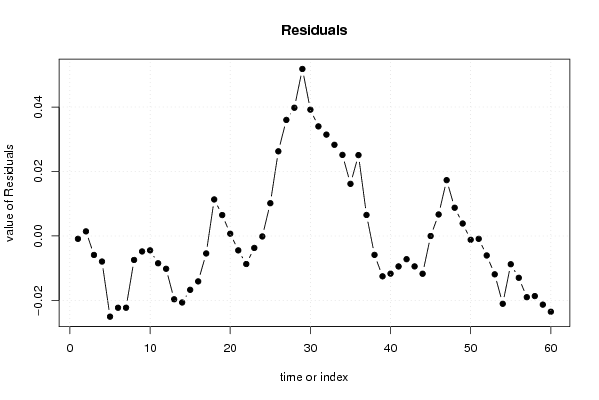
| Multiple Linear Regression - Actuals, Interpolation, and Residuals | |||
| Time or Index | Actuals | Interpolation Forecast | Residuals Prediction Error |
| 1 | 0.6348 | 0.635687531658816 | -0.000887531658816348 |
| 2 | 0.634 | 0.632579852752483 | 0.00142014724751673 |
| 3 | 0.62915 | 0.635040554695183 | -0.00589055469518334 |
| 4 | 0.62168 | 0.629617769241233 | -0.00793776924123293 |
| 5 | 0.61328 | 0.638310512939558 | -0.0250305129395581 |
| 6 | 0.6089 | 0.631160184650705 | -0.0222601846507047 |
| 7 | 0.60857 | 0.630825916117215 | -0.0222559161172149 |
| 8 | 0.62672 | 0.634162976592097 | -0.00744297659209714 |
| 9 | 0.62291 | 0.627712101870748 | -0.00480210187074816 |
| 10 | 0.62393 | 0.62838967494898 | -0.00445967494897994 |
| 11 | 0.61838 | 0.626854129236003 | -0.00847412923600273 |
| 12 | 0.62012 | 0.63030105220042 | -0.0101810522004191 |
| 13 | 0.61659 | 0.63623665137886 | -0.0196466513788602 |
| 14 | 0.6116 | 0.63223726981031 | -0.0206372698103101 |
| 15 | 0.61573 | 0.632432564989536 | -0.0167025649895359 |
| 16 | 0.61407 | 0.628166582989274 | -0.0140965829892745 |
| 17 | 0.62823 | 0.633654017118003 | -0.00542401711800331 |
| 18 | 0.64405 | 0.632721507392728 | 0.0113284926072722 |
| 19 | 0.6387 | 0.632218538355575 | 0.0064814616444249 |
| 20 | 0.63633 | 0.635627899046313 | 0.000702100953687009 |
| 21 | 0.63059 | 0.635057441881216 | -0.00446744188121595 |
| 22 | 0.62994 | 0.638651123665622 | -0.00871112366562185 |
| 23 | 0.63709 | 0.640802888961278 | -0.00371288896127822 |
| 24 | 0.64217 | 0.642321806169546 | -0.000151806169546329 |
| 25 | 0.65711 | 0.646956001462587 | 0.0101539985374126 |
| 26 | 0.66977 | 0.64351092154893 | 0.0262590784510701 |
| 27 | 0.68255 | 0.646550025218474 | 0.0359999747815256 |
| 28 | 0.68902 | 0.649248964012298 | 0.0397710359877017 |
| 29 | 0.71322 | 0.66141211807169 | 0.0518078819283096 |
| 30 | 0.70224 | 0.663058316045263 | 0.0391816839547368 |
| 31 | 0.70045 | 0.66645955866431 | 0.0339904413356894 |
| 32 | 0.69919 | 0.667748113023285 | 0.0314418869767146 |
| 33 | 0.69693 | 0.668647760247251 | 0.0282822397527487 |
| 34 | 0.69763 | 0.672482442751176 | 0.0251475572488241 |
| 35 | 0.69278 | 0.676610413946884 | 0.0161695860531158 |
| 36 | 0.70196 | 0.676876127413656 | 0.0250838725863441 |
| 37 | 0.69215 | 0.685631435010464 | 0.00651856498953627 |
| 38 | 0.6769 | 0.68276475682365 | -0.00586475682365074 |
| 39 | 0.67124 | 0.683755354377288 | -0.0125153543772878 |
| 40 | 0.66532 | 0.677007064965985 | -0.0116870649659854 |
| 41 | 0.67157 | 0.681024394705651 | -0.00945439470565118 |
| 42 | 0.66428 | 0.671488159293564 | -0.0072081592935644 |
| 43 | 0.66576 | 0.675202702847986 | -0.00944270284798583 |
| 44 | 0.66942 | 0.681142571093668 | -0.0117225710936682 |
| 45 | 0.6813 | 0.681319216159079 | -1.92161590785556e-05 |
| 46 | 0.69144 | 0.684768297511773 | 0.0066717024882266 |
| 47 | 0.69862 | 0.681304746042648 | 0.0173152539573519 |
| 48 | 0.695 | 0.68624587346808 | 0.0087541265319206 |
| 49 | 0.69867 | 0.694808380489272 | 0.00386161951072767 |
| 50 | 0.68968 | 0.690857199064626 | -0.00117719906462599 |
| 51 | 0.69233 | 0.693221500719519 | -0.000891500719518575 |
| 52 | 0.68293 | 0.688979618791209 | -0.00604961879120892 |
| 53 | 0.68399 | 0.695888957165097 | -0.0118989571650970 |
| 54 | 0.66895 | 0.68999183261774 | -0.0210418326177399 |
| 55 | 0.68756 | 0.696333284014913 | -0.00877328401491351 |
| 56 | 0.68527 | 0.698248440244636 | -0.0129784402446363 |
| 57 | 0.6776 | 0.696593479841706 | -0.018993479841706 |
| 58 | 0.68137 | 0.700018461122449 | -0.0186484611224489 |
| 59 | 0.67933 | 0.700627821813187 | -0.0212978218131867 |
| 60 | 0.67922 | 0.7027251407483 | -0.0235051407482993 |
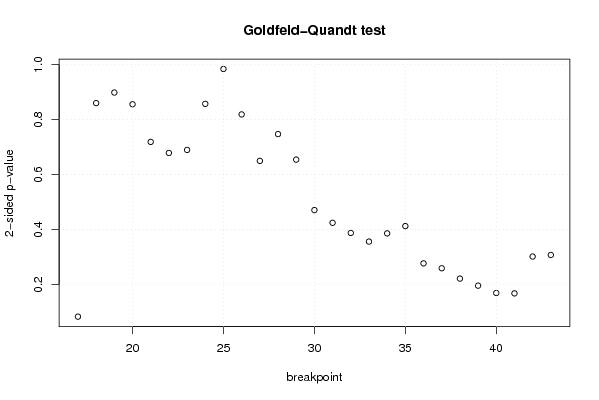
| Goldfeld-Quandt test for Heteroskedasticity | |||
| p-values | Alternative Hypothesis | ||
| breakpoint index | greater | 2-sided | less |
| 17 | 0.0413784945245326 | 0.0827569890490652 | 0.958621505475467 |
| 18 | 0.570104167688176 | 0.85979166462365 | 0.429895832311824 |
| 19 | 0.55087019966042 | 0.898259600679161 | 0.449129800339580 |
| 20 | 0.427835444792791 | 0.855670889585582 | 0.572164555207209 |
| 21 | 0.359340170769428 | 0.718680341538855 | 0.640659829230572 |
| 22 | 0.339169708176823 | 0.678339416353647 | 0.660830291823177 |
| 23 | 0.344711387733875 | 0.68942277546775 | 0.655288612266125 |
| 24 | 0.428564598696034 | 0.857129197392069 | 0.571435401303966 |
| 25 | 0.507941723209632 | 0.984116553580735 | 0.492058276790368 |
| 26 | 0.590663239319394 | 0.818673521361212 | 0.409336760680606 |
| 27 | 0.675163009528125 | 0.64967398094375 | 0.324836990471875 |
| 28 | 0.626448849129152 | 0.747102301741695 | 0.373551150870848 |
| 29 | 0.672891666023559 | 0.654216667952881 | 0.327108333976441 |
| 30 | 0.764733982479376 | 0.470532035041248 | 0.235266017520624 |
| 31 | 0.787890571098882 | 0.424218857802235 | 0.212109428901118 |
| 32 | 0.80634727817509 | 0.387305443649819 | 0.193652721824910 |
| 33 | 0.822023239561195 | 0.355953520877609 | 0.177976760438804 |
| 34 | 0.807097678024853 | 0.385804643950293 | 0.192902321975147 |
| 35 | 0.793835902793481 | 0.412328194413038 | 0.206164097206519 |
| 36 | 0.861637815466357 | 0.276724369067286 | 0.138362184533643 |
| 37 | 0.87057656341642 | 0.25884687316716 | 0.12942343658358 |
| 38 | 0.889430693205862 | 0.221138613588277 | 0.110569306794138 |
| 39 | 0.902192931310464 | 0.195614137379071 | 0.0978070686895356 |
| 40 | 0.915596331954314 | 0.168807336091372 | 0.084403668045686 |
| 41 | 0.916236848510365 | 0.16752630297927 | 0.083763151489635 |
| 42 | 0.849247929962706 | 0.301504140074588 | 0.150752070037294 |
| 43 | 0.846376693944704 | 0.307246612110593 | 0.153623306055296 |
| Meta Analysis of Goldfeld-Quandt test for Heteroskedasticity | |||
| Description | # significant tests | % significant tests | OK/NOK |
| 1% type I error level | 0 | 0 | OK |
| 5% type I error level | 0 | 0 | OK |
| 10% type I error level | 1 | 0.0370370370370370 | OK |