| Multiple Linear Regression - Estimated Regression Equation |
| Werkl[t] = + 13.181305483574 -0.0167499771012351Infl[t] + 1.01704809359358`Yt-1`[t] + 0.0183717956239474`Yt-2`[t] -0.304695129059736`Yt-3`[t] + 0.159093233761395`Yt-4`[t] + 0.0623924437488247M1[t] + 0.205812380211141M2[t] -0.0775331339962117M3[t] -0.106742976619106M4[t] + 0.0578994848837974M5[t] + 0.227318039355702M6[t] + 0.177074745524402M7[t] + 0.165127828048767M8[t] + 0.204067321450513M9[t] + 0.271447808716314M10[t] + 0.142836066402679M11[t] -0.00332475677410949t + e[t] |
| Multiple Linear Regression - Ordinary Least Squares | |||||
| Variable | Parameter | S.D. | T-STAT H0: parameter = 0 | 2-tail p-value | 1-tail p-value |
| (Intercept) | 13.181305483574 | 6.770538 | 1.9469 | 0.058971 | 0.029485 |
| Infl | -0.0167499771012351 | 0.004804 | -3.487 | 0.00125 | 0.000625 |
| `Yt-1` | 1.01704809359358 | 0.151537 | 6.7115 | 0 | 0 |
| `Yt-2` | 0.0183717956239474 | 0.220522 | 0.0833 | 0.934042 | 0.467021 |
| `Yt-3` | -0.304695129059736 | 0.221958 | -1.3728 | 0.177875 | 0.088938 |
| `Yt-4` | 0.159093233761395 | 0.147438 | 1.0791 | 0.287366 | 0.143683 |
| M1 | 0.0623924437488247 | 0.085715 | 0.7279 | 0.471132 | 0.235566 |
| M2 | 0.205812380211141 | 0.092299 | 2.2298 | 0.031743 | 0.015871 |
| M3 | -0.0775331339962117 | 0.09766 | -0.7939 | 0.432177 | 0.216089 |
| M4 | -0.106742976619106 | 0.100624 | -1.0608 | 0.295473 | 0.147736 |
| M5 | 0.0578994848837974 | 0.089024 | 0.6504 | 0.519361 | 0.25968 |
| M6 | 0.227318039355702 | 0.089078 | 2.5519 | 0.014858 | 0.007429 |
| M7 | 0.177074745524402 | 0.095133 | 1.8613 | 0.070444 | 0.035222 |
| M8 | 0.165127828048767 | 0.087082 | 1.8962 | 0.065552 | 0.032776 |
| M9 | 0.204067321450513 | 0.090057 | 2.266 | 0.029232 | 0.014616 |
| M10 | 0.271447808716314 | 0.087615 | 3.0982 | 0.003653 | 0.001827 |
| M11 | 0.142836066402679 | 0.093264 | 1.5315 | 0.133925 | 0.066962 |
| t | -0.00332475677410949 | 0.003697 | -0.8993 | 0.374174 | 0.187087 |
| Multiple Linear Regression - Regression Statistics | |
| Multiple R | 0.996509035112443 |
| R-squared | 0.993030257060732 |
| Adjusted R-squared | 0.989912214166848 |
| F-TEST (value) | 318.478703102129 |
| F-TEST (DF numerator) | 17 |
| F-TEST (DF denominator) | 38 |
| p-value | 0 |
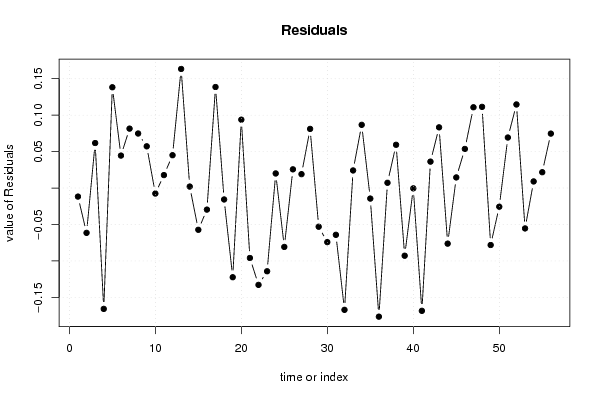
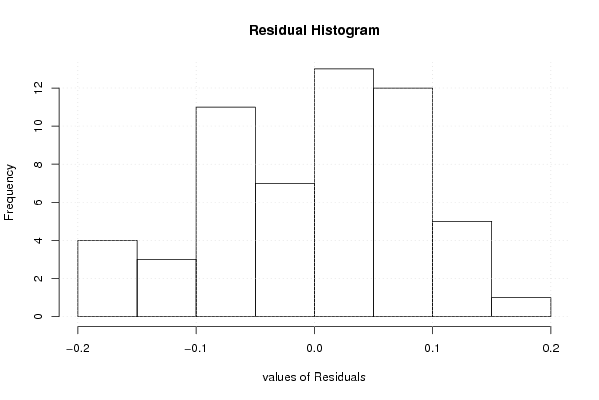
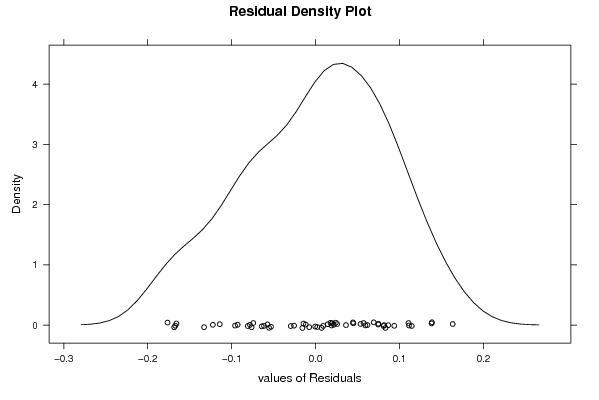
| Multiple Linear Regression - Residual Statistics | |
| Residual Standard Deviation | 0.102457087339735 |
| Sum Squared Residuals | 0.398903280353396 |
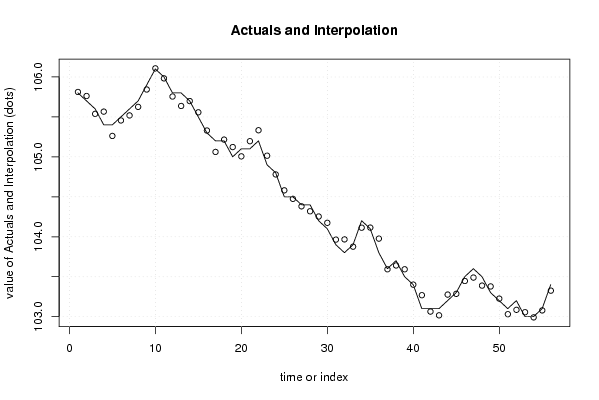
| Multiple Linear Regression - Actuals, Interpolation, and Residuals | |||
| Time or Index | Actuals | Interpolation Forecast | Residuals Prediction Error |
| 1 | 105.8 | 105.811705379203 | -0.0117053792030353 |
| 2 | 105.7 | 105.761465623687 | -0.0614656236867831 |
| 3 | 105.6 | 105.538238344935 | 0.0617616550653452 |
| 4 | 105.4 | 105.565796742347 | -0.165796742346709 |
| 5 | 105.4 | 105.261728213864 | 0.138271786136022 |
| 6 | 105.5 | 105.455457819068 | 0.0445421809319375 |
| 7 | 105.6 | 105.518474321476 | 0.0815256785244096 |
| 8 | 105.7 | 105.625175920699 | 0.074824079300987 |
| 9 | 105.9 | 105.842737984500 | 0.057262015499536 |
| 10 | 106.1 | 106.107530310004 | -0.00753031000418853 |
| 11 | 106 | 105.982192853406 | 0.0178071465936141 |
| 12 | 105.8 | 105.754946792834 | 0.0450532071662002 |
| 13 | 105.8 | 105.636597224612 | 0.163402775388063 |
| 14 | 105.7 | 105.697956392603 | 0.00204360739653135 |
| 15 | 105.5 | 105.557285737623 | -0.057285737623412 |
| 16 | 105.3 | 105.329560635946 | -0.0295606359461054 |
| 17 | 105.2 | 105.061339221509 | 0.138660778491294 |
| 18 | 105.2 | 105.215658486752 | -0.0156584867517507 |
| 19 | 105 | 105.122373727239 | -0.122373727238677 |
| 20 | 105.1 | 105.006193158452 | 0.0938068415484304 |
| 21 | 105.1 | 105.195953923473 | -0.0959539234729413 |
| 22 | 105.2 | 105.332835845600 | -0.132835845599708 |
| 23 | 104.9 | 105.014191305346 | -0.114191305346402 |
| 24 | 104.8 | 104.779987284535 | 0.0200127154652182 |
| 25 | 104.5 | 104.580769275428 | -0.0807692754280743 |
| 26 | 104.5 | 104.474330773686 | 0.0256692263135833 |
| 27 | 104.4 | 104.380965211401 | 0.0190347885987440 |
| 28 | 104.4 | 104.318875022566 | 0.0811249774335682 |
| 29 | 104.2 | 104.253077820331 | -0.0530778203313235 |
| 30 | 104.1 | 104.174206610681 | -0.0742066106810689 |
| 31 | 103.9 | 103.964175116303 | -0.0641751163027591 |
| 32 | 103.8 | 103.967070447466 | -0.167070447465852 |
| 33 | 103.9 | 103.875856909242 | 0.0241430907584613 |
| 34 | 104.2 | 104.113284933038 | 0.086715066961893 |
| 35 | 104.1 | 104.114426143602 | -0.0144261436018154 |
| 36 | 103.8 | 103.976443007382 | -0.17644300738184 |
| 37 | 103.6 | 103.592759953810 | 0.00724004619013386 |
| 38 | 103.7 | 103.640656406459 | 0.059343593540604 |
| 39 | 103.5 | 103.592840711749 | -0.0928407117491103 |
| 40 | 103.4 | 103.400419689951 | -0.000419689951405759 |
| 41 | 103.1 | 103.268445238279 | -0.168445238278550 |
| 42 | 103.1 | 103.063735969874 | 0.0362640301264214 |
| 43 | 103.1 | 103.016707228416 | 0.083292771584335 |
| 44 | 103.2 | 103.276259497012 | -0.0762594970123955 |
| 45 | 103.3 | 103.285451182785 | 0.014548817214944 |
| 46 | 103.5 | 103.446348911358 | 0.0536510886420031 |
| 47 | 103.6 | 103.489189697645 | 0.110810302354604 |
| 48 | 103.5 | 103.388622915250 | 0.111377084750422 |
| 49 | 103.3 | 103.378168166947 | -0.0781681669470875 |
| 50 | 103.2 | 103.225590803564 | -0.0255908035639357 |
| 51 | 103.1 | 103.030669994292 | 0.0693300057084329 |
| 52 | 103.2 | 103.085347909189 | 0.114652090810652 |
| 53 | 103 | 103.055409506017 | -0.0554095060174416 |
| 54 | 103 | 102.990941113626 | 0.00905888637446086 |
| 55 | 103.1 | 103.078269606567 | 0.0217303934326917 |
| 56 | 103.4 | 103.325300976371 | 0.0746990236288304 |
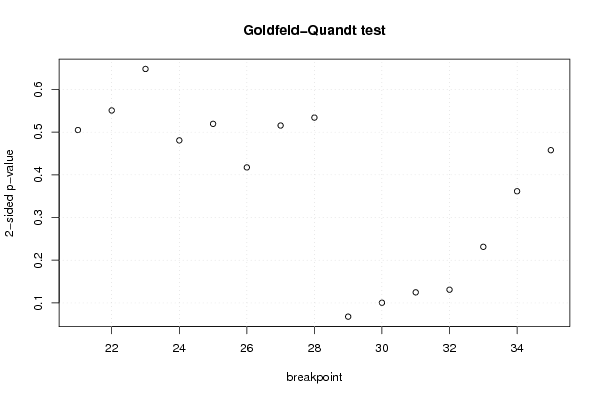
| Goldfeld-Quandt test for Heteroskedasticity | |||
| p-values | Alternative Hypothesis | ||
| breakpoint index | greater | 2-sided | less |
| 21 | 0.747515140273827 | 0.504969719452346 | 0.252484859726173 |
| 22 | 0.724596359982256 | 0.550807280035488 | 0.275403640017744 |
| 23 | 0.675975286593944 | 0.648049426812112 | 0.324024713406056 |
| 24 | 0.759624611212188 | 0.480750777575625 | 0.240375388787812 |
| 25 | 0.74028073563245 | 0.519438528735099 | 0.259719264367549 |
| 26 | 0.791306721315375 | 0.417386557369249 | 0.208693278684625 |
| 27 | 0.742245505581885 | 0.515508988836231 | 0.257754494418115 |
| 28 | 0.732950625853426 | 0.534098748293149 | 0.267049374146574 |
| 29 | 0.966131009154233 | 0.067737981691533 | 0.0338689908457665 |
| 30 | 0.949839455727235 | 0.100321088545529 | 0.0501605442727646 |
| 31 | 0.937656429036802 | 0.124687141926397 | 0.0623435709631984 |
| 32 | 0.934563929953443 | 0.130872140093114 | 0.0654360700465571 |
| 33 | 0.884327938712213 | 0.231344122575574 | 0.115672061287787 |
| 34 | 0.819234270766169 | 0.361531458467662 | 0.180765729233831 |
| 35 | 0.771134674933003 | 0.457730650133994 | 0.228865325066997 |
| Meta Analysis of Goldfeld-Quandt test for Heteroskedasticity | |||
| Description | # significant tests | % significant tests | OK/NOK |
| 1% type I error level | 0 | 0 | OK |
| 5% type I error level | 0 | 0 | OK |
| 10% type I error level | 1 | 0.0666666666666667 | OK |