Free Statistics

of Irreproducible Research!

Author's title

Author*The author of this computation has been verified*
R Software Modulerwasp_multipleregression.wasp
Title produced by softwareMultiple Regression
Date of computationFri, 20 Nov 2009 01:59:37 -0700
Cite this page as followsStatistical Computations at FreeStatistics.org, Office for Research Development and Education, URL https://freestatistics.org/blog/index.php?v=date/2009/Nov/20/t1258707619uoqspu2f9evyo0q.htm/, Retrieved Tue, 16 Apr 2024 20:45:49 +0000
Statistical Computations at FreeStatistics.org, Office for Research Development and Education, URL https://freestatistics.org/blog/index.php?pk=57988, Retrieved Tue, 16 Apr 2024 20:45:49 +0000
QR Codes:

Original text written by user:
IsPrivate?No (this computation is public)
User-defined keywords
Estimated Impact219
Family? (F = Feedback message, R = changed R code, M = changed R Module, P = changed Parameters, D = changed Data)
-     [Multiple Regression] [Q1 The Seatbeltlaw] [2007-11-14 19:27:43] [8cd6641b921d30ebe00b648d1481bba0]
- RMPD  [Multiple Regression] [Seatbelt] [2009-11-12 13:54:52] [b98453cac15ba1066b407e146608df68]
-    D    [Multiple Regression] [model 1] [2009-11-17 14:36:29] [ed603017d2bee8fbd82b6d5ec04e12c3]
-    D      [Multiple Regression] [multiple regression] [2009-11-19 21:38:11] [ed603017d2bee8fbd82b6d5ec04e12c3]
-   P         [Multiple Regression] [monthly dummies] [2009-11-19 22:00:07] [ed603017d2bee8fbd82b6d5ec04e12c3]
-   P           [Multiple Regression] [model3] [2009-11-20 08:47:44] [ed603017d2bee8fbd82b6d5ec04e12c3]
-    D              [Multiple Regression] [model 4] [2009-11-20 08:59:37] [87085ce7f5378f281469a8b1f0969170] [Current]
-    D                [Multiple Regression] [W7: Model 4] [2009-11-22 13:34:45] [03d5b865e91ca35b5a5d21b8d6da5aba]
-    D                  [Multiple Regression] [review 7] [2009-11-24 21:51:11] [309ee52d0058ff0a6f7eec15e07b2d9f]
-    D                [Multiple Regression] [] [2009-11-22 15:02:10] [9f35ad889e41dd0c9322ca60d75b9f47]
-    D                [Multiple Regression] [Beste model] [2009-12-05 15:17:52] [34b80aeb109c116fd63bf2eb7493a276]
Feedback Forum

Post a new message
Dataseries X:
105.8	93.7	105.9	106	106.1	105.7
105.7	104.5	105.8	105.9	106	106.1
105.6	95.4	105.7	105.8	105.9	106
105.4	86.5	105.6	105.7	105.8	105.9
105.4	102.9	105.4	105.6	105.7	105.8
105.5	101.9	105.4	105.4	105.6	105.7
105.6	103.7	105.5	105.4	105.4	105.6
105.7	100.7	105.6	105.5	105.4	105.4
105.9	94.2	105.7	105.6	105.5	105.4
106.1	93.6	105.9	105.7	105.6	105.5
106	104.7	106.1	105.9	105.7	105.6
105.8	101	106	106.1	105.9	105.7
105.8	97.6	105.8	106	106.1	105.9
105.7	105.8	105.8	105.8	106	106.1
105.5	93.7	105.7	105.8	105.8	106
105.3	91.2	105.5	105.7	105.8	105.8
105.2	106.3	105.3	105.5	105.7	105.8
105.2	103.4	105.2	105.3	105.5	105.7
105	107.4	105.2	105.2	105.3	105.5
105.1	101.2	105	105.2	105.2	105.3
105.1	96.9	105.1	105	105.2	105.2
105.2	96.3	105.1	105.1	105	105.2
104.9	109.8	105.2	105.1	105.1	105
104.8	97.9	104.9	105.2	105.1	105.1
104.5	105.1	104.8	104.9	105.2	105.1
104.5	107.9	104.5	104.8	104.9	105.2
104.4	95	104.5	104.5	104.8	104.9
104.4	95.2	104.4	104.5	104.5	104.8
104.2	105.8	104.4	104.4	104.5	104.5
104.1	110.1	104.2	104.4	104.4	104.5
103.9	112.2	104.1	104.2	104.4	104.4
103.8	102.5	103.9	104.1	104.2	104.4
103.9	103.7	103.8	103.9	104.1	104.2
104.2	102	103.9	103.8	103.9	104.1
104.1	112.3	104.2	103.9	103.8	103.9
103.8	103.3	104.1	104.2	103.9	103.8
103.6	106.9	103.8	104.1	104.2	103.9
103.7	104.6	103.6	103.8	104.1	104.2
103.5	100.7	103.7	103.6	103.8	104.1
103.4	99	103.5	103.7	103.6	103.8
103.1	106.5	103.4	103.5	103.7	103.6
103.1	114.9	103.1	103.4	103.5	103.7
103.1	114.1	103.1	103.1	103.4	103.5
103.2	102.2	103.1	103.1	103.1	103.4
103.3	107	103.2	103.1	103.1	103.1
103.5	107.4	103.3	103.2	103.1	103.1
103.6	107.4	103.5	103.3	103.2	103.1
103.5	110.1	103.6	103.5	103.3	103.2
103.3	105.6	103.5	103.6	103.5	103.3
103.2	110.9	103.3	103.5	103.6	103.5
103.1	101.9	103.2	103.3	103.5	103.6
103.2	93.2	103.1	103.2	103.3	103.5
103	110.5	103.2	103.1	103.2	103.3
103	113.1	103	103.2	103.1	103.2
103.1	101.7	103	103	103.2	103.1
103.4	96.7	103.1	103	103	103.2


Summary of computational transaction
Raw Inputview raw input (R code)
Raw Outputview raw output of R engine
Computing time4 seconds
R Server'Gwilym Jenkins' @ 72.249.127.135

\begin{tabular}{lllllllll}
\hline
Summary of computational transaction \tabularnewline
Raw Input & view raw input (R code)  \tabularnewline
Raw Output & view raw output of R engine  \tabularnewline
Computing time & 4 seconds \tabularnewline
R Server & 'Gwilym Jenkins' @ 72.249.127.135 \tabularnewline
\hline
\end{tabular}
%Source: https://freestatistics.org/blog/index.php?pk=57988&T=0

[TABLE]
[ROW][C]Summary of computational transaction[/C][/ROW]
[ROW][C]Raw Input[/C][C]view raw input (R code) [/C][/ROW]
[ROW][C]Raw Output[/C][C]view raw output of R engine [/C][/ROW]
[ROW][C]Computing time[/C][C]4 seconds[/C][/ROW]
[ROW][C]R Server[/C][C]'Gwilym Jenkins' @ 72.249.127.135[/C][/ROW]
[/TABLE]
Source: https://freestatistics.org/blog/index.php?pk=57988&T=0

Globally Unique Identifier (entire table): ba.freestatistics.org/blog/index.php?pk=57988&T=0

As an alternative you can also use a QR Code:  

The GUIDs for individual cells are displayed in the table below:

Summary of computational transaction
Raw Inputview raw input (R code)
Raw Outputview raw output of R engine
Computing time4 seconds
R Server'Gwilym Jenkins' @ 72.249.127.135


Multiple Linear Regression - Estimated Regression Equation
Werkl[t] = + 13.181305483574 -0.0167499771012351Infl[t] + 1.01704809359358`Yt-1`[t] + 0.0183717956239474`Yt-2`[t] -0.304695129059736`Yt-3`[t] + 0.159093233761395`Yt-4`[t] + 0.0623924437488247M1[t] + 0.205812380211141M2[t] -0.0775331339962117M3[t] -0.106742976619106M4[t] + 0.0578994848837974M5[t] + 0.227318039355702M6[t] + 0.177074745524402M7[t] + 0.165127828048767M8[t] + 0.204067321450513M9[t] + 0.271447808716314M10[t] + 0.142836066402679M11[t] -0.00332475677410949t + e[t]

\begin{tabular}{lllllllll}
\hline
Multiple Linear Regression - Estimated Regression Equation \tabularnewline
Werkl[t] =  +  13.181305483574 -0.0167499771012351Infl[t] +  1.01704809359358`Yt-1`[t] +  0.0183717956239474`Yt-2`[t] -0.304695129059736`Yt-3`[t] +  0.159093233761395`Yt-4`[t] +  0.0623924437488247M1[t] +  0.205812380211141M2[t] -0.0775331339962117M3[t] -0.106742976619106M4[t] +  0.0578994848837974M5[t] +  0.227318039355702M6[t] +  0.177074745524402M7[t] +  0.165127828048767M8[t] +  0.204067321450513M9[t] +  0.271447808716314M10[t] +  0.142836066402679M11[t] -0.00332475677410949t  + e[t] \tabularnewline
\hline
\end{tabular}
%Source: https://freestatistics.org/blog/index.php?pk=57988&T=1

[TABLE]
[ROW][C]Multiple Linear Regression - Estimated Regression Equation[/C][/ROW]
[ROW][C]Werkl[t] =  +  13.181305483574 -0.0167499771012351Infl[t] +  1.01704809359358`Yt-1`[t] +  0.0183717956239474`Yt-2`[t] -0.304695129059736`Yt-3`[t] +  0.159093233761395`Yt-4`[t] +  0.0623924437488247M1[t] +  0.205812380211141M2[t] -0.0775331339962117M3[t] -0.106742976619106M4[t] +  0.0578994848837974M5[t] +  0.227318039355702M6[t] +  0.177074745524402M7[t] +  0.165127828048767M8[t] +  0.204067321450513M9[t] +  0.271447808716314M10[t] +  0.142836066402679M11[t] -0.00332475677410949t  + e[t][/C][/ROW]
[/TABLE]
Source: https://freestatistics.org/blog/index.php?pk=57988&T=1

Globally Unique Identifier (entire table): ba.freestatistics.org/blog/index.php?pk=57988&T=1

As an alternative you can also use a QR Code:  

The GUIDs for individual cells are displayed in the table below:

Multiple Linear Regression - Estimated Regression Equation
Werkl[t] = + 13.181305483574 -0.0167499771012351Infl[t] + 1.01704809359358`Yt-1`[t] + 0.0183717956239474`Yt-2`[t] -0.304695129059736`Yt-3`[t] + 0.159093233761395`Yt-4`[t] + 0.0623924437488247M1[t] + 0.205812380211141M2[t] -0.0775331339962117M3[t] -0.106742976619106M4[t] + 0.0578994848837974M5[t] + 0.227318039355702M6[t] + 0.177074745524402M7[t] + 0.165127828048767M8[t] + 0.204067321450513M9[t] + 0.271447808716314M10[t] + 0.142836066402679M11[t] -0.00332475677410949t + e[t]


Multiple Linear Regression - Ordinary Least Squares
VariableParameterS.D.T-STATH0: parameter = 02-tail p-value1-tail p-value
(Intercept)13.1813054835746.7705381.94690.0589710.029485
Infl-0.01674997710123510.004804-3.4870.001250.000625
`Yt-1`1.017048093593580.1515376.711500
`Yt-2`0.01837179562394740.2205220.08330.9340420.467021
`Yt-3`-0.3046951290597360.221958-1.37280.1778750.088938
`Yt-4`0.1590932337613950.1474381.07910.2873660.143683
M10.06239244374882470.0857150.72790.4711320.235566
M20.2058123802111410.0922992.22980.0317430.015871
M3-0.07753313399621170.09766-0.79390.4321770.216089
M4-0.1067429766191060.100624-1.06080.2954730.147736
M50.05789948488379740.0890240.65040.5193610.25968
M60.2273180393557020.0890782.55190.0148580.007429
M70.1770747455244020.0951331.86130.0704440.035222
M80.1651278280487670.0870821.89620.0655520.032776
M90.2040673214505130.0900572.2660.0292320.014616
M100.2714478087163140.0876153.09820.0036530.001827
M110.1428360664026790.0932641.53150.1339250.066962
t-0.003324756774109490.003697-0.89930.3741740.187087

\begin{tabular}{lllllllll}
\hline
Multiple Linear Regression - Ordinary Least Squares \tabularnewline
Variable & Parameter & S.D. & T-STATH0: parameter = 0 & 2-tail p-value & 1-tail p-value \tabularnewline
(Intercept) & 13.181305483574 & 6.770538 & 1.9469 & 0.058971 & 0.029485 \tabularnewline
Infl & -0.0167499771012351 & 0.004804 & -3.487 & 0.00125 & 0.000625 \tabularnewline
`Yt-1` & 1.01704809359358 & 0.151537 & 6.7115 & 0 & 0 \tabularnewline
`Yt-2` & 0.0183717956239474 & 0.220522 & 0.0833 & 0.934042 & 0.467021 \tabularnewline
`Yt-3` & -0.304695129059736 & 0.221958 & -1.3728 & 0.177875 & 0.088938 \tabularnewline
`Yt-4` & 0.159093233761395 & 0.147438 & 1.0791 & 0.287366 & 0.143683 \tabularnewline
M1 & 0.0623924437488247 & 0.085715 & 0.7279 & 0.471132 & 0.235566 \tabularnewline
M2 & 0.205812380211141 & 0.092299 & 2.2298 & 0.031743 & 0.015871 \tabularnewline
M3 & -0.0775331339962117 & 0.09766 & -0.7939 & 0.432177 & 0.216089 \tabularnewline
M4 & -0.106742976619106 & 0.100624 & -1.0608 & 0.295473 & 0.147736 \tabularnewline
M5 & 0.0578994848837974 & 0.089024 & 0.6504 & 0.519361 & 0.25968 \tabularnewline
M6 & 0.227318039355702 & 0.089078 & 2.5519 & 0.014858 & 0.007429 \tabularnewline
M7 & 0.177074745524402 & 0.095133 & 1.8613 & 0.070444 & 0.035222 \tabularnewline
M8 & 0.165127828048767 & 0.087082 & 1.8962 & 0.065552 & 0.032776 \tabularnewline
M9 & 0.204067321450513 & 0.090057 & 2.266 & 0.029232 & 0.014616 \tabularnewline
M10 & 0.271447808716314 & 0.087615 & 3.0982 & 0.003653 & 0.001827 \tabularnewline
M11 & 0.142836066402679 & 0.093264 & 1.5315 & 0.133925 & 0.066962 \tabularnewline
t & -0.00332475677410949 & 0.003697 & -0.8993 & 0.374174 & 0.187087 \tabularnewline
\hline
\end{tabular}
%Source: https://freestatistics.org/blog/index.php?pk=57988&T=2

[TABLE]
[ROW][C]Multiple Linear Regression - Ordinary Least Squares[/C][/ROW]
[ROW][C]Variable[/C][C]Parameter[/C][C]S.D.[/C][C]T-STATH0: parameter = 0[/C][C]2-tail p-value[/C][C]1-tail p-value[/C][/ROW]
[ROW][C](Intercept)[/C][C]13.181305483574[/C][C]6.770538[/C][C]1.9469[/C][C]0.058971[/C][C]0.029485[/C][/ROW]
[ROW][C]Infl[/C][C]-0.0167499771012351[/C][C]0.004804[/C][C]-3.487[/C][C]0.00125[/C][C]0.000625[/C][/ROW]
[ROW][C]`Yt-1`[/C][C]1.01704809359358[/C][C]0.151537[/C][C]6.7115[/C][C]0[/C][C]0[/C][/ROW]
[ROW][C]`Yt-2`[/C][C]0.0183717956239474[/C][C]0.220522[/C][C]0.0833[/C][C]0.934042[/C][C]0.467021[/C][/ROW]
[ROW][C]`Yt-3`[/C][C]-0.304695129059736[/C][C]0.221958[/C][C]-1.3728[/C][C]0.177875[/C][C]0.088938[/C][/ROW]
[ROW][C]`Yt-4`[/C][C]0.159093233761395[/C][C]0.147438[/C][C]1.0791[/C][C]0.287366[/C][C]0.143683[/C][/ROW]
[ROW][C]M1[/C][C]0.0623924437488247[/C][C]0.085715[/C][C]0.7279[/C][C]0.471132[/C][C]0.235566[/C][/ROW]
[ROW][C]M2[/C][C]0.205812380211141[/C][C]0.092299[/C][C]2.2298[/C][C]0.031743[/C][C]0.015871[/C][/ROW]
[ROW][C]M3[/C][C]-0.0775331339962117[/C][C]0.09766[/C][C]-0.7939[/C][C]0.432177[/C][C]0.216089[/C][/ROW]
[ROW][C]M4[/C][C]-0.106742976619106[/C][C]0.100624[/C][C]-1.0608[/C][C]0.295473[/C][C]0.147736[/C][/ROW]
[ROW][C]M5[/C][C]0.0578994848837974[/C][C]0.089024[/C][C]0.6504[/C][C]0.519361[/C][C]0.25968[/C][/ROW]
[ROW][C]M6[/C][C]0.227318039355702[/C][C]0.089078[/C][C]2.5519[/C][C]0.014858[/C][C]0.007429[/C][/ROW]
[ROW][C]M7[/C][C]0.177074745524402[/C][C]0.095133[/C][C]1.8613[/C][C]0.070444[/C][C]0.035222[/C][/ROW]
[ROW][C]M8[/C][C]0.165127828048767[/C][C]0.087082[/C][C]1.8962[/C][C]0.065552[/C][C]0.032776[/C][/ROW]
[ROW][C]M9[/C][C]0.204067321450513[/C][C]0.090057[/C][C]2.266[/C][C]0.029232[/C][C]0.014616[/C][/ROW]
[ROW][C]M10[/C][C]0.271447808716314[/C][C]0.087615[/C][C]3.0982[/C][C]0.003653[/C][C]0.001827[/C][/ROW]
[ROW][C]M11[/C][C]0.142836066402679[/C][C]0.093264[/C][C]1.5315[/C][C]0.133925[/C][C]0.066962[/C][/ROW]
[ROW][C]t[/C][C]-0.00332475677410949[/C][C]0.003697[/C][C]-0.8993[/C][C]0.374174[/C][C]0.187087[/C][/ROW]
[/TABLE]
Source: https://freestatistics.org/blog/index.php?pk=57988&T=2

Globally Unique Identifier (entire table): ba.freestatistics.org/blog/index.php?pk=57988&T=2

As an alternative you can also use a QR Code:  

The GUIDs for individual cells are displayed in the table below:

Multiple Linear Regression - Ordinary Least Squares
VariableParameterS.D.T-STATH0: parameter = 02-tail p-value1-tail p-value
(Intercept)13.1813054835746.7705381.94690.0589710.029485
Infl-0.01674997710123510.004804-3.4870.001250.000625
`Yt-1`1.017048093593580.1515376.711500
`Yt-2`0.01837179562394740.2205220.08330.9340420.467021
`Yt-3`-0.3046951290597360.221958-1.37280.1778750.088938
`Yt-4`0.1590932337613950.1474381.07910.2873660.143683
M10.06239244374882470.0857150.72790.4711320.235566
M20.2058123802111410.0922992.22980.0317430.015871
M3-0.07753313399621170.09766-0.79390.4321770.216089
M4-0.1067429766191060.100624-1.06080.2954730.147736
M50.05789948488379740.0890240.65040.5193610.25968
M60.2273180393557020.0890782.55190.0148580.007429
M70.1770747455244020.0951331.86130.0704440.035222
M80.1651278280487670.0870821.89620.0655520.032776
M90.2040673214505130.0900572.2660.0292320.014616
M100.2714478087163140.0876153.09820.0036530.001827
M110.1428360664026790.0932641.53150.1339250.066962
t-0.003324756774109490.003697-0.89930.3741740.187087


Multiple Linear Regression - Regression Statistics
Multiple R0.996509035112443
R-squared0.993030257060732
Adjusted R-squared0.989912214166848
F-TEST (value)318.478703102129
F-TEST (DF numerator)17
F-TEST (DF denominator)38
p-value0
Multiple Linear Regression - Residual Statistics
Residual Standard Deviation0.102457087339735
Sum Squared Residuals0.398903280353396

\begin{tabular}{lllllllll}
\hline
Multiple Linear Regression - Regression Statistics \tabularnewline
Multiple R & 0.996509035112443 \tabularnewline
R-squared & 0.993030257060732 \tabularnewline
Adjusted R-squared & 0.989912214166848 \tabularnewline
F-TEST (value) & 318.478703102129 \tabularnewline
F-TEST (DF numerator) & 17 \tabularnewline
F-TEST (DF denominator) & 38 \tabularnewline
p-value & 0 \tabularnewline
Multiple Linear Regression - Residual Statistics \tabularnewline
Residual Standard Deviation & 0.102457087339735 \tabularnewline
Sum Squared Residuals & 0.398903280353396 \tabularnewline
\hline
\end{tabular}
%Source: https://freestatistics.org/blog/index.php?pk=57988&T=3

[TABLE]
[ROW][C]Multiple Linear Regression - Regression Statistics[/C][/ROW]
[ROW][C]Multiple R[/C][C]0.996509035112443[/C][/ROW]
[ROW][C]R-squared[/C][C]0.993030257060732[/C][/ROW]
[ROW][C]Adjusted R-squared[/C][C]0.989912214166848[/C][/ROW]
[ROW][C]F-TEST (value)[/C][C]318.478703102129[/C][/ROW]
[ROW][C]F-TEST (DF numerator)[/C][C]17[/C][/ROW]
[ROW][C]F-TEST (DF denominator)[/C][C]38[/C][/ROW]
[ROW][C]p-value[/C][C]0[/C][/ROW]
[ROW][C]Multiple Linear Regression - Residual Statistics[/C][/ROW]
[ROW][C]Residual Standard Deviation[/C][C]0.102457087339735[/C][/ROW]
[ROW][C]Sum Squared Residuals[/C][C]0.398903280353396[/C][/ROW]
[/TABLE]
Source: https://freestatistics.org/blog/index.php?pk=57988&T=3

Globally Unique Identifier (entire table): ba.freestatistics.org/blog/index.php?pk=57988&T=3

As an alternative you can also use a QR Code:  

The GUIDs for individual cells are displayed in the table below:

Multiple Linear Regression - Regression Statistics
Multiple R0.996509035112443
R-squared0.993030257060732
Adjusted R-squared0.989912214166848
F-TEST (value)318.478703102129
F-TEST (DF numerator)17
F-TEST (DF denominator)38
p-value0
Multiple Linear Regression - Residual Statistics
Residual Standard Deviation0.102457087339735
Sum Squared Residuals0.398903280353396


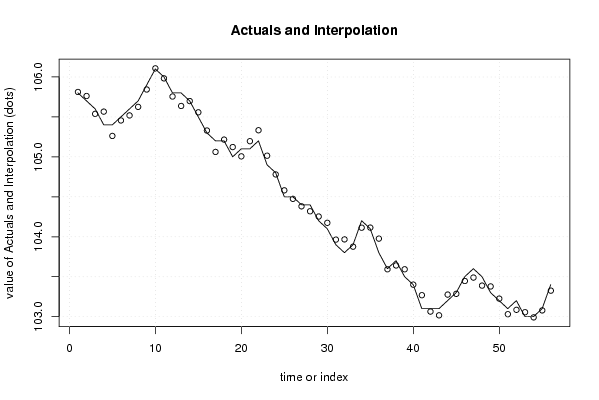
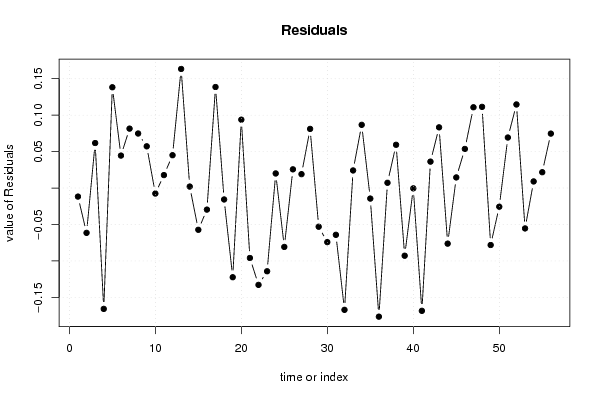
Multiple Linear Regression - Actuals, Interpolation, and Residuals
Time or IndexActualsInterpolationForecastResidualsPrediction Error
1105.8105.811705379203-0.0117053792030353
2105.7105.761465623687-0.0614656236867831
3105.6105.5382383449350.0617616550653452
4105.4105.565796742347-0.165796742346709
5105.4105.2617282138640.138271786136022
6105.5105.4554578190680.0445421809319375
7105.6105.5184743214760.0815256785244096
8105.7105.6251759206990.074824079300987
9105.9105.8427379845000.057262015499536
10106.1106.107530310004-0.00753031000418853
11106105.9821928534060.0178071465936141
12105.8105.7549467928340.0450532071662002
13105.8105.6365972246120.163402775388063
14105.7105.6979563926030.00204360739653135
15105.5105.557285737623-0.057285737623412
16105.3105.329560635946-0.0295606359461054
17105.2105.0613392215090.138660778491294
18105.2105.215658486752-0.0156584867517507
19105105.122373727239-0.122373727238677
20105.1105.0061931584520.0938068415484304
21105.1105.195953923473-0.0959539234729413
22105.2105.332835845600-0.132835845599708
23104.9105.014191305346-0.114191305346402
24104.8104.7799872845350.0200127154652182
25104.5104.580769275428-0.0807692754280743
26104.5104.4743307736860.0256692263135833
27104.4104.3809652114010.0190347885987440
28104.4104.3188750225660.0811249774335682
29104.2104.253077820331-0.0530778203313235
30104.1104.174206610681-0.0742066106810689
31103.9103.964175116303-0.0641751163027591
32103.8103.967070447466-0.167070447465852
33103.9103.8758569092420.0241430907584613
34104.2104.1132849330380.086715066961893
35104.1104.114426143602-0.0144261436018154
36103.8103.976443007382-0.17644300738184
37103.6103.5927599538100.00724004619013386
38103.7103.6406564064590.059343593540604
39103.5103.592840711749-0.0928407117491103
40103.4103.400419689951-0.000419689951405759
41103.1103.268445238279-0.168445238278550
42103.1103.0637359698740.0362640301264214
43103.1103.0167072284160.083292771584335
44103.2103.276259497012-0.0762594970123955
45103.3103.2854511827850.014548817214944
46103.5103.4463489113580.0536510886420031
47103.6103.4891896976450.110810302354604
48103.5103.3886229152500.111377084750422
49103.3103.378168166947-0.0781681669470875
50103.2103.225590803564-0.0255908035639357
51103.1103.0306699942920.0693300057084329
52103.2103.0853479091890.114652090810652
53103103.055409506017-0.0554095060174416
54103102.9909411136260.00905888637446086
55103.1103.0782696065670.0217303934326917
56103.4103.3253009763710.0746990236288304

\begin{tabular}{lllllllll}
\hline
Multiple Linear Regression - Actuals, Interpolation, and Residuals \tabularnewline
Time or Index & Actuals & InterpolationForecast & ResidualsPrediction Error \tabularnewline
1 & 105.8 & 105.811705379203 & -0.0117053792030353 \tabularnewline
2 & 105.7 & 105.761465623687 & -0.0614656236867831 \tabularnewline
3 & 105.6 & 105.538238344935 & 0.0617616550653452 \tabularnewline
4 & 105.4 & 105.565796742347 & -0.165796742346709 \tabularnewline
5 & 105.4 & 105.261728213864 & 0.138271786136022 \tabularnewline
6 & 105.5 & 105.455457819068 & 0.0445421809319375 \tabularnewline
7 & 105.6 & 105.518474321476 & 0.0815256785244096 \tabularnewline
8 & 105.7 & 105.625175920699 & 0.074824079300987 \tabularnewline
9 & 105.9 & 105.842737984500 & 0.057262015499536 \tabularnewline
10 & 106.1 & 106.107530310004 & -0.00753031000418853 \tabularnewline
11 & 106 & 105.982192853406 & 0.0178071465936141 \tabularnewline
12 & 105.8 & 105.754946792834 & 0.0450532071662002 \tabularnewline
13 & 105.8 & 105.636597224612 & 0.163402775388063 \tabularnewline
14 & 105.7 & 105.697956392603 & 0.00204360739653135 \tabularnewline
15 & 105.5 & 105.557285737623 & -0.057285737623412 \tabularnewline
16 & 105.3 & 105.329560635946 & -0.0295606359461054 \tabularnewline
17 & 105.2 & 105.061339221509 & 0.138660778491294 \tabularnewline
18 & 105.2 & 105.215658486752 & -0.0156584867517507 \tabularnewline
19 & 105 & 105.122373727239 & -0.122373727238677 \tabularnewline
20 & 105.1 & 105.006193158452 & 0.0938068415484304 \tabularnewline
21 & 105.1 & 105.195953923473 & -0.0959539234729413 \tabularnewline
22 & 105.2 & 105.332835845600 & -0.132835845599708 \tabularnewline
23 & 104.9 & 105.014191305346 & -0.114191305346402 \tabularnewline
24 & 104.8 & 104.779987284535 & 0.0200127154652182 \tabularnewline
25 & 104.5 & 104.580769275428 & -0.0807692754280743 \tabularnewline
26 & 104.5 & 104.474330773686 & 0.0256692263135833 \tabularnewline
27 & 104.4 & 104.380965211401 & 0.0190347885987440 \tabularnewline
28 & 104.4 & 104.318875022566 & 0.0811249774335682 \tabularnewline
29 & 104.2 & 104.253077820331 & -0.0530778203313235 \tabularnewline
30 & 104.1 & 104.174206610681 & -0.0742066106810689 \tabularnewline
31 & 103.9 & 103.964175116303 & -0.0641751163027591 \tabularnewline
32 & 103.8 & 103.967070447466 & -0.167070447465852 \tabularnewline
33 & 103.9 & 103.875856909242 & 0.0241430907584613 \tabularnewline
34 & 104.2 & 104.113284933038 & 0.086715066961893 \tabularnewline
35 & 104.1 & 104.114426143602 & -0.0144261436018154 \tabularnewline
36 & 103.8 & 103.976443007382 & -0.17644300738184 \tabularnewline
37 & 103.6 & 103.592759953810 & 0.00724004619013386 \tabularnewline
38 & 103.7 & 103.640656406459 & 0.059343593540604 \tabularnewline
39 & 103.5 & 103.592840711749 & -0.0928407117491103 \tabularnewline
40 & 103.4 & 103.400419689951 & -0.000419689951405759 \tabularnewline
41 & 103.1 & 103.268445238279 & -0.168445238278550 \tabularnewline
42 & 103.1 & 103.063735969874 & 0.0362640301264214 \tabularnewline
43 & 103.1 & 103.016707228416 & 0.083292771584335 \tabularnewline
44 & 103.2 & 103.276259497012 & -0.0762594970123955 \tabularnewline
45 & 103.3 & 103.285451182785 & 0.014548817214944 \tabularnewline
46 & 103.5 & 103.446348911358 & 0.0536510886420031 \tabularnewline
47 & 103.6 & 103.489189697645 & 0.110810302354604 \tabularnewline
48 & 103.5 & 103.388622915250 & 0.111377084750422 \tabularnewline
49 & 103.3 & 103.378168166947 & -0.0781681669470875 \tabularnewline
50 & 103.2 & 103.225590803564 & -0.0255908035639357 \tabularnewline
51 & 103.1 & 103.030669994292 & 0.0693300057084329 \tabularnewline
52 & 103.2 & 103.085347909189 & 0.114652090810652 \tabularnewline
53 & 103 & 103.055409506017 & -0.0554095060174416 \tabularnewline
54 & 103 & 102.990941113626 & 0.00905888637446086 \tabularnewline
55 & 103.1 & 103.078269606567 & 0.0217303934326917 \tabularnewline
56 & 103.4 & 103.325300976371 & 0.0746990236288304 \tabularnewline
\hline
\end{tabular}
%Source: https://freestatistics.org/blog/index.php?pk=57988&T=4

[TABLE]
[ROW][C]Multiple Linear Regression - Actuals, Interpolation, and Residuals[/C][/ROW]
[ROW][C]Time or Index[/C][C]Actuals[/C][C]InterpolationForecast[/C][C]ResidualsPrediction Error[/C][/ROW]
[ROW][C]1[/C][C]105.8[/C][C]105.811705379203[/C][C]-0.0117053792030353[/C][/ROW]
[ROW][C]2[/C][C]105.7[/C][C]105.761465623687[/C][C]-0.0614656236867831[/C][/ROW]
[ROW][C]3[/C][C]105.6[/C][C]105.538238344935[/C][C]0.0617616550653452[/C][/ROW]
[ROW][C]4[/C][C]105.4[/C][C]105.565796742347[/C][C]-0.165796742346709[/C][/ROW]
[ROW][C]5[/C][C]105.4[/C][C]105.261728213864[/C][C]0.138271786136022[/C][/ROW]
[ROW][C]6[/C][C]105.5[/C][C]105.455457819068[/C][C]0.0445421809319375[/C][/ROW]
[ROW][C]7[/C][C]105.6[/C][C]105.518474321476[/C][C]0.0815256785244096[/C][/ROW]
[ROW][C]8[/C][C]105.7[/C][C]105.625175920699[/C][C]0.074824079300987[/C][/ROW]
[ROW][C]9[/C][C]105.9[/C][C]105.842737984500[/C][C]0.057262015499536[/C][/ROW]
[ROW][C]10[/C][C]106.1[/C][C]106.107530310004[/C][C]-0.00753031000418853[/C][/ROW]
[ROW][C]11[/C][C]106[/C][C]105.982192853406[/C][C]0.0178071465936141[/C][/ROW]
[ROW][C]12[/C][C]105.8[/C][C]105.754946792834[/C][C]0.0450532071662002[/C][/ROW]
[ROW][C]13[/C][C]105.8[/C][C]105.636597224612[/C][C]0.163402775388063[/C][/ROW]
[ROW][C]14[/C][C]105.7[/C][C]105.697956392603[/C][C]0.00204360739653135[/C][/ROW]
[ROW][C]15[/C][C]105.5[/C][C]105.557285737623[/C][C]-0.057285737623412[/C][/ROW]
[ROW][C]16[/C][C]105.3[/C][C]105.329560635946[/C][C]-0.0295606359461054[/C][/ROW]
[ROW][C]17[/C][C]105.2[/C][C]105.061339221509[/C][C]0.138660778491294[/C][/ROW]
[ROW][C]18[/C][C]105.2[/C][C]105.215658486752[/C][C]-0.0156584867517507[/C][/ROW]
[ROW][C]19[/C][C]105[/C][C]105.122373727239[/C][C]-0.122373727238677[/C][/ROW]
[ROW][C]20[/C][C]105.1[/C][C]105.006193158452[/C][C]0.0938068415484304[/C][/ROW]
[ROW][C]21[/C][C]105.1[/C][C]105.195953923473[/C][C]-0.0959539234729413[/C][/ROW]
[ROW][C]22[/C][C]105.2[/C][C]105.332835845600[/C][C]-0.132835845599708[/C][/ROW]
[ROW][C]23[/C][C]104.9[/C][C]105.014191305346[/C][C]-0.114191305346402[/C][/ROW]
[ROW][C]24[/C][C]104.8[/C][C]104.779987284535[/C][C]0.0200127154652182[/C][/ROW]
[ROW][C]25[/C][C]104.5[/C][C]104.580769275428[/C][C]-0.0807692754280743[/C][/ROW]
[ROW][C]26[/C][C]104.5[/C][C]104.474330773686[/C][C]0.0256692263135833[/C][/ROW]
[ROW][C]27[/C][C]104.4[/C][C]104.380965211401[/C][C]0.0190347885987440[/C][/ROW]
[ROW][C]28[/C][C]104.4[/C][C]104.318875022566[/C][C]0.0811249774335682[/C][/ROW]
[ROW][C]29[/C][C]104.2[/C][C]104.253077820331[/C][C]-0.0530778203313235[/C][/ROW]
[ROW][C]30[/C][C]104.1[/C][C]104.174206610681[/C][C]-0.0742066106810689[/C][/ROW]
[ROW][C]31[/C][C]103.9[/C][C]103.964175116303[/C][C]-0.0641751163027591[/C][/ROW]
[ROW][C]32[/C][C]103.8[/C][C]103.967070447466[/C][C]-0.167070447465852[/C][/ROW]
[ROW][C]33[/C][C]103.9[/C][C]103.875856909242[/C][C]0.0241430907584613[/C][/ROW]
[ROW][C]34[/C][C]104.2[/C][C]104.113284933038[/C][C]0.086715066961893[/C][/ROW]
[ROW][C]35[/C][C]104.1[/C][C]104.114426143602[/C][C]-0.0144261436018154[/C][/ROW]
[ROW][C]36[/C][C]103.8[/C][C]103.976443007382[/C][C]-0.17644300738184[/C][/ROW]
[ROW][C]37[/C][C]103.6[/C][C]103.592759953810[/C][C]0.00724004619013386[/C][/ROW]
[ROW][C]38[/C][C]103.7[/C][C]103.640656406459[/C][C]0.059343593540604[/C][/ROW]
[ROW][C]39[/C][C]103.5[/C][C]103.592840711749[/C][C]-0.0928407117491103[/C][/ROW]
[ROW][C]40[/C][C]103.4[/C][C]103.400419689951[/C][C]-0.000419689951405759[/C][/ROW]
[ROW][C]41[/C][C]103.1[/C][C]103.268445238279[/C][C]-0.168445238278550[/C][/ROW]
[ROW][C]42[/C][C]103.1[/C][C]103.063735969874[/C][C]0.0362640301264214[/C][/ROW]
[ROW][C]43[/C][C]103.1[/C][C]103.016707228416[/C][C]0.083292771584335[/C][/ROW]
[ROW][C]44[/C][C]103.2[/C][C]103.276259497012[/C][C]-0.0762594970123955[/C][/ROW]
[ROW][C]45[/C][C]103.3[/C][C]103.285451182785[/C][C]0.014548817214944[/C][/ROW]
[ROW][C]46[/C][C]103.5[/C][C]103.446348911358[/C][C]0.0536510886420031[/C][/ROW]
[ROW][C]47[/C][C]103.6[/C][C]103.489189697645[/C][C]0.110810302354604[/C][/ROW]
[ROW][C]48[/C][C]103.5[/C][C]103.388622915250[/C][C]0.111377084750422[/C][/ROW]
[ROW][C]49[/C][C]103.3[/C][C]103.378168166947[/C][C]-0.0781681669470875[/C][/ROW]
[ROW][C]50[/C][C]103.2[/C][C]103.225590803564[/C][C]-0.0255908035639357[/C][/ROW]
[ROW][C]51[/C][C]103.1[/C][C]103.030669994292[/C][C]0.0693300057084329[/C][/ROW]
[ROW][C]52[/C][C]103.2[/C][C]103.085347909189[/C][C]0.114652090810652[/C][/ROW]
[ROW][C]53[/C][C]103[/C][C]103.055409506017[/C][C]-0.0554095060174416[/C][/ROW]
[ROW][C]54[/C][C]103[/C][C]102.990941113626[/C][C]0.00905888637446086[/C][/ROW]
[ROW][C]55[/C][C]103.1[/C][C]103.078269606567[/C][C]0.0217303934326917[/C][/ROW]
[ROW][C]56[/C][C]103.4[/C][C]103.325300976371[/C][C]0.0746990236288304[/C][/ROW]
[/TABLE]
Source: https://freestatistics.org/blog/index.php?pk=57988&T=4

Globally Unique Identifier (entire table): ba.freestatistics.org/blog/index.php?pk=57988&T=4

As an alternative you can also use a QR Code:  

The GUIDs for individual cells are displayed in the table below:

Multiple Linear Regression - Actuals, Interpolation, and Residuals
Time or IndexActualsInterpolationForecastResidualsPrediction Error
1105.8105.811705379203-0.0117053792030353
2105.7105.761465623687-0.0614656236867831
3105.6105.5382383449350.0617616550653452
4105.4105.565796742347-0.165796742346709
5105.4105.2617282138640.138271786136022
6105.5105.4554578190680.0445421809319375
7105.6105.5184743214760.0815256785244096
8105.7105.6251759206990.074824079300987
9105.9105.8427379845000.057262015499536
10106.1106.107530310004-0.00753031000418853
11106105.9821928534060.0178071465936141
12105.8105.7549467928340.0450532071662002
13105.8105.6365972246120.163402775388063
14105.7105.6979563926030.00204360739653135
15105.5105.557285737623-0.057285737623412
16105.3105.329560635946-0.0295606359461054
17105.2105.0613392215090.138660778491294
18105.2105.215658486752-0.0156584867517507
19105105.122373727239-0.122373727238677
20105.1105.0061931584520.0938068415484304
21105.1105.195953923473-0.0959539234729413
22105.2105.332835845600-0.132835845599708
23104.9105.014191305346-0.114191305346402
24104.8104.7799872845350.0200127154652182
25104.5104.580769275428-0.0807692754280743
26104.5104.4743307736860.0256692263135833
27104.4104.3809652114010.0190347885987440
28104.4104.3188750225660.0811249774335682
29104.2104.253077820331-0.0530778203313235
30104.1104.174206610681-0.0742066106810689
31103.9103.964175116303-0.0641751163027591
32103.8103.967070447466-0.167070447465852
33103.9103.8758569092420.0241430907584613
34104.2104.1132849330380.086715066961893
35104.1104.114426143602-0.0144261436018154
36103.8103.976443007382-0.17644300738184
37103.6103.5927599538100.00724004619013386
38103.7103.6406564064590.059343593540604
39103.5103.592840711749-0.0928407117491103
40103.4103.400419689951-0.000419689951405759
41103.1103.268445238279-0.168445238278550
42103.1103.0637359698740.0362640301264214
43103.1103.0167072284160.083292771584335
44103.2103.276259497012-0.0762594970123955
45103.3103.2854511827850.014548817214944
46103.5103.4463489113580.0536510886420031
47103.6103.4891896976450.110810302354604
48103.5103.3886229152500.111377084750422
49103.3103.378168166947-0.0781681669470875
50103.2103.225590803564-0.0255908035639357
51103.1103.0306699942920.0693300057084329
52103.2103.0853479091890.114652090810652
53103103.055409506017-0.0554095060174416
54103102.9909411136260.00905888637446086
55103.1103.0782696065670.0217303934326917
56103.4103.3253009763710.0746990236288304


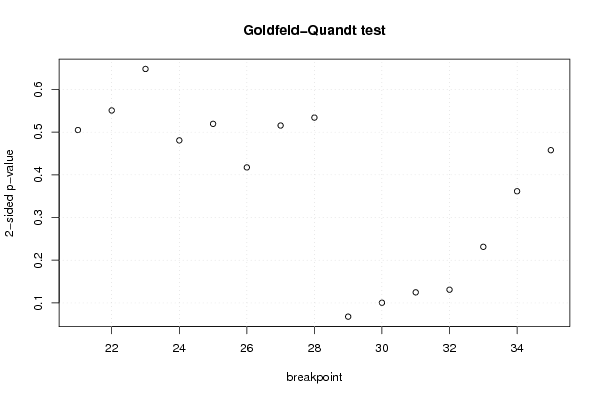
Goldfeld-Quandt test for Heteroskedasticity
p-valuesAlternative Hypothesis
breakpoint indexgreater2-sidedless
210.7475151402738270.5049697194523460.252484859726173
220.7245963599822560.5508072800354880.275403640017744
230.6759752865939440.6480494268121120.324024713406056
240.7596246112121880.4807507775756250.240375388787812
250.740280735632450.5194385287350990.259719264367549
260.7913067213153750.4173865573692490.208693278684625
270.7422455055818850.5155089888362310.257754494418115
280.7329506258534260.5340987482931490.267049374146574
290.9661310091542330.0677379816915330.0338689908457665
300.9498394557272350.1003210885455290.0501605442727646
310.9376564290368020.1246871419263970.0623435709631984
320.9345639299534430.1308721400931140.0654360700465571
330.8843279387122130.2313441225755740.115672061287787
340.8192342707661690.3615314584676620.180765729233831
350.7711346749330030.4577306501339940.228865325066997

\begin{tabular}{lllllllll}
\hline
Goldfeld-Quandt test for Heteroskedasticity \tabularnewline
p-values & Alternative Hypothesis \tabularnewline
breakpoint index & greater & 2-sided & less \tabularnewline
21 & 0.747515140273827 & 0.504969719452346 & 0.252484859726173 \tabularnewline
22 & 0.724596359982256 & 0.550807280035488 & 0.275403640017744 \tabularnewline
23 & 0.675975286593944 & 0.648049426812112 & 0.324024713406056 \tabularnewline
24 & 0.759624611212188 & 0.480750777575625 & 0.240375388787812 \tabularnewline
25 & 0.74028073563245 & 0.519438528735099 & 0.259719264367549 \tabularnewline
26 & 0.791306721315375 & 0.417386557369249 & 0.208693278684625 \tabularnewline
27 & 0.742245505581885 & 0.515508988836231 & 0.257754494418115 \tabularnewline
28 & 0.732950625853426 & 0.534098748293149 & 0.267049374146574 \tabularnewline
29 & 0.966131009154233 & 0.067737981691533 & 0.0338689908457665 \tabularnewline
30 & 0.949839455727235 & 0.100321088545529 & 0.0501605442727646 \tabularnewline
31 & 0.937656429036802 & 0.124687141926397 & 0.0623435709631984 \tabularnewline
32 & 0.934563929953443 & 0.130872140093114 & 0.0654360700465571 \tabularnewline
33 & 0.884327938712213 & 0.231344122575574 & 0.115672061287787 \tabularnewline
34 & 0.819234270766169 & 0.361531458467662 & 0.180765729233831 \tabularnewline
35 & 0.771134674933003 & 0.457730650133994 & 0.228865325066997 \tabularnewline
\hline
\end{tabular}
%Source: https://freestatistics.org/blog/index.php?pk=57988&T=5

[TABLE]
[ROW][C]Goldfeld-Quandt test for Heteroskedasticity[/C][/ROW]
[ROW][C]p-values[/C][C]Alternative Hypothesis[/C][/ROW]
[ROW][C]breakpoint index[/C][C]greater[/C][C]2-sided[/C][C]less[/C][/ROW]
[ROW][C]21[/C][C]0.747515140273827[/C][C]0.504969719452346[/C][C]0.252484859726173[/C][/ROW]
[ROW][C]22[/C][C]0.724596359982256[/C][C]0.550807280035488[/C][C]0.275403640017744[/C][/ROW]
[ROW][C]23[/C][C]0.675975286593944[/C][C]0.648049426812112[/C][C]0.324024713406056[/C][/ROW]
[ROW][C]24[/C][C]0.759624611212188[/C][C]0.480750777575625[/C][C]0.240375388787812[/C][/ROW]
[ROW][C]25[/C][C]0.74028073563245[/C][C]0.519438528735099[/C][C]0.259719264367549[/C][/ROW]
[ROW][C]26[/C][C]0.791306721315375[/C][C]0.417386557369249[/C][C]0.208693278684625[/C][/ROW]
[ROW][C]27[/C][C]0.742245505581885[/C][C]0.515508988836231[/C][C]0.257754494418115[/C][/ROW]
[ROW][C]28[/C][C]0.732950625853426[/C][C]0.534098748293149[/C][C]0.267049374146574[/C][/ROW]
[ROW][C]29[/C][C]0.966131009154233[/C][C]0.067737981691533[/C][C]0.0338689908457665[/C][/ROW]
[ROW][C]30[/C][C]0.949839455727235[/C][C]0.100321088545529[/C][C]0.0501605442727646[/C][/ROW]
[ROW][C]31[/C][C]0.937656429036802[/C][C]0.124687141926397[/C][C]0.0623435709631984[/C][/ROW]
[ROW][C]32[/C][C]0.934563929953443[/C][C]0.130872140093114[/C][C]0.0654360700465571[/C][/ROW]
[ROW][C]33[/C][C]0.884327938712213[/C][C]0.231344122575574[/C][C]0.115672061287787[/C][/ROW]
[ROW][C]34[/C][C]0.819234270766169[/C][C]0.361531458467662[/C][C]0.180765729233831[/C][/ROW]
[ROW][C]35[/C][C]0.771134674933003[/C][C]0.457730650133994[/C][C]0.228865325066997[/C][/ROW]
[/TABLE]
Source: https://freestatistics.org/blog/index.php?pk=57988&T=5

Globally Unique Identifier (entire table): ba.freestatistics.org/blog/index.php?pk=57988&T=5

As an alternative you can also use a QR Code:  

The GUIDs for individual cells are displayed in the table below:

Goldfeld-Quandt test for Heteroskedasticity
p-valuesAlternative Hypothesis
breakpoint indexgreater2-sidedless
210.7475151402738270.5049697194523460.252484859726173
220.7245963599822560.5508072800354880.275403640017744
230.6759752865939440.6480494268121120.324024713406056
240.7596246112121880.4807507775756250.240375388787812
250.740280735632450.5194385287350990.259719264367549
260.7913067213153750.4173865573692490.208693278684625
270.7422455055818850.5155089888362310.257754494418115
280.7329506258534260.5340987482931490.267049374146574
290.9661310091542330.0677379816915330.0338689908457665
300.9498394557272350.1003210885455290.0501605442727646
310.9376564290368020.1246871419263970.0623435709631984
320.9345639299534430.1308721400931140.0654360700465571
330.8843279387122130.2313441225755740.115672061287787
340.8192342707661690.3615314584676620.180765729233831
350.7711346749330030.4577306501339940.228865325066997


Meta Analysis of Goldfeld-Quandt test for Heteroskedasticity
Description# significant tests% significant testsOK/NOK
1% type I error level00OK
5% type I error level00OK
10% type I error level10.0666666666666667OK

\begin{tabular}{lllllllll}
\hline
Meta Analysis of Goldfeld-Quandt test for Heteroskedasticity \tabularnewline
Description & # significant tests & % significant tests & OK/NOK \tabularnewline
1% type I error level & 0 & 0 & OK \tabularnewline
5% type I error level & 0 & 0 & OK \tabularnewline
10% type I error level & 1 & 0.0666666666666667 & OK \tabularnewline
\hline
\end{tabular}
%Source: https://freestatistics.org/blog/index.php?pk=57988&T=6

[TABLE]
[ROW][C]Meta Analysis of Goldfeld-Quandt test for Heteroskedasticity[/C][/ROW]
[ROW][C]Description[/C][C]# significant tests[/C][C]% significant tests[/C][C]OK/NOK[/C][/ROW]
[ROW][C]1% type I error level[/C][C]0[/C][C]0[/C][C]OK[/C][/ROW]
[ROW][C]5% type I error level[/C][C]0[/C][C]0[/C][C]OK[/C][/ROW]
[ROW][C]10% type I error level[/C][C]1[/C][C]0.0666666666666667[/C][C]OK[/C][/ROW]
[/TABLE]
Source: https://freestatistics.org/blog/index.php?pk=57988&T=6

Globally Unique Identifier (entire table): ba.freestatistics.org/blog/index.php?pk=57988&T=6

As an alternative you can also use a QR Code:  

The GUIDs for individual cells are displayed in the table below:

Meta Analysis of Goldfeld-Quandt test for Heteroskedasticity
Description# significant tests% significant testsOK/NOK
1% type I error level00OK
5% type I error level00OK
10% type I error level10.0666666666666667OK


Parameters (Session):
par1 = 1 ; par2 = Include Monthly Dummies ; par3 = Linear Trend ;
Parameters (R input):
par1 = 1 ; par2 = Include Monthly Dummies ; par3 = Linear Trend ;
R code (references can be found in the software module):
library(lattice)
library(lmtest)
n25 <- 25 #minimum number of obs. for Goldfeld-Quandt test
par1 <- as.numeric(par1)
x <- t(y)
k <- length(x[1,])
n <- length(x[,1])
x1 <- cbind(x[,par1], x[,1:k!=par1])
mycolnames <- c(colnames(x)[par1], colnames(x)[1:k!=par1])
colnames(x1) <- mycolnames #colnames(x)[par1]
x <- x1
if (par3 == 'First Differences'){
x2 <- array(0, dim=c(n-1,k), dimnames=list(1:(n-1), paste('(1-B)',colnames(x),sep='')))
for (i in 1:n-1) {
for (j in 1:k) {
x2[i,j] <- x[i+1,j] - x[i,j]
}
}
x <- x2
}
if (par2 == 'Include Monthly Dummies'){
x2 <- array(0, dim=c(n,11), dimnames=list(1:n, paste('M', seq(1:11), sep ='')))
for (i in 1:11){
x2[seq(i,n,12),i] <- 1
}
x <- cbind(x, x2)
}
if (par2 == 'Include Quarterly Dummies'){
x2 <- array(0, dim=c(n,3), dimnames=list(1:n, paste('Q', seq(1:3), sep ='')))
for (i in 1:3){
x2[seq(i,n,4),i] <- 1
}
x <- cbind(x, x2)
}
k <- length(x[1,])
if (par3 == 'Linear Trend'){
x <- cbind(x, c(1:n))
colnames(x)[k+1] <- 't'
}
x
k <- length(x[1,])
df <- as.data.frame(x)
(mylm <- lm(df))
(mysum <- summary(mylm))
if (n > n25) {
kp3 <- k + 3
nmkm3 <- n - k - 3
gqarr <- array(NA, dim=c(nmkm3-kp3+1,3))
numgqtests <- 0
numsignificant1 <- 0
numsignificant5 <- 0
numsignificant10 <- 0
for (mypoint in kp3:nmkm3) {
j <- 0
numgqtests <- numgqtests + 1
for (myalt in c('greater', 'two.sided', 'less')) {
j <- j + 1
gqarr[mypoint-kp3+1,j] <- gqtest(mylm, point=mypoint, alternative=myalt)$p.value
}
if (gqarr[mypoint-kp3+1,2] < 0.01) numsignificant1 <- numsignificant1 + 1
if (gqarr[mypoint-kp3+1,2] < 0.05) numsignificant5 <- numsignificant5 + 1
if (gqarr[mypoint-kp3+1,2] < 0.10) numsignificant10 <- numsignificant10 + 1
}
gqarr
}
bitmap(file='test0.png')
plot(x[,1], type='l', main='Actuals and Interpolation', ylab='value of Actuals and Interpolation (dots)', xlab='time or index')
points(x[,1]-mysum$resid)
grid()
dev.off()
bitmap(file='test1.png')
plot(mysum$resid, type='b', pch=19, main='Residuals', ylab='value of Residuals', xlab='time or index')
grid()
dev.off()
bitmap(file='test2.png')
hist(mysum$resid, main='Residual Histogram', xlab='values of Residuals')
grid()
dev.off()
bitmap(file='test3.png')
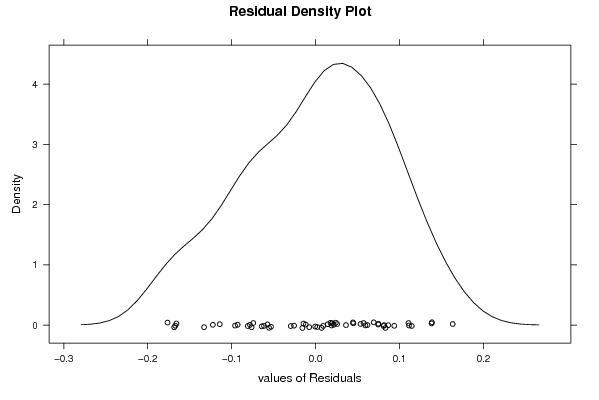
densityplot(~mysum$resid,col='black',main='Residual Density Plot', xlab='values of Residuals')
dev.off()
bitmap(file='test4.png')
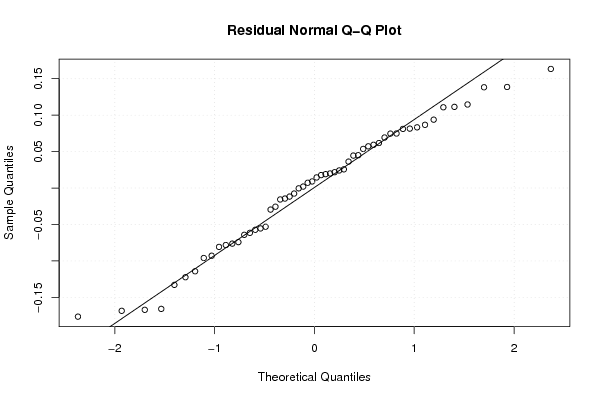
qqnorm(mysum$resid, main='Residual Normal Q-Q Plot')
qqline(mysum$resid)
grid()
dev.off()
(myerror <- as.ts(mysum$resid))
bitmap(file='test5.png')
dum <- cbind(lag(myerror,k=1),myerror)
dum
dum1 <- dum[2:length(myerror),]
dum1
z <- as.data.frame(dum1)
z
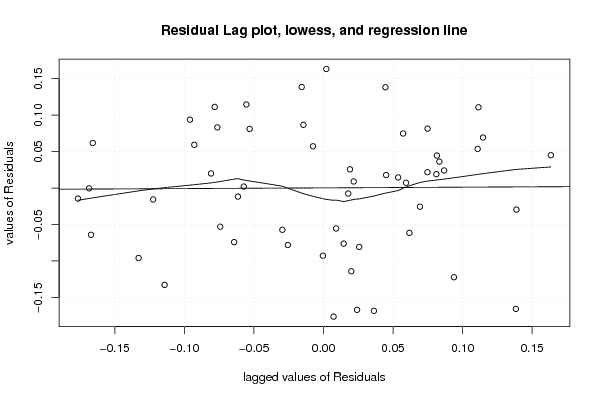
plot(z,main=paste('Residual Lag plot, lowess, and regression line'), ylab='values of Residuals', xlab='lagged values of Residuals')
lines(lowess(z))
abline(lm(z))
grid()
dev.off()
bitmap(file='test6.png')
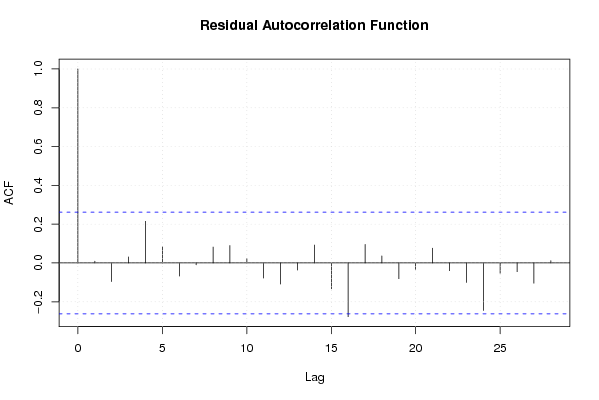
acf(mysum$resid, lag.max=length(mysum$resid)/2, main='Residual Autocorrelation Function')
grid()
dev.off()
bitmap(file='test7.png')
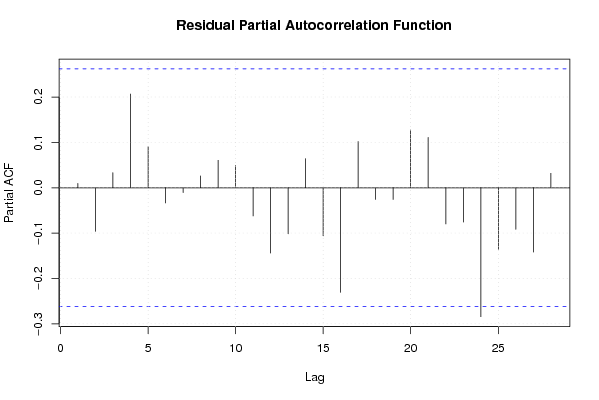
pacf(mysum$resid, lag.max=length(mysum$resid)/2, main='Residual Partial Autocorrelation Function')
grid()
dev.off()
bitmap(file='test8.png')
opar <- par(mfrow = c(2,2), oma = c(0, 0, 1.1, 0))
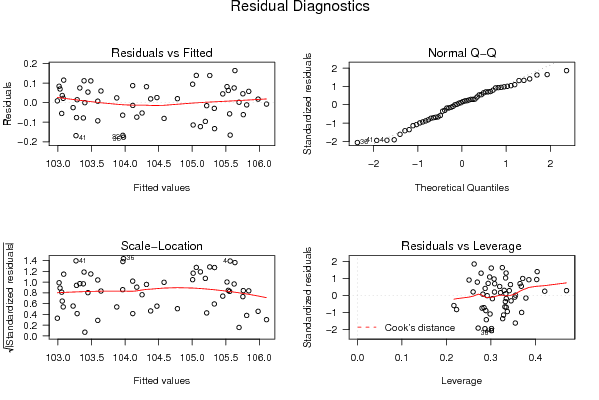
plot(mylm, las = 1, sub='Residual Diagnostics')
par(opar)
dev.off()
if (n > n25) {
bitmap(file='test9.png')
plot(kp3:nmkm3,gqarr[,2], main='Goldfeld-Quandt test',ylab='2-sided p-value',xlab='breakpoint')
grid()
dev.off()
}
load(file='createtable')
a<-table.start()
a<-table.row.start(a)
a<-table.element(a, 'Multiple Linear Regression - Estimated Regression Equation', 1, TRUE)
a<-table.row.end(a)
myeq <- colnames(x)[1]
myeq <- paste(myeq, '[t] = ', sep='')
for (i in 1:k){
if (mysum$coefficients[i,1] > 0) myeq <- paste(myeq, '+', '')
myeq <- paste(myeq, mysum$coefficients[i,1], sep=' ')
if (rownames(mysum$coefficients)[i] != '(Intercept)') {
myeq <- paste(myeq, rownames(mysum$coefficients)[i], sep='')
if (rownames(mysum$coefficients)[i] != 't') myeq <- paste(myeq, '[t]', sep='')
}
}
myeq <- paste(myeq, ' + e[t]')
a<-table.row.start(a)
a<-table.element(a, myeq)
a<-table.row.end(a)
a<-table.end(a)
table.save(a,file='mytable1.tab')
a<-table.start()
a<-table.row.start(a)
a<-table.element(a,hyperlink('ols1.htm','Multiple Linear Regression - Ordinary Least Squares',''), 6, TRUE)
a<-table.row.end(a)
a<-table.row.start(a)
a<-table.element(a,'Variable',header=TRUE)
a<-table.element(a,'Parameter',header=TRUE)
a<-table.element(a,'S.D.',header=TRUE)
a<-table.element(a,'T-STAT
H0: parameter = 0',header=TRUE)
a<-table.element(a,'2-tail p-value',header=TRUE)
a<-table.element(a,'1-tail p-value',header=TRUE)
a<-table.row.end(a)
for (i in 1:k){
a<-table.row.start(a)
a<-table.element(a,rownames(mysum$coefficients)[i],header=TRUE)
a<-table.element(a,mysum$coefficients[i,1])
a<-table.element(a, round(mysum$coefficients[i,2],6))
a<-table.element(a, round(mysum$coefficients[i,3],4))
a<-table.element(a, round(mysum$coefficients[i,4],6))
a<-table.element(a, round(mysum$coefficients[i,4]/2,6))
a<-table.row.end(a)
}
a<-table.end(a)
table.save(a,file='mytable2.tab')
a<-table.start()
a<-table.row.start(a)
a<-table.element(a, 'Multiple Linear Regression - Regression Statistics', 2, TRUE)
a<-table.row.end(a)
a<-table.row.start(a)
a<-table.element(a, 'Multiple R',1,TRUE)
a<-table.element(a, sqrt(mysum$r.squared))
a<-table.row.end(a)
a<-table.row.start(a)
a<-table.element(a, 'R-squared',1,TRUE)
a<-table.element(a, mysum$r.squared)
a<-table.row.end(a)
a<-table.row.start(a)
a<-table.element(a, 'Adjusted R-squared',1,TRUE)
a<-table.element(a, mysum$adj.r.squared)
a<-table.row.end(a)
a<-table.row.start(a)
a<-table.element(a, 'F-TEST (value)',1,TRUE)
a<-table.element(a, mysum$fstatistic[1])
a<-table.row.end(a)
a<-table.row.start(a)
a<-table.element(a, 'F-TEST (DF numerator)',1,TRUE)
a<-table.element(a, mysum$fstatistic[2])
a<-table.row.end(a)
a<-table.row.start(a)
a<-table.element(a, 'F-TEST (DF denominator)',1,TRUE)
a<-table.element(a, mysum$fstatistic[3])
a<-table.row.end(a)
a<-table.row.start(a)
a<-table.element(a, 'p-value',1,TRUE)
a<-table.element(a, 1-pf(mysum$fstatistic[1],mysum$fstatistic[2],mysum$fstatistic[3]))
a<-table.row.end(a)
a<-table.row.start(a)
a<-table.element(a, 'Multiple Linear Regression - Residual Statistics', 2, TRUE)
a<-table.row.end(a)
a<-table.row.start(a)
a<-table.element(a, 'Residual Standard Deviation',1,TRUE)
a<-table.element(a, mysum$sigma)
a<-table.row.end(a)
a<-table.row.start(a)
a<-table.element(a, 'Sum Squared Residuals',1,TRUE)
a<-table.element(a, sum(myerror*myerror))
a<-table.row.end(a)
a<-table.end(a)
table.save(a,file='mytable3.tab')
a<-table.start()
a<-table.row.start(a)
a<-table.element(a, 'Multiple Linear Regression - Actuals, Interpolation, and Residuals', 4, TRUE)
a<-table.row.end(a)
a<-table.row.start(a)
a<-table.element(a, 'Time or Index', 1, TRUE)
a<-table.element(a, 'Actuals', 1, TRUE)
a<-table.element(a, 'Interpolation
Forecast', 1, TRUE)
a<-table.element(a, 'Residuals
Prediction Error', 1, TRUE)
a<-table.row.end(a)
for (i in 1:n) {
a<-table.row.start(a)
a<-table.element(a,i, 1, TRUE)
a<-table.element(a,x[i])
a<-table.element(a,x[i]-mysum$resid[i])
a<-table.element(a,mysum$resid[i])
a<-table.row.end(a)
}
a<-table.end(a)
table.save(a,file='mytable4.tab')
if (n > n25) {
a<-table.start()
a<-table.row.start(a)
a<-table.element(a,'Goldfeld-Quandt test for Heteroskedasticity',4,TRUE)
a<-table.row.end(a)
a<-table.row.start(a)
a<-table.element(a,'p-values',header=TRUE)
a<-table.element(a,'Alternative Hypothesis',3,header=TRUE)
a<-table.row.end(a)
a<-table.row.start(a)
a<-table.element(a,'breakpoint index',header=TRUE)
a<-table.element(a,'greater',header=TRUE)
a<-table.element(a,'2-sided',header=TRUE)
a<-table.element(a,'less',header=TRUE)
a<-table.row.end(a)
for (mypoint in kp3:nmkm3) {
a<-table.row.start(a)
a<-table.element(a,mypoint,header=TRUE)
a<-table.element(a,gqarr[mypoint-kp3+1,1])
a<-table.element(a,gqarr[mypoint-kp3+1,2])
a<-table.element(a,gqarr[mypoint-kp3+1,3])
a<-table.row.end(a)
}
a<-table.end(a)
table.save(a,file='mytable5.tab')
a<-table.start()
a<-table.row.start(a)
a<-table.element(a,'Meta Analysis of Goldfeld-Quandt test for Heteroskedasticity',4,TRUE)
a<-table.row.end(a)
a<-table.row.start(a)
a<-table.element(a,'Description',header=TRUE)
a<-table.element(a,'# significant tests',header=TRUE)
a<-table.element(a,'% significant tests',header=TRUE)
a<-table.element(a,'OK/NOK',header=TRUE)
a<-table.row.end(a)
a<-table.row.start(a)
a<-table.element(a,'1% type I error level',header=TRUE)
a<-table.element(a,numsignificant1)
a<-table.element(a,numsignificant1/numgqtests)
if (numsignificant1/numgqtests < 0.01) dum <- 'OK' else dum <- 'NOK'
a<-table.element(a,dum)
a<-table.row.end(a)
a<-table.row.start(a)
a<-table.element(a,'5% type I error level',header=TRUE)
a<-table.element(a,numsignificant5)
a<-table.element(a,numsignificant5/numgqtests)
if (numsignificant5/numgqtests < 0.05) dum <- 'OK' else dum <- 'NOK'
a<-table.element(a,dum)
a<-table.row.end(a)
a<-table.row.start(a)
a<-table.element(a,'10% type I error level',header=TRUE)
a<-table.element(a,numsignificant10)
a<-table.element(a,numsignificant10/numgqtests)
if (numsignificant10/numgqtests < 0.1) dum <- 'OK' else dum <- 'NOK'
a<-table.element(a,dum)
a<-table.row.end(a)
a<-table.end(a)
table.save(a,file='mytable6.tab')
}