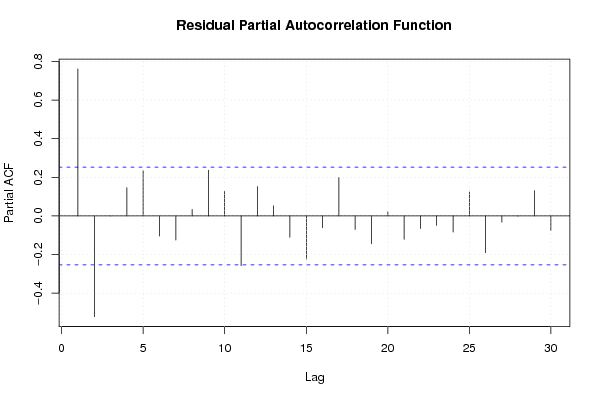
| Multiple Linear Regression - Estimated Regression Equation |
| wkh[t] = + 23.7242314611506 -5.62069109049765e-05los[t] -0.0275271564433608M1[t] -0.0940245016618537M2[t] -0.522924687831299M3[t] -0.698702671431273M4[t] -0.82863197409711M5[t] -0.0983733354658894M6[t] + 0.0178126737747341M7[t] + 0.0259354497915659M8[t] -0.324101697078169M9[t] -0.428680101825853M10[t] -0.408762127383254M11[t] + e[t] |
| Multiple Linear Regression - Ordinary Least Squares | |||||
| Variable | Parameter | S.D. | T-STAT H0: parameter = 0 | 2-tail p-value | 1-tail p-value |
| (Intercept) | 23.7242314611506 | 2.450619 | 9.6809 | 0 | 0 |
| los | -5.62069109049765e-05 | 9e-06 | -6.3201 | 0 | 0 |
| M1 | -0.0275271564433608 | 0.263103 | -0.1046 | 0.917119 | 0.458559 |
| M2 | -0.0940245016618537 | 0.261309 | -0.3598 | 0.720592 | 0.360296 |
| M3 | -0.522924687831299 | 0.26434 | -1.9782 | 0.053781 | 0.026891 |
| M4 | -0.698702671431273 | 0.262932 | -2.6573 | 0.010727 | 0.005363 |
| M5 | -0.82863197409711 | 0.262406 | -3.1578 | 0.002776 | 0.001388 |
| M6 | -0.0983733354658894 | 0.26151 | -0.3762 | 0.70848 | 0.35424 |
| M7 | 0.0178126737747341 | 0.261231 | 0.0682 | 0.945926 | 0.472963 |
| M8 | 0.0259354497915659 | 0.261048 | 0.0994 | 0.921282 | 0.460641 |
| M9 | -0.324101697078169 | 0.262334 | -1.2355 | 0.222801 | 0.111401 |
| M10 | -0.428680101825853 | 0.261839 | -1.6372 | 0.10827 | 0.054135 |
| M11 | -0.408762127383254 | 0.263543 | -1.551 | 0.127604 | 0.063802 |
| Multiple Linear Regression - Regression Statistics | |
| Multiple R | 0.747816602639393 |
| R-squared | 0.559229671183124 |
| Adjusted R-squared | 0.446692565953283 |
| F-TEST (value) | 4.96929141762602 |
| F-TEST (DF numerator) | 12 |
| F-TEST (DF denominator) | 47 |
| p-value | 3.04602975735868e-05 |
| Multiple Linear Regression - Residual Statistics | |
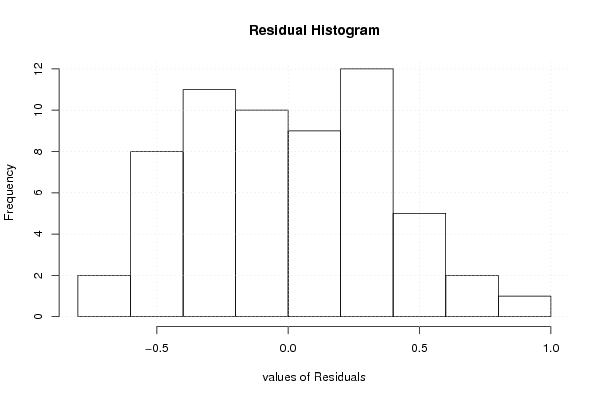
| Residual Standard Deviation | 0.412749828750751 |
| Sum Squared Residuals | 8.00703379328739 |
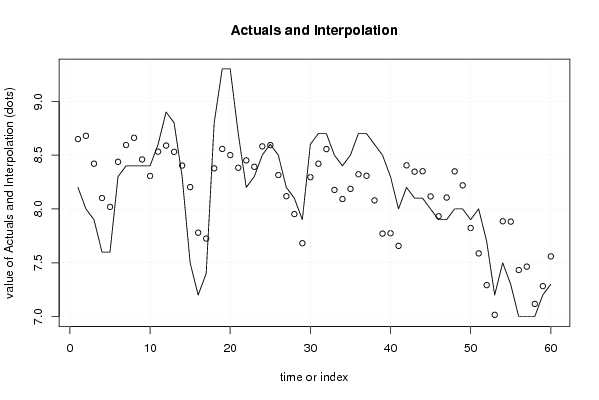
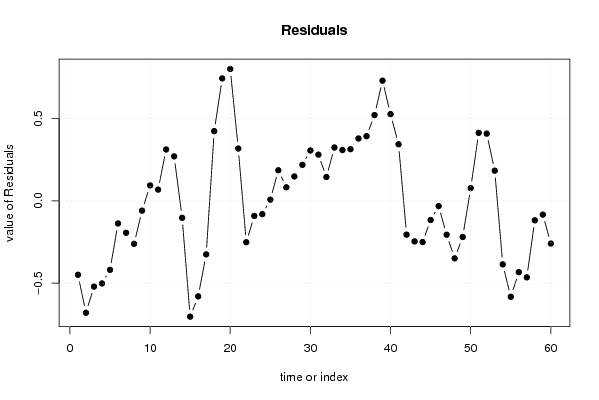
| Multiple Linear Regression - Actuals, Interpolation, and Residuals | |||
| Time or Index | Actuals | Interpolation Forecast | Residuals Prediction Error |
| 1 | 8.2 | 8.6488777034051 | -0.448877703405109 |
| 2 | 8 | 8.67900003803224 | -0.679000038032239 |
| 3 | 7.9 | 8.42051920572668 | -0.520519205726682 |
| 4 | 7.6 | 8.10141359931902 | -0.501413599319018 |
| 5 | 7.6 | 8.01897913636789 | -0.418979136367885 |
| 6 | 8.3 | 8.4374580402092 | -0.137458040209200 |
| 7 | 8.4 | 8.59383199074688 | -0.193831990746883 |
| 8 | 8.4 | 8.66102823012485 | -0.261028230124845 |
| 9 | 8.4 | 8.45954594877696 | -0.0595459487769628 |
| 10 | 8.4 | 8.30629235918557 | 0.0937076408144305 |
| 11 | 8.6 | 8.5320400413622 | 0.0679599586378067 |
| 12 | 8.9 | 8.58855345810396 | 0.311446541896041 |
| 13 | 8.8 | 8.53044974212829 | 0.269550257871709 |
| 14 | 8.3 | 8.40313651931061 | -0.103136519310613 |
| 15 | 7.5 | 8.2028298397917 | -0.702829839791707 |
| 16 | 7.2 | 7.77974144820984 | -0.579741448209837 |
| 17 | 7.4 | 7.72496078542395 | -0.324960785423953 |
| 18 | 8.8 | 8.37714802480816 | 0.422851975191839 |
| 19 | 9.3 | 8.55735370556955 | 0.742646294430447 |
| 20 | 9.3 | 8.49999543038209 | 0.800004569617913 |
| 21 | 8.7 | 8.38282351539167 | 0.317176484608329 |
| 22 | 8.2 | 8.4512499824095 | -0.251249982409505 |
| 23 | 8.3 | 8.39152276409975 | -0.0915227640997506 |
| 24 | 8.5 | 8.5810217320427 | -0.0810217320426921 |
| 25 | 8.6 | 8.59312044778734 | 0.00687955221266002 |
| 26 | 8.5 | 8.3148354622789 | 0.185164537721105 |
| 27 | 8.2 | 8.11812602505791 | 0.0818739749420914 |
| 28 | 8.1 | 7.95224045777721 | 0.147759542222789 |
| 29 | 7.9 | 7.68185008475984 | 0.218149915240164 |
| 30 | 8.6 | 8.29463627959966 | 0.305363720400343 |
| 31 | 8.7 | 8.4200964291396 | 0.279903570860399 |
| 32 | 8.7 | 8.55558406526711 | 0.14441593473289 |
| 33 | 8.5 | 8.17671277310312 | 0.323287226896879 |
| 34 | 8.4 | 8.0920878217267 | 0.307912178273296 |
| 35 | 8.5 | 8.18681719458383 | 0.313182805416173 |
| 36 | 8.7 | 8.32202028659256 | 0.377979713407439 |
| 37 | 8.7 | 8.30815140949911 | 0.391848590500891 |
| 38 | 8.6 | 8.07983436778519 | 0.520165632214811 |
| 39 | 8.5 | 7.77110455713058 | 0.728895442869417 |
| 40 | 8.3 | 7.77412075711934 | 0.525879242880661 |
| 41 | 8 | 7.65706283705074 | 0.342937162949258 |
| 42 | 8.2 | 8.40513906643884 | -0.205139066438841 |
| 43 | 8.1 | 8.34635296203227 | -0.246352962032272 |
| 44 | 8.1 | 8.35031642664213 | -0.250316426642135 |
| 45 | 8 | 8.1165151715239 | -0.116515171523891 |
| 46 | 7.9 | 7.93206674638024 | -0.0320667463802358 |
| 47 | 7.9 | 8.10582303596976 | -0.205823035969755 |
| 48 | 8 | 8.34899960382695 | -0.348999603826949 |
| 49 | 8 | 8.21940069718015 | -0.219400697180151 |
| 50 | 7.9 | 7.82319361259307 | 0.0768063874069349 |
| 51 | 8 | 7.58742037229312 | 0.412579627706881 |
| 52 | 7.7 | 7.2924837375746 | 0.407516262425405 |
| 53 | 7.2 | 7.01714715639758 | 0.182852843602416 |
| 54 | 7.5 | 7.88561858894414 | -0.385618588944142 |
| 55 | 7.3 | 7.88236491251169 | -0.58236491251169 |
| 56 | 7 | 7.43307584758382 | -0.433075847583823 |
| 57 | 7 | 7.46440259120435 | -0.464402591204354 |
| 58 | 7 | 7.11830309029799 | -0.118303090297986 |
| 59 | 7.2 | 7.28379696398447 | -0.0837969639844735 |
| 60 | 7.3 | 7.55940491943384 | -0.259404919433839 |
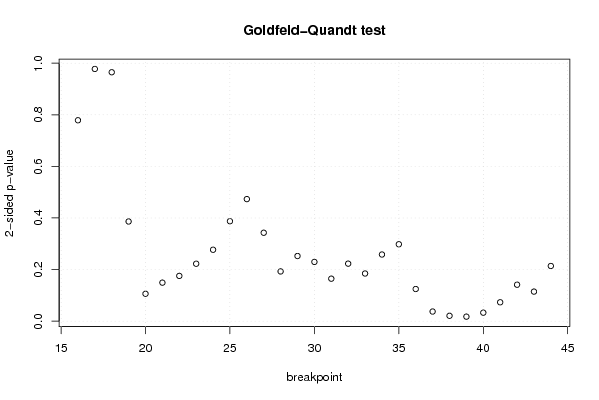
| Goldfeld-Quandt test for Heteroskedasticity | |||
| p-values | Alternative Hypothesis | ||
| breakpoint index | greater | 2-sided | less |
| 16 | 0.610570081041099 | 0.778859837917803 | 0.389429918958901 |
| 17 | 0.488852709692011 | 0.977705419384021 | 0.511147290307989 |
| 18 | 0.517560905691002 | 0.964878188617996 | 0.482439094308998 |
| 19 | 0.806755560482881 | 0.386488879034237 | 0.193244439517119 |
| 20 | 0.946883033266664 | 0.106233933466673 | 0.0531169667333364 |
| 21 | 0.92532011137493 | 0.149359777250141 | 0.0746798886250707 |
| 22 | 0.912238451972645 | 0.175523096054711 | 0.0877615480273554 |
| 23 | 0.88869572141976 | 0.222608557160482 | 0.111304278580241 |
| 24 | 0.861563964146174 | 0.276872071707653 | 0.138436035853826 |
| 25 | 0.806224575803617 | 0.387550848392766 | 0.193775424196383 |
| 26 | 0.763368054258309 | 0.473263891483382 | 0.236631945741691 |
| 27 | 0.82860157226616 | 0.34279685546768 | 0.17139842773384 |
| 28 | 0.903552927713268 | 0.192894144573465 | 0.0964470722867324 |
| 29 | 0.87369414307054 | 0.252611713858919 | 0.126305856929459 |
| 30 | 0.885098113575207 | 0.229803772849587 | 0.114901886424793 |
| 31 | 0.917639470315607 | 0.164721059368786 | 0.082360529684393 |
| 32 | 0.888493537829144 | 0.223012924341712 | 0.111506462170856 |
| 33 | 0.907608800869399 | 0.184782398261203 | 0.0923911991306014 |
| 34 | 0.870786944078094 | 0.258426111843813 | 0.129213055921907 |
| 35 | 0.850890688711885 | 0.29821862257623 | 0.149109311288115 |
| 36 | 0.937645018071944 | 0.124709963856113 | 0.0623549819280564 |
| 37 | 0.981314382815044 | 0.0373712343699129 | 0.0186856171849565 |
| 38 | 0.989550603140814 | 0.0208987937183719 | 0.0104493968591860 |
| 39 | 0.991214885257098 | 0.0175702294858041 | 0.00878511474290203 |
| 40 | 0.98353943170869 | 0.03292113658262 | 0.01646056829131 |
| 41 | 0.96332990698207 | 0.0733401860358602 | 0.0366700930179301 |
| 42 | 0.929297472176128 | 0.141405055647744 | 0.070702527823872 |
| 43 | 0.942664984313462 | 0.114670031373075 | 0.0573350156865377 |
| 44 | 0.893010594771731 | 0.213978810456539 | 0.106989405228269 |
| Meta Analysis of Goldfeld-Quandt test for Heteroskedasticity | |||
| Description | # significant tests | % significant tests | OK/NOK |
| 1% type I error level | 0 | 0 | OK |
| 5% type I error level | 4 | 0.137931034482759 | NOK |
| 10% type I error level | 5 | 0.172413793103448 | NOK |