| Multiple Linear Regression - Estimated Regression Equation |
| Y[t] = + 145.45625 -16.640625X[t] -0.528124999999965M1[t] -11.328125M2[t] -20.1281250000000M3[t] -23.1281250000000M4[t] -21.6M5[t] -24.6M6[t] -29.4M7[t] -32.2000000000001M8[t] -38.6M9[t] -37.2M10[t] -6.00000000000003M11[t] + e[t] |
| Multiple Linear Regression - Ordinary Least Squares | |||||
| Variable | Parameter | S.D. | T-STAT H0: parameter = 0 | 2-tail p-value | 1-tail p-value |
| (Intercept) | 145.45625 | 5.043099 | 28.8426 | 0 | 0 |
| X | -16.640625 | 3.057828 | -5.442 | 2e-06 | 1e-06 |
| M1 | -0.528124999999965 | 6.946049 | -0.076 | 0.939716 | 0.469858 |
| M2 | -11.328125 | 6.946049 | -1.6309 | 0.109601 | 0.054801 |
| M3 | -20.1281250000000 | 6.946049 | -2.8978 | 0.005692 | 0.002846 |
| M4 | -23.1281250000000 | 6.946049 | -3.3297 | 0.001698 | 0.000849 |
| M5 | -21.6 | 6.919074 | -3.1218 | 0.003072 | 0.001536 |
| M6 | -24.6 | 6.919074 | -3.5554 | 0.000873 | 0.000437 |
| M7 | -29.4 | 6.919074 | -4.2491 | 0.000101 | 5e-05 |
| M8 | -32.2000000000001 | 6.919074 | -4.6538 | 2.7e-05 | 1.3e-05 |
| M9 | -38.6 | 6.919074 | -5.5788 | 1e-06 | 1e-06 |
| M10 | -37.2 | 6.919074 | -5.3764 | 2e-06 | 1e-06 |
| M11 | -6.00000000000003 | 6.919074 | -0.8672 | 0.390256 | 0.195128 |
| Multiple Linear Regression - Regression Statistics | |
| Multiple R | 0.847811656096568 |
| R-squared | 0.718784604213205 |
| Adjusted R-squared | 0.646984928693172 |
| F-TEST (value) | 10.0109728770662 |
| F-TEST (DF numerator) | 12 |
| F-TEST (DF denominator) | 47 |
| p-value | 2.53967291641288e-09 |
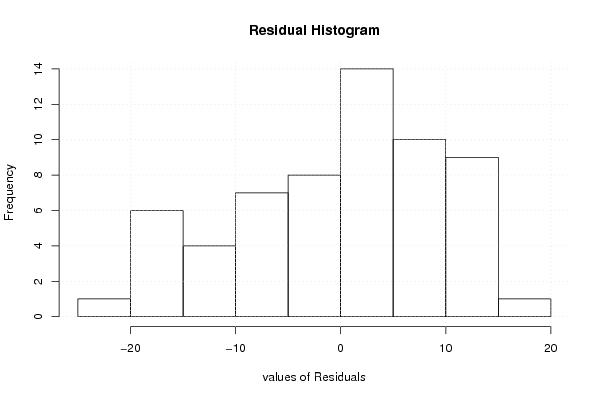
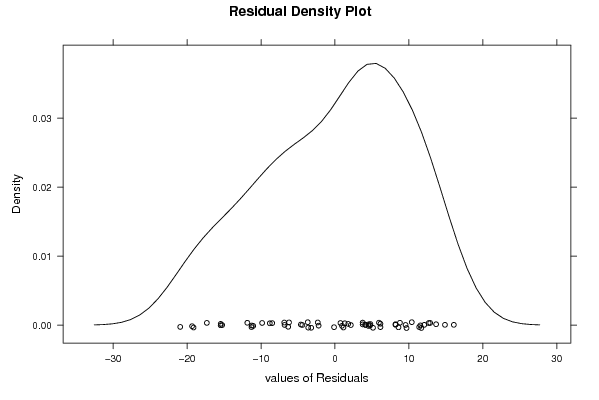
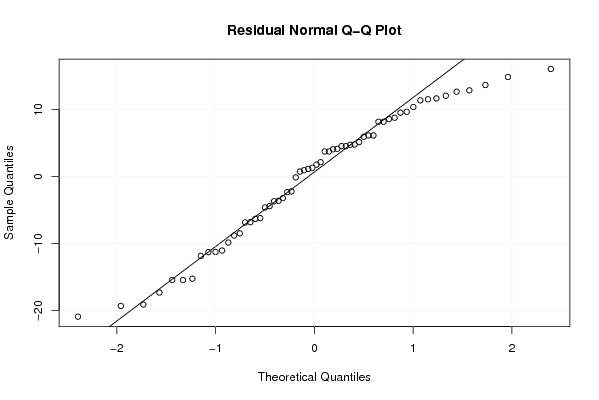
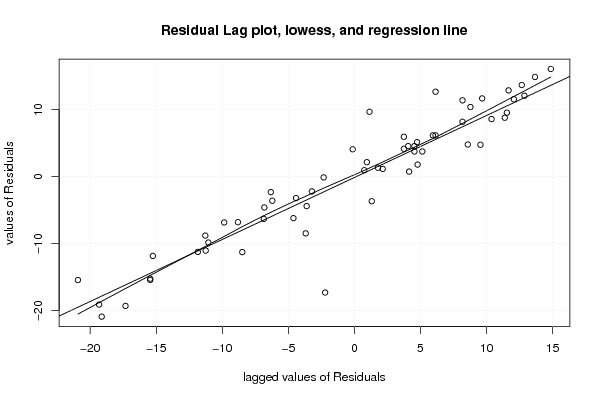
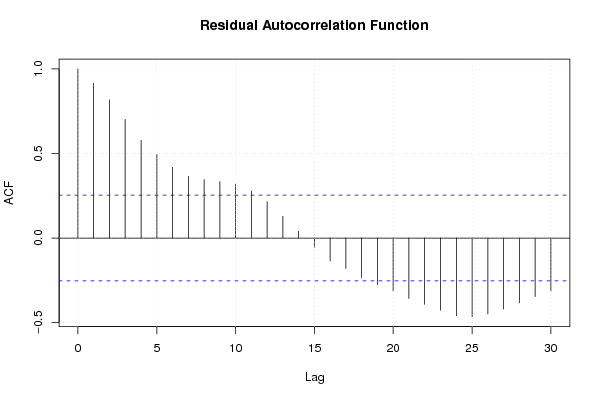
| Multiple Linear Regression - Residual Statistics | |
| Residual Standard Deviation | 10.9400171875473 |
| Sum Squared Residuals | 5625.14687500001 |
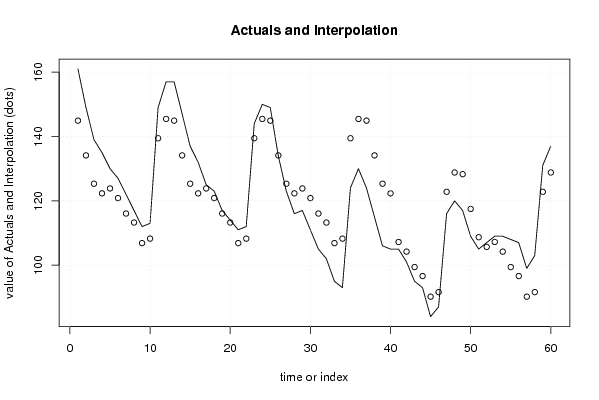
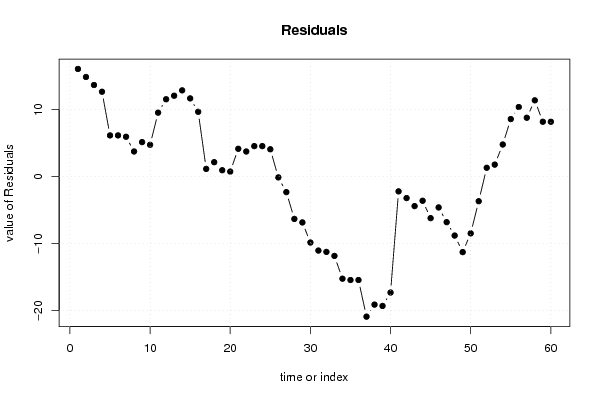
| Multiple Linear Regression - Actuals, Interpolation, and Residuals | |||
| Time or Index | Actuals | Interpolation Forecast | Residuals Prediction Error |
| 1 | 161 | 144.928125000000 | 16.0718750000002 |
| 2 | 149 | 134.128125 | 14.87187500 |
| 3 | 139 | 125.328125 | 13.671875 |
| 4 | 135 | 122.328125 | 12.6718750000000 |
| 5 | 130 | 123.85625 | 6.14375000000002 |
| 6 | 127 | 120.85625 | 6.14375000000003 |
| 7 | 122 | 116.05625 | 5.94374999999993 |
| 8 | 117 | 113.25625 | 3.74374999999995 |
| 9 | 112 | 106.85625 | 5.14374999999999 |
| 10 | 113 | 108.25625 | 4.74375000000006 |
| 11 | 149 | 139.45625 | 9.54374999999998 |
| 12 | 157 | 145.45625 | 11.54375 |
| 13 | 157 | 144.928125 | 12.0718750000000 |
| 14 | 147 | 134.128125 | 12.871875 |
| 15 | 137 | 125.328125 | 11.671875 |
| 16 | 132 | 122.328125 | 9.671875 |
| 17 | 125 | 123.85625 | 1.14374999999999 |
| 18 | 123 | 120.85625 | 2.14374999999999 |
| 19 | 117 | 116.05625 | 0.943750000000015 |
| 20 | 114 | 113.25625 | 0.743750000000012 |
| 21 | 111 | 106.85625 | 4.14375000000001 |
| 22 | 112 | 108.25625 | 3.74374999999999 |
| 23 | 144 | 139.45625 | 4.54375 |
| 24 | 150 | 145.45625 | 4.54374999999997 |
| 25 | 149 | 144.928125 | 4.07187499999995 |
| 26 | 134 | 134.128125 | -0.128124999999997 |
| 27 | 123 | 125.328125 | -2.32812499999999 |
| 28 | 116 | 122.328125 | -6.328125 |
| 29 | 117 | 123.85625 | -6.85625000000001 |
| 30 | 111 | 120.85625 | -9.85625 |
| 31 | 105 | 116.05625 | -11.0562500000000 |
| 32 | 102 | 113.25625 | -11.25625 |
| 33 | 95 | 106.85625 | -11.85625 |
| 34 | 93 | 108.25625 | -15.25625 |
| 35 | 124 | 139.45625 | -15.45625 |
| 36 | 130 | 145.45625 | -15.4562500000000 |
| 37 | 124 | 144.928125 | -20.9281250000001 |
| 38 | 115 | 134.128125 | -19.128125 |
| 39 | 106 | 125.328125 | -19.328125 |
| 40 | 105 | 122.328125 | -17.328125 |
| 41 | 105 | 107.215625 | -2.215625 |
| 42 | 101 | 104.215625 | -3.21562500000001 |
| 43 | 95 | 99.415625 | -4.41562499999998 |
| 44 | 93 | 96.615625 | -3.61562499999998 |
| 45 | 84 | 90.215625 | -6.215625 |
| 46 | 87 | 91.615625 | -4.61562500000002 |
| 47 | 116 | 122.815625 | -6.815625 |
| 48 | 120 | 128.815625 | -8.81562500000002 |
| 49 | 117 | 128.2875 | -11.2875000000000 |
| 50 | 109 | 117.4875 | -8.48749999999999 |
| 51 | 105 | 108.6875 | -3.68749999999999 |
| 52 | 107 | 105.6875 | 1.31250000000001 |
| 53 | 109 | 107.215625 | 1.784375 |
| 54 | 109 | 104.215625 | 4.78437499999999 |
| 55 | 108 | 99.415625 | 8.58437500000002 |
| 56 | 107 | 96.615625 | 10.3843750000000 |
| 57 | 99 | 90.215625 | 8.784375 |
| 58 | 103 | 91.615625 | 11.3843750000000 |
| 59 | 131 | 122.815625 | 8.18437500000001 |
| 60 | 137 | 128.815625 | 8.18437499999999 |
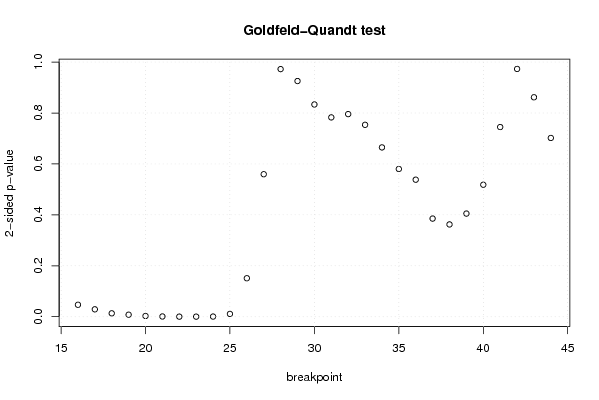
| Goldfeld-Quandt test for Heteroskedasticity | |||
| p-values | Alternative Hypothesis | ||
| breakpoint index | greater | 2-sided | less |
| 16 | 0.0234507771973019 | 0.0469015543946039 | 0.976549222802698 |
| 17 | 0.0145369042941007 | 0.0290738085882013 | 0.9854630957059 |
| 18 | 0.00665784303325777 | 0.0133156860665155 | 0.993342156966742 |
| 19 | 0.00397175772754815 | 0.0079435154550963 | 0.996028242272452 |
| 20 | 0.00148725694702010 | 0.00297451389404020 | 0.99851274305298 |
| 21 | 0.000484057676460856 | 0.000968115352921712 | 0.999515942323539 |
| 22 | 0.000155429509675655 | 0.000310859019351311 | 0.999844570490324 |
| 23 | 0.000142537852105836 | 0.000285075704211673 | 0.999857462147894 |
| 24 | 0.000295230695616832 | 0.000590461391233664 | 0.999704769304383 |
| 25 | 0.00545869260817769 | 0.0109173852163554 | 0.994541307391822 |
| 26 | 0.0755665681365686 | 0.151133136273137 | 0.924433431863431 |
| 27 | 0.279807541348509 | 0.559615082697018 | 0.720192458651491 |
| 28 | 0.513808319777607 | 0.972383360444787 | 0.486191680222393 |
| 29 | 0.5372617719399 | 0.9254764561202 | 0.4627382280601 |
| 30 | 0.58323559704536 | 0.83352880590928 | 0.41676440295464 |
| 31 | 0.608609085331046 | 0.782781829337909 | 0.391390914668955 |
| 32 | 0.60216025230332 | 0.79567949539336 | 0.39783974769668 |
| 33 | 0.623209946725054 | 0.753580106549893 | 0.376790053274946 |
| 34 | 0.667553067487257 | 0.664893865025486 | 0.332446932512743 |
| 35 | 0.709935050882015 | 0.580129898235971 | 0.290064949117985 |
| 36 | 0.730947672769812 | 0.538104654460377 | 0.269052327230188 |
| 37 | 0.807271090354981 | 0.385457819290037 | 0.192728909645019 |
| 38 | 0.81878368534329 | 0.362432629313421 | 0.181216314656710 |
| 39 | 0.797473381296492 | 0.405053237407015 | 0.202526618703507 |
| 40 | 0.74084702528502 | 0.51830594942996 | 0.25915297471498 |
| 41 | 0.627572298245581 | 0.744855403508837 | 0.372427701754419 |
| 42 | 0.513497460785119 | 0.973005078429763 | 0.486502539214881 |
| 43 | 0.430866030128565 | 0.86173206025713 | 0.569133969871435 |
| 44 | 0.350983763231247 | 0.701967526462494 | 0.649016236768753 |
| Meta Analysis of Goldfeld-Quandt test for Heteroskedasticity | |||
| Description | # significant tests | % significant tests | OK/NOK |
| 1% type I error level | 6 | 0.206896551724138 | NOK |
| 5% type I error level | 10 | 0.344827586206897 | NOK |
| 10% type I error level | 10 | 0.344827586206897 | NOK |