| Multiple Linear Regression - Estimated Regression Equation |
| Y[t] = + 1.27666936157067 + 0.883343521385048X[t] + e[t] |
| Multiple Linear Regression - Ordinary Least Squares | |||||
| Variable | Parameter | S.D. | T-STAT H0: parameter = 0 | 2-tail p-value | 1-tail p-value |
| (Intercept) | 1.27666936157067 | 0.57852 | 2.2068 | 0.031301 | 0.015651 |
| X | 0.883343521385048 | 0.072846 | 12.1261 | 0 | 0 |
| Multiple Linear Regression - Regression Statistics | |
| Multiple R | 0.846836840542365 |
| R-squared | 0.717132634499774 |
| Adjusted R-squared | 0.712255610956667 |
| F-TEST (value) | 147.043094658276 |
| F-TEST (DF numerator) | 1 |
| F-TEST (DF denominator) | 58 |
| p-value | 0 |
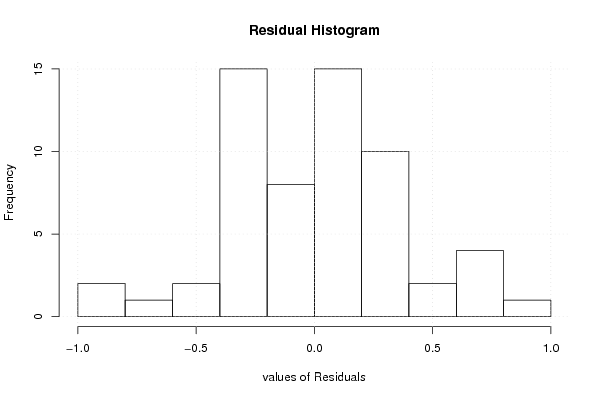
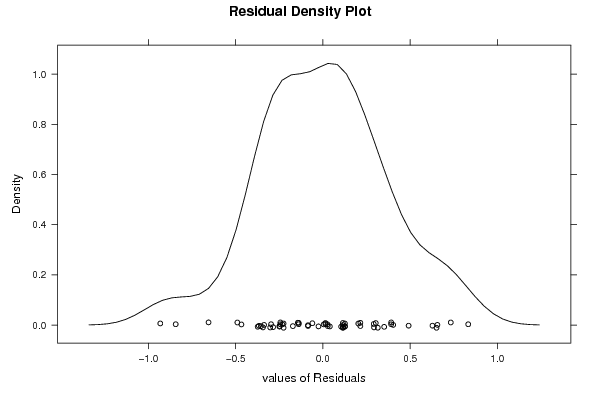
| Multiple Linear Regression - Residual Statistics | |
| Residual Standard Deviation | 0.366819119890273 |
| Sum Squared Residuals | 7.80426346959031 |
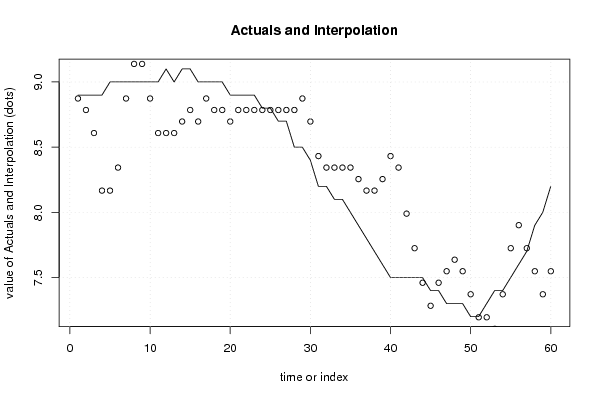
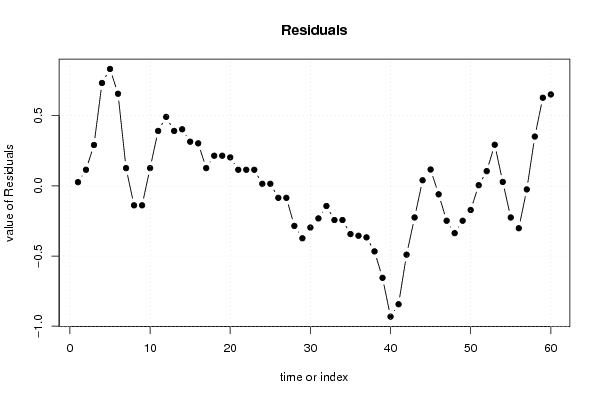
| Multiple Linear Regression - Actuals, Interpolation, and Residuals | |||
| Time or Index | Actuals | Interpolation Forecast | Residuals Prediction Error |
| 1 | 8.9 | 8.87342364548213 | 0.0265763545178733 |
| 2 | 8.9 | 8.78508929334359 | 0.114910706656415 |
| 3 | 8.9 | 8.60842058906658 | 0.291579410933423 |
| 4 | 8.9 | 8.16674882837405 | 0.733251171625948 |
| 5 | 9 | 8.16674882837405 | 0.833251171625948 |
| 6 | 9 | 8.34341753265106 | 0.656582467348938 |
| 7 | 9 | 8.8734236454821 | 0.126576354517910 |
| 8 | 9 | 9.1384267018976 | -0.138426701897606 |
| 9 | 9 | 9.1384267018976 | -0.138426701897606 |
| 10 | 9 | 8.8734236454821 | 0.126576354517910 |
| 11 | 9 | 8.60842058906658 | 0.391579410933423 |
| 12 | 9.1 | 8.60842058906658 | 0.491579410933423 |
| 13 | 9 | 8.60842058906658 | 0.391579410933423 |
| 14 | 9.1 | 8.69675494120508 | 0.403245058794918 |
| 15 | 9.1 | 8.78508929334359 | 0.314910706656414 |
| 16 | 9 | 8.69675494120508 | 0.303245058794919 |
| 17 | 9 | 8.8734236454821 | 0.126576354517910 |
| 18 | 9 | 8.78508929334359 | 0.214910706656414 |
| 19 | 9 | 8.78508929334359 | 0.214910706656414 |
| 20 | 8.9 | 8.69675494120508 | 0.203245058794919 |
| 21 | 8.9 | 8.78508929334359 | 0.114910706656414 |
| 22 | 8.9 | 8.78508929334359 | 0.114910706656414 |
| 23 | 8.9 | 8.78508929334359 | 0.114910706656414 |
| 24 | 8.8 | 8.78508929334359 | 0.0149107066564148 |
| 25 | 8.8 | 8.78508929334359 | 0.0149107066564148 |
| 26 | 8.7 | 8.78508929334359 | -0.0850892933435866 |
| 27 | 8.7 | 8.78508929334359 | -0.0850892933435866 |
| 28 | 8.5 | 8.78508929334359 | -0.285089293343586 |
| 29 | 8.5 | 8.8734236454821 | -0.373423645482090 |
| 30 | 8.4 | 8.69675494120508 | -0.296754941205081 |
| 31 | 8.2 | 8.43175188478957 | -0.231751884789567 |
| 32 | 8.2 | 8.34341753265106 | -0.143417532651063 |
| 33 | 8.1 | 8.34341753265106 | -0.243417532651062 |
| 34 | 8.1 | 8.34341753265106 | -0.243417532651062 |
| 35 | 8 | 8.34341753265106 | -0.343417532651062 |
| 36 | 7.9 | 8.25508318051256 | -0.355083180512557 |
| 37 | 7.8 | 8.16674882837405 | -0.366748828374052 |
| 38 | 7.7 | 8.16674882837405 | -0.466748828374052 |
| 39 | 7.6 | 8.25508318051256 | -0.655083180512558 |
| 40 | 7.5 | 8.43175188478957 | -0.931751884789566 |
| 41 | 7.5 | 8.34341753265106 | -0.843417532651062 |
| 42 | 7.5 | 7.99008012409704 | -0.490080124097042 |
| 43 | 7.5 | 7.72507706768153 | -0.225077067681528 |
| 44 | 7.5 | 7.46007401126601 | 0.0399259887339864 |
| 45 | 7.4 | 7.283405306989 | 0.116594693010997 |
| 46 | 7.4 | 7.46007401126601 | -0.0600740112660132 |
| 47 | 7.3 | 7.54840836340452 | -0.248408363404518 |
| 48 | 7.3 | 7.63674271554302 | -0.336742715543024 |
| 49 | 7.3 | 7.54840836340452 | -0.248408363404518 |
| 50 | 7.2 | 7.37173965912751 | -0.171739659127509 |
| 51 | 7.2 | 7.1950709548505 | 0.00492904514950071 |
| 52 | 7.3 | 7.1950709548505 | 0.104929045149500 |
| 53 | 7.4 | 7.106736602712 | 0.293263397288006 |
| 54 | 7.4 | 7.37173965912751 | 0.0282603408724912 |
| 55 | 7.5 | 7.72507706768153 | -0.225077067681528 |
| 56 | 7.6 | 7.90174577195854 | -0.301745771958538 |
| 57 | 7.7 | 7.72507706768153 | -0.0250770676815277 |
| 58 | 7.9 | 7.54840836340452 | 0.351591636595482 |
| 59 | 8 | 7.37173965912751 | 0.628260340872491 |
| 60 | 8.2 | 7.54840836340452 | 0.651591636595481 |
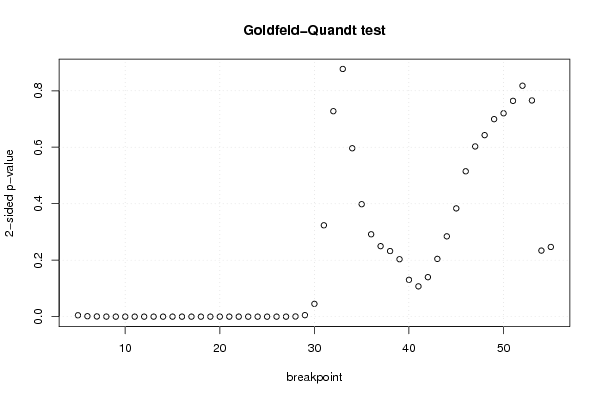
| Goldfeld-Quandt test for Heteroskedasticity | |||
| p-values | Alternative Hypothesis | ||
| breakpoint index | greater | 2-sided | less |
| 5 | 0.00240539709695284 | 0.00481079419390569 | 0.997594602903047 |
| 6 | 0.00073914716324368 | 0.00147829432648736 | 0.999260852836756 |
| 7 | 0.000394111152431112 | 0.000788222304862224 | 0.999605888847569 |
| 8 | 0.000107335517347592 | 0.000214671034695184 | 0.999892664482652 |
| 9 | 2.06905249978744e-05 | 4.13810499957488e-05 | 0.999979309475002 |
| 10 | 3.85605238218764e-06 | 7.71210476437528e-06 | 0.999996143947618 |
| 11 | 8.49735665809041e-07 | 1.69947133161808e-06 | 0.999999150264334 |
| 12 | 2.13393674769187e-06 | 4.26787349538374e-06 | 0.999997866063252 |
| 13 | 5.17407723027196e-07 | 1.03481544605439e-06 | 0.999999482592277 |
| 14 | 6.25513369209887e-07 | 1.25102673841977e-06 | 0.999999374486631 |
| 15 | 5.10484861887215e-07 | 1.02096972377443e-06 | 0.999999489515138 |
| 16 | 1.46677267589816e-07 | 2.93354535179631e-07 | 0.999999853322732 |
| 17 | 3.56336182684978e-08 | 7.12672365369956e-08 | 0.999999964366382 |
| 18 | 9.86601137741827e-09 | 1.97320227548365e-08 | 0.99999999013399 |
| 19 | 2.92799903500900e-09 | 5.85599807001799e-09 | 0.999999997072 |
| 20 | 2.43378104015101e-09 | 4.86756208030203e-09 | 0.999999997566219 |
| 21 | 1.82779427803205e-09 | 3.65558855606411e-09 | 0.999999998172206 |
| 22 | 1.41611323111640e-09 | 2.83222646223281e-09 | 0.999999998583887 |
| 23 | 1.21951784991717e-09 | 2.43903569983434e-09 | 0.999999998780482 |
| 24 | 7.44840260963452e-09 | 1.48968052192690e-08 | 0.999999992551597 |
| 25 | 3.06341786583657e-08 | 6.12683573167314e-08 | 0.999999969365821 |
| 26 | 6.04700862125556e-07 | 1.20940172425111e-06 | 0.999999395299138 |
| 27 | 5.34097803824134e-06 | 1.06819560764827e-05 | 0.999994659021962 |
| 28 | 0.000326031791112512 | 0.000652063582225023 | 0.999673968208888 |
| 29 | 0.00265149253766517 | 0.00530298507533034 | 0.997348507462335 |
| 30 | 0.0226659489670935 | 0.0453318979341869 | 0.977334051032906 |
| 31 | 0.161799853117722 | 0.323599706235445 | 0.838200146882278 |
| 32 | 0.363835174646956 | 0.727670349293912 | 0.636164825353044 |
| 33 | 0.561345823671366 | 0.877308352657268 | 0.438654176328634 |
| 34 | 0.701772620920233 | 0.596454758159534 | 0.298227379079767 |
| 35 | 0.8008679332679 | 0.398264133464201 | 0.199132066732101 |
| 36 | 0.854120438528073 | 0.291759122943854 | 0.145879561471927 |
| 37 | 0.875169064827548 | 0.249661870344903 | 0.124830935172452 |
| 38 | 0.883833127581745 | 0.23233374483651 | 0.116166872418255 |
| 39 | 0.89829229135121 | 0.203415417297582 | 0.101707708648791 |
| 40 | 0.934802878214215 | 0.130394243571569 | 0.0651971217857846 |
| 41 | 0.946340974387085 | 0.107318051225831 | 0.0536590256129155 |
| 42 | 0.930080636889735 | 0.139838726220529 | 0.0699193631102646 |
| 43 | 0.897686569491577 | 0.204626861016846 | 0.102313430508423 |
| 44 | 0.857761782448688 | 0.284476435102624 | 0.142238217551312 |
| 45 | 0.808269533970753 | 0.383460932058494 | 0.191730466029247 |
| 46 | 0.742586978176477 | 0.514826043647045 | 0.257413021823523 |
| 47 | 0.698577203367617 | 0.602845593264766 | 0.301422796632383 |
| 48 | 0.678586605366877 | 0.642826789266245 | 0.321413394633123 |
| 49 | 0.650241899535645 | 0.69951620092871 | 0.349758100464355 |
| 50 | 0.639844411009132 | 0.720311177981735 | 0.360155588990868 |
| 51 | 0.617850822313662 | 0.764298355372676 | 0.382149177686338 |
| 52 | 0.591066964394894 | 0.817866071210211 | 0.408933035605106 |
| 53 | 0.617129069810837 | 0.765741860378327 | 0.382870930189163 |
| 54 | 0.883025827435678 | 0.233948345128644 | 0.116974172564322 |
| 55 | 0.8766018328628 | 0.246796334274398 | 0.123398167137199 |
| Meta Analysis of Goldfeld-Quandt test for Heteroskedasticity | |||
| Description | # significant tests | % significant tests | OK/NOK |
| 1% type I error level | 25 | 0.490196078431373 | NOK |
| 5% type I error level | 26 | 0.509803921568627 | NOK |
| 10% type I error level | 26 | 0.509803921568627 | NOK |