| Multiple Linear Regression - Estimated Regression Equation |
| Y[t] = + 100.937861512697 -0.903708260706107X[t] + 1.14037328685191M1[t] + 0.906224956423668M2[t] + 1.38222495642367M3[t] + 0.661557469496567M4[t] + 0.667483304282443M5[t] + 0.721112478211832M6[t] + 1.2433349738542M7[t] -0.0611100174305318M8[t] + 1.31674165214122M9[t] + 1.44651915649886M10[t] -0.0594808435011405M11[t] + e[t] |
| Multiple Linear Regression - Ordinary Least Squares | |||||
| Variable | Parameter | S.D. | T-STAT H0: parameter = 0 | 2-tail p-value | 1-tail p-value |
| (Intercept) | 100.937861512697 | 0.503342 | 200.5355 | 0 | 0 |
| X | -0.903708260706107 | 0.09529 | -9.4837 | 0 | 0 |
| M1 | 1.14037328685191 | 0.654832 | 1.7415 | 0.088143 | 0.044071 |
| M2 | 0.906224956423668 | 0.654488 | 1.3846 | 0.172703 | 0.086352 |
| M3 | 1.38222495642367 | 0.654488 | 2.1119 | 0.040037 | 0.020018 |
| M4 | 0.661557469496567 | 0.653213 | 1.0128 | 0.316353 | 0.158177 |
| M5 | 0.667483304282443 | 0.653099 | 1.022 | 0.312001 | 0.156001 |
| M6 | 0.721112478211832 | 0.652612 | 1.105 | 0.2748 | 0.1374 |
| M7 | 1.2433349738542 | 0.652887 | 1.9044 | 0.062994 | 0.031497 |
| M8 | -0.0611100174305318 | 0.652387 | -0.0937 | 0.925768 | 0.462884 |
| M9 | 1.31674165214122 | 0.652264 | 2.0187 | 0.049242 | 0.024621 |
| M10 | 1.44651915649886 | 0.652122 | 2.2182 | 0.031412 | 0.015706 |
| M11 | -0.0594808435011405 | 0.652122 | -0.0912 | 0.927712 | 0.463856 |
| Multiple Linear Regression - Regression Statistics | |
| Multiple R | 0.828776724306222 |
| R-squared | 0.68687085875175 |
| Adjusted R-squared | 0.606922992901134 |
| F-TEST (value) | 8.5914846061704 |
| F-TEST (DF numerator) | 12 |
| F-TEST (DF denominator) | 47 |
| p-value | 2.56587797675678e-08 |
| Multiple Linear Regression - Residual Statistics | |
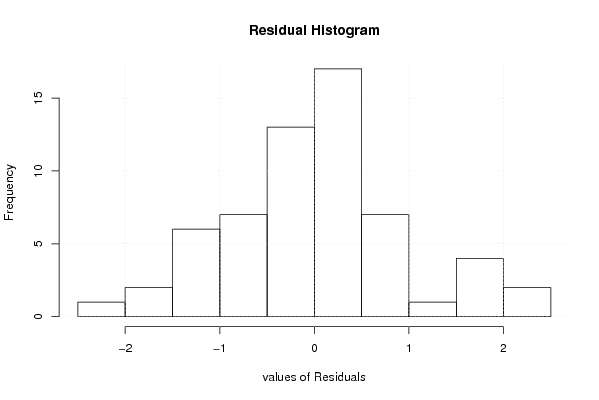
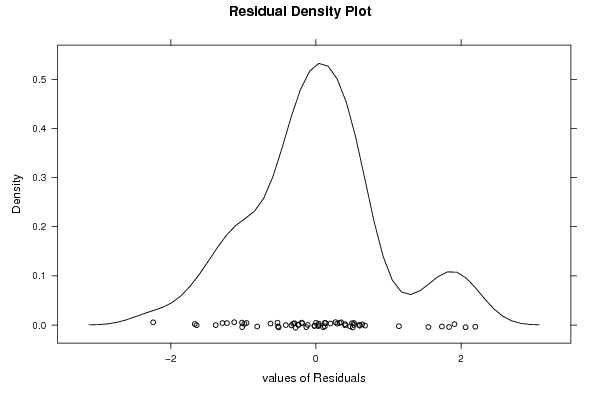
| Residual Standard Deviation | 1.03087971742847 |
| Sum Squared Residuals | 49.9475106148534 |
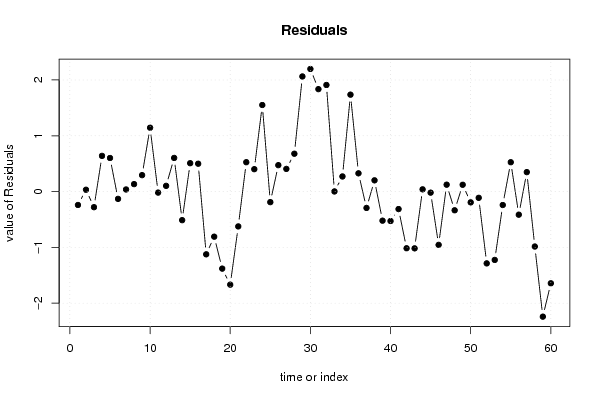
| Multiple Linear Regression - Actuals, Interpolation, and Residuals | |||
| Time or Index | Actuals | Interpolation Forecast | Residuals Prediction Error |
| 1 | 100.03 | 100.270818278137 | -0.24081827813664 |
| 2 | 100.25 | 100.217411599850 | 0.0325884001503753 |
| 3 | 99.6 | 99.880074165214 | -0.280074165214128 |
| 4 | 100.16 | 99.5208899825695 | 0.639110017430531 |
| 5 | 100.49 | 99.8882991216378 | 0.60170087836221 |
| 6 | 99.72 | 99.8515574694966 | -0.131557469496564 |
| 7 | 100.14 | 100.102667486927 | 0.0373325130729031 |
| 8 | 98.48 | 98.3463683652893 | 0.133631634710691 |
| 9 | 100.38 | 100.085703339144 | 0.294296660856486 |
| 10 | 101.45 | 100.305851669572 | 1.14414833042825 |
| 11 | 98.42 | 98.4383683652893 | -0.0183683652893126 |
| 12 | 98.6 | 98.4978492087905 | 0.102150791209539 |
| 13 | 100.06 | 99.4574808435011 | 0.602519156498856 |
| 14 | 98.62 | 99.1329616870023 | -0.512961687002286 |
| 15 | 100.84 | 100.331928295567 | 0.508071704432827 |
| 16 | 100.02 | 99.5208899825695 | 0.499110017430531 |
| 17 | 97.95 | 99.0749616870023 | -1.12496168700228 |
| 18 | 98.32 | 99.1285908609317 | -0.808590860931683 |
| 19 | 98.27 | 99.650813356574 | -1.38081335657405 |
| 20 | 97.22 | 98.888593321713 | -1.66859332171298 |
| 21 | 99.28 | 99.9049616870023 | -0.624961687002287 |
| 22 | 100.38 | 99.8539975392187 | 0.526002460781295 |
| 23 | 99.02 | 98.6191100174305 | 0.40088998256946 |
| 24 | 100.32 | 98.7689616870023 | 1.55103831299771 |
| 25 | 99.81 | 99.9997057999248 | -0.189705799924808 |
| 26 | 100.6 | 100.127040773779 | 0.472959226220986 |
| 27 | 101.19 | 100.783782425920 | 0.406217574079767 |
| 28 | 100.47 | 99.7920024607813 | 0.677997539218702 |
| 29 | 101.77 | 99.7075574694966 | 2.06244253050343 |
| 30 | 102.32 | 100.122669947708 | 2.1973300522916 |
| 31 | 102.39 | 100.554521617280 | 1.83547838271985 |
| 32 | 101.16 | 99.2500766259954 | 1.90992337400458 |
| 33 | 100.63 | 100.627928295567 | 0.00207170443282080 |
| 34 | 101.48 | 101.209559930278 | 0.270440069722142 |
| 35 | 101.44 | 99.7035599302779 | 1.73644006972213 |
| 36 | 100.09 | 99.763040773779 | 0.326959226220998 |
| 37 | 100.7 | 100.993784886702 | -0.293784886701526 |
| 38 | 100.78 | 100.578894904132 | 0.201105095867939 |
| 39 | 99.81 | 100.331928295567 | -0.521928295567174 |
| 40 | 98.45 | 98.9786650261458 | -0.528665026145798 |
| 41 | 98.49 | 98.8038492087905 | -0.31384920879046 |
| 42 | 97.48 | 98.4959950784374 | -1.01599507843740 |
| 43 | 97.91 | 98.9278467480092 | -1.01784674800916 |
| 44 | 96.94 | 96.9004351481595 | 0.0395648518404578 |
| 45 | 98.53 | 98.5493992959431 | -0.0193992959431265 |
| 46 | 96.82 | 97.7754685395947 | -0.95546853959466 |
| 47 | 95.76 | 95.6368727571004 | 0.123127242899625 |
| 48 | 95.27 | 95.605982774531 | -0.335982774530914 |
| 49 | 97.32 | 97.1982101917359 | 0.121789808264117 |
| 50 | 96.68 | 96.873691035237 | -0.193691035237014 |
| 51 | 97.87 | 97.9822868177313 | -0.112286817731292 |
| 52 | 97.42 | 98.707552547934 | -1.28755254793397 |
| 53 | 97.94 | 99.1653325130729 | -1.2253325130729 |
| 54 | 99.52 | 99.761186643426 | -0.241186643425955 |
| 55 | 100.99 | 100.464150791210 | 0.525849208790454 |
| 56 | 99.92 | 100.334526538843 | -0.414526538842747 |
| 57 | 101.97 | 101.622007382344 | 0.347992617656106 |
| 58 | 101.58 | 102.565122321337 | -0.985122321337025 |
| 59 | 99.54 | 101.782088929902 | -2.24208892990191 |
| 60 | 100.83 | 102.474165555897 | -1.64416555589733 |
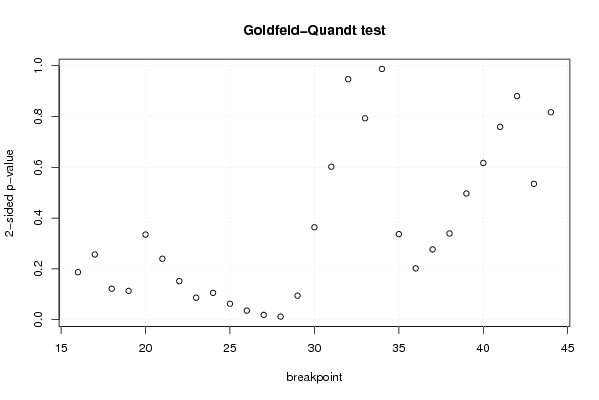
| Goldfeld-Quandt test for Heteroskedasticity | |||
| p-values | Alternative Hypothesis | ||
| breakpoint index | greater | 2-sided | less |
| 16 | 0.093377256290533 | 0.186754512581066 | 0.906622743709467 |
| 17 | 0.128343192461834 | 0.256686384923668 | 0.871656807538166 |
| 18 | 0.0609806336679589 | 0.121961267335918 | 0.93901936633204 |
| 19 | 0.05667594053722 | 0.11335188107444 | 0.94332405946278 |
| 20 | 0.167555224161334 | 0.335110448322668 | 0.832444775838666 |
| 21 | 0.119938374781386 | 0.239876749562772 | 0.880061625218614 |
| 22 | 0.0757757315049425 | 0.151551463009885 | 0.924224268495057 |
| 23 | 0.0432512796556601 | 0.0865025593113203 | 0.95674872034434 |
| 24 | 0.0527618225758892 | 0.105523645151778 | 0.94723817742411 |
| 25 | 0.0312898219827941 | 0.0625796439655881 | 0.968710178017206 |
| 26 | 0.0178183108396721 | 0.0356366216793442 | 0.982181689160328 |
| 27 | 0.00945218629562 | 0.01890437259124 | 0.99054781370438 |
| 28 | 0.00591539844874431 | 0.0118307968974886 | 0.994084601551256 |
| 29 | 0.0471966389344575 | 0.094393277868915 | 0.952803361065543 |
| 30 | 0.181854678661941 | 0.363709357323881 | 0.81814532133806 |
| 31 | 0.301158267732361 | 0.602316535464722 | 0.698841732267639 |
| 32 | 0.473421265777375 | 0.94684253155475 | 0.526578734222624 |
| 33 | 0.39652107770793 | 0.79304215541586 | 0.60347892229207 |
| 34 | 0.493648509761575 | 0.98729701952315 | 0.506351490238425 |
| 35 | 0.831659113601575 | 0.33668177279685 | 0.168340886398425 |
| 36 | 0.899017117404902 | 0.201965765190196 | 0.100982882595098 |
| 37 | 0.861632025541726 | 0.276735948916549 | 0.138367974458274 |
| 38 | 0.830357879625222 | 0.339284240749556 | 0.169642120374778 |
| 39 | 0.751528170692735 | 0.49694365861453 | 0.248471829307265 |
| 40 | 0.691369985331837 | 0.617260029336326 | 0.308630014668163 |
| 41 | 0.620353882613647 | 0.759292234772705 | 0.379646117386353 |
| 42 | 0.559848203396805 | 0.88030359320639 | 0.440151796603195 |
| 43 | 0.732549255768553 | 0.534901488462894 | 0.267450744231447 |
| 44 | 0.591623034770257 | 0.816753930459486 | 0.408376965229743 |
| Meta Analysis of Goldfeld-Quandt test for Heteroskedasticity | |||
| Description | # significant tests | % significant tests | OK/NOK |
| 1% type I error level | 0 | 0 | OK |
| 5% type I error level | 3 | 0.103448275862069 | NOK |
| 10% type I error level | 6 | 0.206896551724138 | NOK |