| Multiple Linear Regression - Estimated Regression Equation |
| nwwmb[t] = + 266613.595744681 -1219.98036006547dummy_variable[t] + e[t] |
| Multiple Linear Regression - Ordinary Least Squares | |||||
| Variable | Parameter | S.D. | T-STAT H0: parameter = 0 | 2-tail p-value | 1-tail p-value |
| (Intercept) | 266613.595744681 | 2643.821107 | 100.844 | 0 | 0 |
| dummy_variable | -1219.98036006547 | 5679.838858 | -0.2148 | 0.830683 | 0.415342 |
| Multiple Linear Regression - Regression Statistics | |
| Multiple R | 0.0281922780235840 |
| R-squared | 0.00079480454015906 |
| Adjusted R-squared | -0.0164328712436312 |
| F-TEST (value) | 0.0461353319004817 |
| F-TEST (DF numerator) | 1 |
| F-TEST (DF denominator) | 58 |
| p-value | 0.830683425738388 |
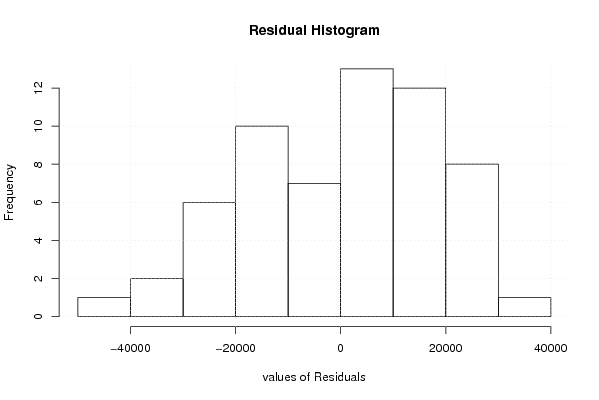
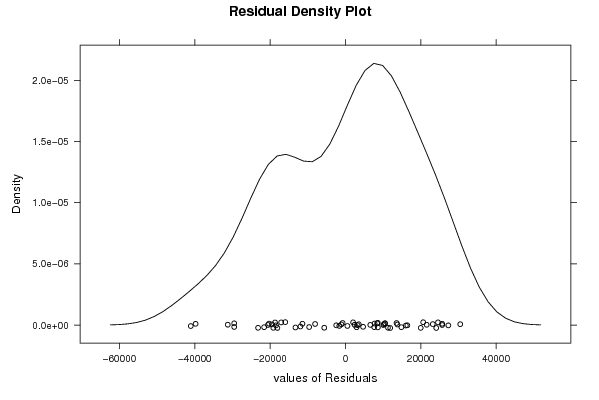
| Multiple Linear Regression - Residual Statistics | |
| Residual Standard Deviation | 18125.1243374551 |
| Sum Squared Residuals | 19054167670.3961 |
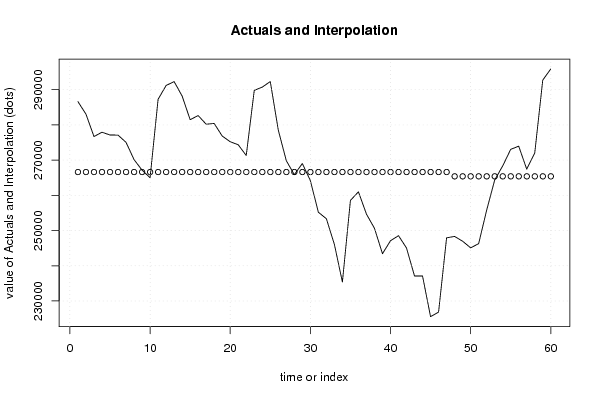
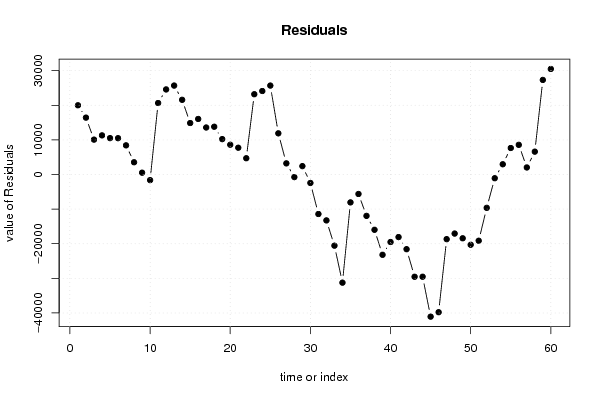
| Multiple Linear Regression - Actuals, Interpolation, and Residuals | |||
| Time or Index | Actuals | Interpolation Forecast | Residuals Prediction Error |
| 1 | 286602 | 266613.595744680 | 19988.4042553195 |
| 2 | 283042 | 266613.595744681 | 16428.4042553191 |
| 3 | 276687 | 266613.595744681 | 10073.4042553191 |
| 4 | 277915 | 266613.595744681 | 11301.4042553191 |
| 5 | 277128 | 266613.595744681 | 10514.4042553191 |
| 6 | 277103 | 266613.595744681 | 10489.4042553191 |
| 7 | 275037 | 266613.595744681 | 8423.40425531914 |
| 8 | 270150 | 266613.595744681 | 3536.40425531914 |
| 9 | 267140 | 266613.595744681 | 526.404255319142 |
| 10 | 264993 | 266613.595744681 | -1620.59574468086 |
| 11 | 287259 | 266613.595744681 | 20645.4042553191 |
| 12 | 291186 | 266613.595744681 | 24572.4042553191 |
| 13 | 292300 | 266613.595744681 | 25686.4042553191 |
| 14 | 288186 | 266613.595744681 | 21572.4042553191 |
| 15 | 281477 | 266613.595744681 | 14863.4042553191 |
| 16 | 282656 | 266613.595744681 | 16042.4042553191 |
| 17 | 280190 | 266613.595744681 | 13576.4042553191 |
| 18 | 280408 | 266613.595744681 | 13794.4042553191 |
| 19 | 276836 | 266613.595744681 | 10222.4042553191 |
| 20 | 275216 | 266613.595744681 | 8602.40425531914 |
| 21 | 274352 | 266613.595744681 | 7738.40425531914 |
| 22 | 271311 | 266613.595744681 | 4697.40425531914 |
| 23 | 289802 | 266613.595744681 | 23188.4042553191 |
| 24 | 290726 | 266613.595744681 | 24112.4042553191 |
| 25 | 292300 | 266613.595744681 | 25686.4042553191 |
| 26 | 278506 | 266613.595744681 | 11892.4042553191 |
| 27 | 269826 | 266613.595744681 | 3212.40425531914 |
| 28 | 265861 | 266613.595744681 | -752.595744680858 |
| 29 | 269034 | 266613.595744681 | 2420.40425531914 |
| 30 | 264176 | 266613.595744681 | -2437.59574468086 |
| 31 | 255198 | 266613.595744681 | -11415.5957446809 |
| 32 | 253353 | 266613.595744681 | -13260.5957446809 |
| 33 | 246057 | 266613.595744681 | -20556.5957446809 |
| 34 | 235372 | 266613.595744681 | -31241.5957446809 |
| 35 | 258556 | 266613.595744681 | -8057.59574468086 |
| 36 | 260993 | 266613.595744681 | -5620.59574468086 |
| 37 | 254663 | 266613.595744681 | -11950.5957446809 |
| 38 | 250643 | 266613.595744681 | -15970.5957446809 |
| 39 | 243422 | 266613.595744681 | -23191.5957446809 |
| 40 | 247105 | 266613.595744681 | -19508.5957446809 |
| 41 | 248541 | 266613.595744681 | -18072.5957446809 |
| 42 | 245039 | 266613.595744681 | -21574.5957446809 |
| 43 | 237080 | 266613.595744681 | -29533.5957446809 |
| 44 | 237085 | 266613.595744681 | -29528.5957446809 |
| 45 | 225554 | 266613.595744681 | -41059.5957446809 |
| 46 | 226839 | 266613.595744681 | -39774.5957446809 |
| 47 | 247934 | 266613.595744681 | -18679.5957446809 |
| 48 | 248333 | 265393.615384615 | -17060.6153846154 |
| 49 | 246969 | 265393.615384615 | -18424.6153846154 |
| 50 | 245098 | 265393.615384615 | -20295.6153846154 |
| 51 | 246263 | 265393.615384615 | -19130.6153846154 |
| 52 | 255765 | 265393.615384615 | -9628.61538461538 |
| 53 | 264319 | 265393.615384615 | -1074.61538461538 |
| 54 | 268347 | 265393.615384615 | 2953.38461538462 |
| 55 | 273046 | 265393.615384615 | 7652.38461538462 |
| 56 | 273963 | 265393.615384615 | 8569.38461538462 |
| 57 | 267430 | 265393.615384615 | 2036.38461538462 |
| 58 | 271993 | 265393.615384615 | 6599.38461538462 |
| 59 | 292710 | 265393.615384615 | 27316.3846153846 |
| 60 | 295881 | 265393.615384615 | 30487.3846153846 |
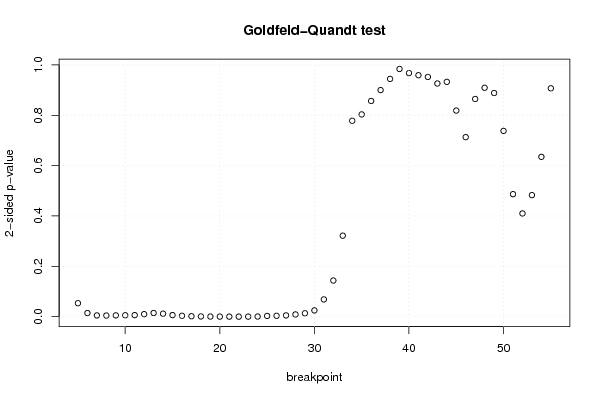
| Goldfeld-Quandt test for Heteroskedasticity | |||
| p-values | Alternative Hypothesis | ||
| breakpoint index | greater | 2-sided | less |
| 5 | 0.0267686202906719 | 0.0535372405813437 | 0.973231379709328 |
| 6 | 0.00724331702714891 | 0.0144866340542978 | 0.992756682972851 |
| 7 | 0.0024757133828431 | 0.0049514267656862 | 0.997524286617157 |
| 8 | 0.00225408579966423 | 0.00450817159932846 | 0.997745914200336 |
| 9 | 0.00258189808369808 | 0.00516379616739616 | 0.997418101916302 |
| 10 | 0.00286671662914624 | 0.00573343325829248 | 0.997133283370854 |
| 11 | 0.00306784674628177 | 0.00613569349256355 | 0.996932153253718 |
| 12 | 0.00500169567999027 | 0.0100033913599805 | 0.99499830432001 |
| 13 | 0.00734191981545878 | 0.0146838396309176 | 0.992658080184541 |
| 14 | 0.00595471685363854 | 0.0119094337072771 | 0.994045283146362 |
| 15 | 0.00316638373929421 | 0.00633276747858842 | 0.996833616260706 |
| 16 | 0.0017640181070023 | 0.0035280362140046 | 0.998235981892998 |
| 17 | 0.000912013535613562 | 0.00182402707122712 | 0.999087986464386 |
| 18 | 0.000478201095184338 | 0.000956402190368676 | 0.999521798904816 |
| 19 | 0.000250542652921697 | 0.000501085305843394 | 0.999749457347078 |
| 20 | 0.000138358971021444 | 0.000276717942042889 | 0.999861641028979 |
| 21 | 7.9696226487747e-05 | 0.000159392452975494 | 0.999920303773512 |
| 22 | 5.63625522299001e-05 | 0.000112725104459800 | 0.99994363744777 |
| 23 | 0.000114739875428332 | 0.000229479750856664 | 0.999885260124572 |
| 24 | 0.000318122369347602 | 0.000636244738695204 | 0.999681877630652 |
| 25 | 0.00148712768807063 | 0.00297425537614125 | 0.99851287231193 |
| 26 | 0.00177964908075136 | 0.00355929816150273 | 0.99822035091925 |
| 27 | 0.00251353850393375 | 0.0050270770078675 | 0.997486461496066 |
| 28 | 0.00444593615769331 | 0.00889187231538662 | 0.995554063842307 |
| 29 | 0.00676380572847515 | 0.0135276114569503 | 0.993236194271525 |
| 30 | 0.0124275002865196 | 0.0248550005730391 | 0.98757249971348 |
| 31 | 0.0342613178597834 | 0.0685226357195668 | 0.965738682140217 |
| 32 | 0.0718149776446172 | 0.143629955289234 | 0.928185022355383 |
| 33 | 0.160910913799911 | 0.321821827599822 | 0.839089086200089 |
| 34 | 0.389076107085819 | 0.778152214171639 | 0.610923892914181 |
| 35 | 0.401726215654362 | 0.803452431308725 | 0.598273784345638 |
| 36 | 0.428381699316674 | 0.856763398633348 | 0.571618300683326 |
| 37 | 0.450007658342556 | 0.900015316685113 | 0.549992341657444 |
| 38 | 0.472222309567326 | 0.944444619134653 | 0.527777690432674 |
| 39 | 0.508001750459405 | 0.983996499081191 | 0.491998249540596 |
| 40 | 0.516158898479703 | 0.967682203040594 | 0.483841101520297 |
| 41 | 0.520448362036158 | 0.959103275927683 | 0.479551637963842 |
| 42 | 0.523902319756593 | 0.952195360486814 | 0.476097680243407 |
| 43 | 0.536874808675784 | 0.926250382648432 | 0.463125191324216 |
| 44 | 0.533602934998736 | 0.932794130002529 | 0.466397065001264 |
| 45 | 0.590687724703233 | 0.818624550593535 | 0.409312275296767 |
| 46 | 0.643441530555671 | 0.713116938888659 | 0.356558469444329 |
| 47 | 0.567638927913108 | 0.864722144173784 | 0.432361072086892 |
| 48 | 0.545343445062647 | 0.909313109874706 | 0.454656554937353 |
| 49 | 0.555852115132358 | 0.888295769735284 | 0.444147884867642 |
| 50 | 0.631005535291605 | 0.73798892941679 | 0.368994464708395 |
| 51 | 0.756652386246276 | 0.486695227507448 | 0.243347613753724 |
| 52 | 0.794969536086868 | 0.410060927826263 | 0.205030463913132 |
| 53 | 0.758577043520898 | 0.482845912958204 | 0.241422956479102 |
| 54 | 0.682558156947825 | 0.63488368610435 | 0.317441843052175 |
| 55 | 0.546431604047098 | 0.907136791905804 | 0.453568395952902 |
| Meta Analysis of Goldfeld-Quandt test for Heteroskedasticity | |||
| Description | # significant tests | % significant tests | OK/NOK |
| 1% type I error level | 19 | 0.372549019607843 | NOK |
| 5% type I error level | 25 | 0.490196078431373 | NOK |
| 10% type I error level | 27 | 0.529411764705882 | NOK |