Free Statistics

of Irreproducible Research!

Author's title

Author*The author of this computation has been verified*
R Software Modulerwasp_multipleregression.wasp
Title produced by softwareMultiple Regression
Date of computationThu, 19 Nov 2009 14:22:17 -0700
Cite this page as followsStatistical Computations at FreeStatistics.org, Office for Research Development and Education, URL https://freestatistics.org/blog/index.php?v=date/2009/Nov/19/t1258665827hr1xta6gr7zhaav.htm/, Retrieved Sat, 20 Apr 2024 14:02:57 +0000
Statistical Computations at FreeStatistics.org, Office for Research Development and Education, URL https://freestatistics.org/blog/index.php?pk=57962, Retrieved Sat, 20 Apr 2024 14:02:57 +0000
QR Codes:

Original text written by user:
IsPrivate?No (this computation is public)
User-defined keywords
Estimated Impact132
Family? (F = Feedback message, R = changed R code, M = changed R Module, P = changed Parameters, D = changed Data)
-       [Multiple Regression] [Model 4] [2009-11-19 21:22:17] [e458b4e05bf28a297f8af8d9f96e59d6] [Current]
Feedback Forum

Post a new message
Dataseries X:
3,7	91,1	88	109,9	96,8	96,2
3,7	106,4	91,1	88	109,9	96,8
4,1	68,6	106,4	91,1	88	109,9
4,1	100,1	68,6	106,4	91,1	88
3,8	108	100,1	68,6	106,4	91,1
3,7	106	108	100,1	68,6	106,4
3,5	108,6	106	108	100,1	68,6
3,6	91,5	108,6	106	108	100,1
4,1	99,2	91,5	108,6	106	108
3,8	98	99,2	91,5	108,6	106
3,7	96,6	98	99,2	91,5	108,6
3,6	102,8	96,6	98	99,2	91,5
3,3	96,9	102,8	96,6	98	99,2
3,4	110	96,9	102,8	96,6	98
3,7	70,5	110	96,9	102,8	96,6
3,7	101,9	70,5	110	96,9	102,8
3,4	109,6	101,9	70,5	110	96,9
3,3	107,8	109,6	101,9	70,5	110
3	113	107,8	109,6	101,9	70,5
3	93,8	113	107,8	109,6	101,9
3,3	108	93,8	113	107,8	109,6
3	102,8	108	93,8	113	107,8
2,9	116,3	102,8	108	93,8	113
2,8	89,2	116,3	102,8	108	93,8
2,5	106,7	89,2	116,3	102,8	108
2,6	112,1	106,7	89,2	116,3	102,8
2,8	74,2	112,1	106,7	89,2	116,3
2,7	108,8	74,2	112,1	106,7	89,2
2,4	111,5	108,8	74,2	112,1	106,7
2,2	118,8	111,5	108,8	74,2	112,1
2,1	118,9	118,8	111,5	108,8	74,2
2,1	97,6	118,9	118,8	111,5	108,8
2,3	116,4	97,6	118,9	118,8	111,5
2,1	107,9	116,4	97,6	118,9	118,8
2	121,2	107,9	116,4	97,6	118,9
1,9	97,9	121,2	107,9	116,4	97,6
1,7	113,4	97,9	121,2	107,9	116,4
1,8	117,6	113,4	97,9	121,2	107,9
2,1	79,6	117,6	113,4	97,9	121,2
2	115,9	79,6	117,6	113,4	97,9
1,8	115,7	115,9	79,6	117,6	113,4
1,7	129,1	115,7	115,9	79,6	117,6
1,6	123,3	129,1	115,7	115,9	79,6
1,6	96,7	123,3	129,1	115,7	115,9
1,8	121,2	96,7	123,3	129,1	115,7
1,7	118,2	121,2	96,7	123,3	129,1
1,7	102,1	118,2	121,2	96,7	123,3
1,5	125,4	102,1	118,2	121,2	96,7
1,5	116,7	125,4	102,1	118,2	121,2
1,5	121,3	116,7	125,4	102,1	118,2
1,8	85,3	121,3	116,7	125,4	102,1
1,8	114,2	85,3	121,3	116,7	125,4
1,7	124,4	114,2	85,3	121,3	116,7
1,7	131	124,4	114,2	85,3	121,3
1,8	118,3	131	124,4	114,2	85,3
2	99,6	118,3	131	124,4	114,2


Summary of computational transaction
Raw Inputview raw input (R code)
Raw Outputview raw output of R engine
Computing time4 seconds
R Server'Gwilym Jenkins' @ 72.249.127.135

\begin{tabular}{lllllllll}
\hline
Summary of computational transaction \tabularnewline
Raw Input & view raw input (R code)  \tabularnewline
Raw Output & view raw output of R engine  \tabularnewline
Computing time & 4 seconds \tabularnewline
R Server & 'Gwilym Jenkins' @ 72.249.127.135 \tabularnewline
\hline
\end{tabular}
%Source: https://freestatistics.org/blog/index.php?pk=57962&T=0

[TABLE]
[ROW][C]Summary of computational transaction[/C][/ROW]
[ROW][C]Raw Input[/C][C]view raw input (R code) [/C][/ROW]
[ROW][C]Raw Output[/C][C]view raw output of R engine [/C][/ROW]
[ROW][C]Computing time[/C][C]4 seconds[/C][/ROW]
[ROW][C]R Server[/C][C]'Gwilym Jenkins' @ 72.249.127.135[/C][/ROW]
[/TABLE]
Source: https://freestatistics.org/blog/index.php?pk=57962&T=0

Globally Unique Identifier (entire table): ba.freestatistics.org/blog/index.php?pk=57962&T=0

As an alternative you can also use a QR Code:  

The GUIDs for individual cells are displayed in the table below:

Summary of computational transaction
Raw Inputview raw input (R code)
Raw Outputview raw output of R engine
Computing time4 seconds
R Server'Gwilym Jenkins' @ 72.249.127.135


Multiple Linear Regression - Estimated Regression Equation
unempl[t] = + 11.788943645127 -0.0216975031746144proman[t] -0.0215687859575112`Y(t-1)`[t] -0.0199890687288202`Y(t-2)`[t] -0.0135066127680023`Y(t-3)`[t] -0.00627148987336246`Y(t-4)`[t] -0.104253154848955M1[t] + 0.117848899752461M2[t] -0.204196193128170M3[t] -0.162831247286175M4[t] -0.175727991703866M5[t] + 0.157906470768276M6[t] + 0.425400895722570M7[t] + 0.384400491946936M8[t] + 0.573141529469105M9[t] + 0.232224239562924M10[t] + 0.172740476997167M11[t] -0.0167897060162920t + e[t]

\begin{tabular}{lllllllll}
\hline
Multiple Linear Regression - Estimated Regression Equation \tabularnewline
unempl[t] =  +  11.788943645127 -0.0216975031746144proman[t] -0.0215687859575112`Y(t-1)`[t] -0.0199890687288202`Y(t-2)`[t] -0.0135066127680023`Y(t-3)`[t] -0.00627148987336246`Y(t-4)`[t] -0.104253154848955M1[t] +  0.117848899752461M2[t] -0.204196193128170M3[t] -0.162831247286175M4[t] -0.175727991703866M5[t] +  0.157906470768276M6[t] +  0.425400895722570M7[t] +  0.384400491946936M8[t] +  0.573141529469105M9[t] +  0.232224239562924M10[t] +  0.172740476997167M11[t] -0.0167897060162920t  + e[t] \tabularnewline
\hline
\end{tabular}
%Source: https://freestatistics.org/blog/index.php?pk=57962&T=1

[TABLE]
[ROW][C]Multiple Linear Regression - Estimated Regression Equation[/C][/ROW]
[ROW][C]unempl[t] =  +  11.788943645127 -0.0216975031746144proman[t] -0.0215687859575112`Y(t-1)`[t] -0.0199890687288202`Y(t-2)`[t] -0.0135066127680023`Y(t-3)`[t] -0.00627148987336246`Y(t-4)`[t] -0.104253154848955M1[t] +  0.117848899752461M2[t] -0.204196193128170M3[t] -0.162831247286175M4[t] -0.175727991703866M5[t] +  0.157906470768276M6[t] +  0.425400895722570M7[t] +  0.384400491946936M8[t] +  0.573141529469105M9[t] +  0.232224239562924M10[t] +  0.172740476997167M11[t] -0.0167897060162920t  + e[t][/C][/ROW]
[/TABLE]
Source: https://freestatistics.org/blog/index.php?pk=57962&T=1

Globally Unique Identifier (entire table): ba.freestatistics.org/blog/index.php?pk=57962&T=1

As an alternative you can also use a QR Code:  

The GUIDs for individual cells are displayed in the table below:

Multiple Linear Regression - Estimated Regression Equation
unempl[t] = + 11.788943645127 -0.0216975031746144proman[t] -0.0215687859575112`Y(t-1)`[t] -0.0199890687288202`Y(t-2)`[t] -0.0135066127680023`Y(t-3)`[t] -0.00627148987336246`Y(t-4)`[t] -0.104253154848955M1[t] + 0.117848899752461M2[t] -0.204196193128170M3[t] -0.162831247286175M4[t] -0.175727991703866M5[t] + 0.157906470768276M6[t] + 0.425400895722570M7[t] + 0.384400491946936M8[t] + 0.573141529469105M9[t] + 0.232224239562924M10[t] + 0.172740476997167M11[t] -0.0167897060162920t + e[t]


Multiple Linear Regression - Ordinary Least Squares
VariableParameterS.D.T-STATH0: parameter = 02-tail p-value1-tail p-value
(Intercept)11.7889436451272.8598384.12220.0001969.8e-05
proman-0.02169750317461440.007946-2.73060.0095310.004766
`Y(t-1)`-0.02156878595751120.009729-2.2170.0326790.01634
`Y(t-2)`-0.01998906872882020.009947-2.00960.0516090.025805
`Y(t-3)`-0.01350661276800230.009366-1.44210.1574720.078736
`Y(t-4)`-0.006271489873362460.007982-0.78570.4368970.218449
M1-0.1042531548489550.20647-0.50490.6165230.308261
M20.1178488997524610.2031580.58010.5652810.282641
M3-0.2041961931281700.270803-0.7540.4554720.227736
M4-0.1628312472861750.320756-0.50760.6146340.307317
M5-0.1757279917038660.321887-0.54590.5883050.294152
M60.1579064707682760.34620.45610.6509040.325452
M70.4254008957225700.298071.42720.1616940.080847
M80.3844004919469360.2599121.4790.1473920.073696
M90.5731415294691050.2844912.01460.0510610.02553
M100.2322242395629240.2556560.90830.3694190.18471
M110.1727404769971670.2377660.72650.4719750.235987
t-0.01678970601629200.012274-1.36790.1793650.089682

\begin{tabular}{lllllllll}
\hline
Multiple Linear Regression - Ordinary Least Squares \tabularnewline
Variable & Parameter & S.D. & T-STATH0: parameter = 0 & 2-tail p-value & 1-tail p-value \tabularnewline
(Intercept) & 11.788943645127 & 2.859838 & 4.1222 & 0.000196 & 9.8e-05 \tabularnewline
proman & -0.0216975031746144 & 0.007946 & -2.7306 & 0.009531 & 0.004766 \tabularnewline
`Y(t-1)` & -0.0215687859575112 & 0.009729 & -2.217 & 0.032679 & 0.01634 \tabularnewline
`Y(t-2)` & -0.0199890687288202 & 0.009947 & -2.0096 & 0.051609 & 0.025805 \tabularnewline
`Y(t-3)` & -0.0135066127680023 & 0.009366 & -1.4421 & 0.157472 & 0.078736 \tabularnewline
`Y(t-4)` & -0.00627148987336246 & 0.007982 & -0.7857 & 0.436897 & 0.218449 \tabularnewline
M1 & -0.104253154848955 & 0.20647 & -0.5049 & 0.616523 & 0.308261 \tabularnewline
M2 & 0.117848899752461 & 0.203158 & 0.5801 & 0.565281 & 0.282641 \tabularnewline
M3 & -0.204196193128170 & 0.270803 & -0.754 & 0.455472 & 0.227736 \tabularnewline
M4 & -0.162831247286175 & 0.320756 & -0.5076 & 0.614634 & 0.307317 \tabularnewline
M5 & -0.175727991703866 & 0.321887 & -0.5459 & 0.588305 & 0.294152 \tabularnewline
M6 & 0.157906470768276 & 0.3462 & 0.4561 & 0.650904 & 0.325452 \tabularnewline
M7 & 0.425400895722570 & 0.29807 & 1.4272 & 0.161694 & 0.080847 \tabularnewline
M8 & 0.384400491946936 & 0.259912 & 1.479 & 0.147392 & 0.073696 \tabularnewline
M9 & 0.573141529469105 & 0.284491 & 2.0146 & 0.051061 & 0.02553 \tabularnewline
M10 & 0.232224239562924 & 0.255656 & 0.9083 & 0.369419 & 0.18471 \tabularnewline
M11 & 0.172740476997167 & 0.237766 & 0.7265 & 0.471975 & 0.235987 \tabularnewline
t & -0.0167897060162920 & 0.012274 & -1.3679 & 0.179365 & 0.089682 \tabularnewline
\hline
\end{tabular}
%Source: https://freestatistics.org/blog/index.php?pk=57962&T=2

[TABLE]
[ROW][C]Multiple Linear Regression - Ordinary Least Squares[/C][/ROW]
[ROW][C]Variable[/C][C]Parameter[/C][C]S.D.[/C][C]T-STATH0: parameter = 0[/C][C]2-tail p-value[/C][C]1-tail p-value[/C][/ROW]
[ROW][C](Intercept)[/C][C]11.788943645127[/C][C]2.859838[/C][C]4.1222[/C][C]0.000196[/C][C]9.8e-05[/C][/ROW]
[ROW][C]proman[/C][C]-0.0216975031746144[/C][C]0.007946[/C][C]-2.7306[/C][C]0.009531[/C][C]0.004766[/C][/ROW]
[ROW][C]`Y(t-1)`[/C][C]-0.0215687859575112[/C][C]0.009729[/C][C]-2.217[/C][C]0.032679[/C][C]0.01634[/C][/ROW]
[ROW][C]`Y(t-2)`[/C][C]-0.0199890687288202[/C][C]0.009947[/C][C]-2.0096[/C][C]0.051609[/C][C]0.025805[/C][/ROW]
[ROW][C]`Y(t-3)`[/C][C]-0.0135066127680023[/C][C]0.009366[/C][C]-1.4421[/C][C]0.157472[/C][C]0.078736[/C][/ROW]
[ROW][C]`Y(t-4)`[/C][C]-0.00627148987336246[/C][C]0.007982[/C][C]-0.7857[/C][C]0.436897[/C][C]0.218449[/C][/ROW]
[ROW][C]M1[/C][C]-0.104253154848955[/C][C]0.20647[/C][C]-0.5049[/C][C]0.616523[/C][C]0.308261[/C][/ROW]
[ROW][C]M2[/C][C]0.117848899752461[/C][C]0.203158[/C][C]0.5801[/C][C]0.565281[/C][C]0.282641[/C][/ROW]
[ROW][C]M3[/C][C]-0.204196193128170[/C][C]0.270803[/C][C]-0.754[/C][C]0.455472[/C][C]0.227736[/C][/ROW]
[ROW][C]M4[/C][C]-0.162831247286175[/C][C]0.320756[/C][C]-0.5076[/C][C]0.614634[/C][C]0.307317[/C][/ROW]
[ROW][C]M5[/C][C]-0.175727991703866[/C][C]0.321887[/C][C]-0.5459[/C][C]0.588305[/C][C]0.294152[/C][/ROW]
[ROW][C]M6[/C][C]0.157906470768276[/C][C]0.3462[/C][C]0.4561[/C][C]0.650904[/C][C]0.325452[/C][/ROW]
[ROW][C]M7[/C][C]0.425400895722570[/C][C]0.29807[/C][C]1.4272[/C][C]0.161694[/C][C]0.080847[/C][/ROW]
[ROW][C]M8[/C][C]0.384400491946936[/C][C]0.259912[/C][C]1.479[/C][C]0.147392[/C][C]0.073696[/C][/ROW]
[ROW][C]M9[/C][C]0.573141529469105[/C][C]0.284491[/C][C]2.0146[/C][C]0.051061[/C][C]0.02553[/C][/ROW]
[ROW][C]M10[/C][C]0.232224239562924[/C][C]0.255656[/C][C]0.9083[/C][C]0.369419[/C][C]0.18471[/C][/ROW]
[ROW][C]M11[/C][C]0.172740476997167[/C][C]0.237766[/C][C]0.7265[/C][C]0.471975[/C][C]0.235987[/C][/ROW]
[ROW][C]t[/C][C]-0.0167897060162920[/C][C]0.012274[/C][C]-1.3679[/C][C]0.179365[/C][C]0.089682[/C][/ROW]
[/TABLE]
Source: https://freestatistics.org/blog/index.php?pk=57962&T=2

Globally Unique Identifier (entire table): ba.freestatistics.org/blog/index.php?pk=57962&T=2

As an alternative you can also use a QR Code:  

The GUIDs for individual cells are displayed in the table below:

Multiple Linear Regression - Ordinary Least Squares
VariableParameterS.D.T-STATH0: parameter = 02-tail p-value1-tail p-value
(Intercept)11.7889436451272.8598384.12220.0001969.8e-05
proman-0.02169750317461440.007946-2.73060.0095310.004766
`Y(t-1)`-0.02156878595751120.009729-2.2170.0326790.01634
`Y(t-2)`-0.01998906872882020.009947-2.00960.0516090.025805
`Y(t-3)`-0.01350661276800230.009366-1.44210.1574720.078736
`Y(t-4)`-0.006271489873362460.007982-0.78570.4368970.218449
M1-0.1042531548489550.20647-0.50490.6165230.308261
M20.1178488997524610.2031580.58010.5652810.282641
M3-0.2041961931281700.270803-0.7540.4554720.227736
M4-0.1628312472861750.320756-0.50760.6146340.307317
M5-0.1757279917038660.321887-0.54590.5883050.294152
M60.1579064707682760.34620.45610.6509040.325452
M70.4254008957225700.298071.42720.1616940.080847
M80.3844004919469360.2599121.4790.1473920.073696
M90.5731415294691050.2844912.01460.0510610.02553
M100.2322242395629240.2556560.90830.3694190.18471
M110.1727404769971670.2377660.72650.4719750.235987
t-0.01678970601629200.012274-1.36790.1793650.089682


Multiple Linear Regression - Regression Statistics
Multiple R0.971181360953543
R-squared0.943193235863577
Adjusted R-squared0.917779683486755
F-TEST (value)37.1137895984914
F-TEST (DF numerator)17
F-TEST (DF denominator)38
p-value0
Multiple Linear Regression - Residual Statistics
Residual Standard Deviation0.245413358624484
Sum Squared Residuals2.28865323047128

\begin{tabular}{lllllllll}
\hline
Multiple Linear Regression - Regression Statistics \tabularnewline
Multiple R & 0.971181360953543 \tabularnewline
R-squared & 0.943193235863577 \tabularnewline
Adjusted R-squared & 0.917779683486755 \tabularnewline
F-TEST (value) & 37.1137895984914 \tabularnewline
F-TEST (DF numerator) & 17 \tabularnewline
F-TEST (DF denominator) & 38 \tabularnewline
p-value & 0 \tabularnewline
Multiple Linear Regression - Residual Statistics \tabularnewline
Residual Standard Deviation & 0.245413358624484 \tabularnewline
Sum Squared Residuals & 2.28865323047128 \tabularnewline
\hline
\end{tabular}
%Source: https://freestatistics.org/blog/index.php?pk=57962&T=3

[TABLE]
[ROW][C]Multiple Linear Regression - Regression Statistics[/C][/ROW]
[ROW][C]Multiple R[/C][C]0.971181360953543[/C][/ROW]
[ROW][C]R-squared[/C][C]0.943193235863577[/C][/ROW]
[ROW][C]Adjusted R-squared[/C][C]0.917779683486755[/C][/ROW]
[ROW][C]F-TEST (value)[/C][C]37.1137895984914[/C][/ROW]
[ROW][C]F-TEST (DF numerator)[/C][C]17[/C][/ROW]
[ROW][C]F-TEST (DF denominator)[/C][C]38[/C][/ROW]
[ROW][C]p-value[/C][C]0[/C][/ROW]
[ROW][C]Multiple Linear Regression - Residual Statistics[/C][/ROW]
[ROW][C]Residual Standard Deviation[/C][C]0.245413358624484[/C][/ROW]
[ROW][C]Sum Squared Residuals[/C][C]2.28865323047128[/C][/ROW]
[/TABLE]
Source: https://freestatistics.org/blog/index.php?pk=57962&T=3

Globally Unique Identifier (entire table): ba.freestatistics.org/blog/index.php?pk=57962&T=3

As an alternative you can also use a QR Code:  

The GUIDs for individual cells are displayed in the table below:

Multiple Linear Regression - Regression Statistics
Multiple R0.971181360953543
R-squared0.943193235863577
Adjusted R-squared0.917779683486755
F-TEST (value)37.1137895984914
F-TEST (DF numerator)17
F-TEST (DF denominator)38
p-value0
Multiple Linear Regression - Residual Statistics
Residual Standard Deviation0.245413358624484
Sum Squared Residuals2.28865323047128


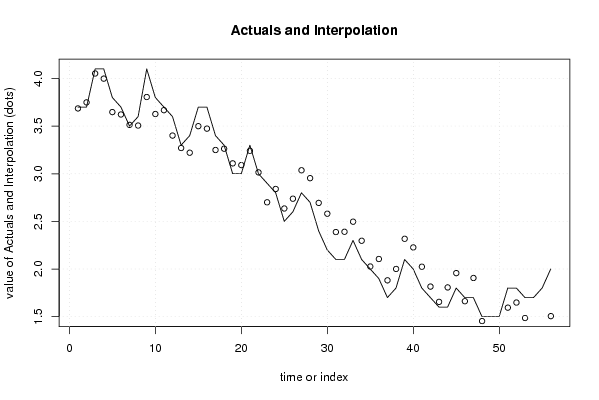
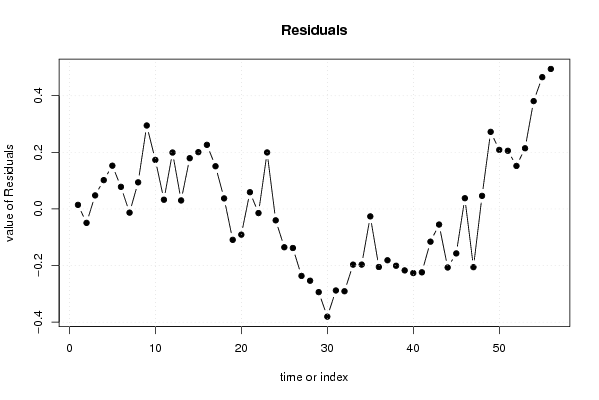
Multiple Linear Regression - Actuals, Interpolation, and Residuals
Time or IndexActualsInterpolationForecastResidualsPrediction Error
13.73.685648985735930.0143510142640743
23.73.74918738325750-0.0491873832575032
34.14.052187968429940.0478120315700565
44.13.99823434454410.101765655455901
53.83.64721486536060.152785134639397
63.73.622001721711550.0779982782884519
73.53.51312087637392-0.0131208763739243
83.63.506003192957880.0939968070421203
94.13.805206866734180.294793133265823
103.83.626696084561150.173303915438851
113.73.667423039022760.0325769609772449
123.63.400793077662670.199206922337333
133.33.269941172108140.0300588278918644
143.43.220774885859680.179225114140319
153.73.499414958477760.200585041522239
163.73.473604621711090.226395378288912
173.43.249220895547120.150779104452875
183.33.262739434754530.0372605652454654
1933.10914133177869-0.109141331778691
2033.09084021933498-0.0908402193349808
213.33.24088596971320.0591140302868022
2233.01457364467385-0.0145736446738475
232.92.700412012068480.199587987931524
242.82.84026741631346-0.0402674163134567
252.52.63535915169381-0.135359151693805
262.62.73802746640404-0.138027466404044
272.83.03661198362256-0.236611983622564
282.72.95356128238874-0.253561282388737
292.42.69391050234463-0.293910502344634
302.22.58054056411447-0.380540564114472
312.12.38801357410492-0.288013574104923
322.12.3908417975242-0.290841797524198
332.32.49676500750494-0.196765007504937
342.12.296628239137-0.196628239136998
3522.02638186984072-0.0263818698407166
361.92.10510415602002-0.205104156020022
371.71.88135029357376-0.181350293573761
381.82.00063196197474-0.20063196197474
392.12.31717607957364-0.217176079573639
4022.22656494803053-0.22656494803053
411.82.02391981300625-0.223919813006249
421.71.81563961697356-0.115639616973563
431.61.65519250794873-0.0551925079487312
441.61.80684766033947-0.206847660339466
451.81.95714215604769-0.157142156047688
461.71.662102031628010.0378979683719942
471.71.90578307906805-0.205783079068052
481.51.453835350003850.0461646499961458
491.51.227700396888370.272299603111628
501.51.291378302504030.208621697495968
511.81.594609009896090.205390990103907
521.81.648034803325550.151965196674454
531.71.485733923741390.214266076258611
541.71.319078662445880.380921337554117
551.81.334531709793730.46546829020627
5621.505467129843470.494532870156525

\begin{tabular}{lllllllll}
\hline
Multiple Linear Regression - Actuals, Interpolation, and Residuals \tabularnewline
Time or Index & Actuals & InterpolationForecast & ResidualsPrediction Error \tabularnewline
1 & 3.7 & 3.68564898573593 & 0.0143510142640743 \tabularnewline
2 & 3.7 & 3.74918738325750 & -0.0491873832575032 \tabularnewline
3 & 4.1 & 4.05218796842994 & 0.0478120315700565 \tabularnewline
4 & 4.1 & 3.9982343445441 & 0.101765655455901 \tabularnewline
5 & 3.8 & 3.6472148653606 & 0.152785134639397 \tabularnewline
6 & 3.7 & 3.62200172171155 & 0.0779982782884519 \tabularnewline
7 & 3.5 & 3.51312087637392 & -0.0131208763739243 \tabularnewline
8 & 3.6 & 3.50600319295788 & 0.0939968070421203 \tabularnewline
9 & 4.1 & 3.80520686673418 & 0.294793133265823 \tabularnewline
10 & 3.8 & 3.62669608456115 & 0.173303915438851 \tabularnewline
11 & 3.7 & 3.66742303902276 & 0.0325769609772449 \tabularnewline
12 & 3.6 & 3.40079307766267 & 0.199206922337333 \tabularnewline
13 & 3.3 & 3.26994117210814 & 0.0300588278918644 \tabularnewline
14 & 3.4 & 3.22077488585968 & 0.179225114140319 \tabularnewline
15 & 3.7 & 3.49941495847776 & 0.200585041522239 \tabularnewline
16 & 3.7 & 3.47360462171109 & 0.226395378288912 \tabularnewline
17 & 3.4 & 3.24922089554712 & 0.150779104452875 \tabularnewline
18 & 3.3 & 3.26273943475453 & 0.0372605652454654 \tabularnewline
19 & 3 & 3.10914133177869 & -0.109141331778691 \tabularnewline
20 & 3 & 3.09084021933498 & -0.0908402193349808 \tabularnewline
21 & 3.3 & 3.2408859697132 & 0.0591140302868022 \tabularnewline
22 & 3 & 3.01457364467385 & -0.0145736446738475 \tabularnewline
23 & 2.9 & 2.70041201206848 & 0.199587987931524 \tabularnewline
24 & 2.8 & 2.84026741631346 & -0.0402674163134567 \tabularnewline
25 & 2.5 & 2.63535915169381 & -0.135359151693805 \tabularnewline
26 & 2.6 & 2.73802746640404 & -0.138027466404044 \tabularnewline
27 & 2.8 & 3.03661198362256 & -0.236611983622564 \tabularnewline
28 & 2.7 & 2.95356128238874 & -0.253561282388737 \tabularnewline
29 & 2.4 & 2.69391050234463 & -0.293910502344634 \tabularnewline
30 & 2.2 & 2.58054056411447 & -0.380540564114472 \tabularnewline
31 & 2.1 & 2.38801357410492 & -0.288013574104923 \tabularnewline
32 & 2.1 & 2.3908417975242 & -0.290841797524198 \tabularnewline
33 & 2.3 & 2.49676500750494 & -0.196765007504937 \tabularnewline
34 & 2.1 & 2.296628239137 & -0.196628239136998 \tabularnewline
35 & 2 & 2.02638186984072 & -0.0263818698407166 \tabularnewline
36 & 1.9 & 2.10510415602002 & -0.205104156020022 \tabularnewline
37 & 1.7 & 1.88135029357376 & -0.181350293573761 \tabularnewline
38 & 1.8 & 2.00063196197474 & -0.20063196197474 \tabularnewline
39 & 2.1 & 2.31717607957364 & -0.217176079573639 \tabularnewline
40 & 2 & 2.22656494803053 & -0.22656494803053 \tabularnewline
41 & 1.8 & 2.02391981300625 & -0.223919813006249 \tabularnewline
42 & 1.7 & 1.81563961697356 & -0.115639616973563 \tabularnewline
43 & 1.6 & 1.65519250794873 & -0.0551925079487312 \tabularnewline
44 & 1.6 & 1.80684766033947 & -0.206847660339466 \tabularnewline
45 & 1.8 & 1.95714215604769 & -0.157142156047688 \tabularnewline
46 & 1.7 & 1.66210203162801 & 0.0378979683719942 \tabularnewline
47 & 1.7 & 1.90578307906805 & -0.205783079068052 \tabularnewline
48 & 1.5 & 1.45383535000385 & 0.0461646499961458 \tabularnewline
49 & 1.5 & 1.22770039688837 & 0.272299603111628 \tabularnewline
50 & 1.5 & 1.29137830250403 & 0.208621697495968 \tabularnewline
51 & 1.8 & 1.59460900989609 & 0.205390990103907 \tabularnewline
52 & 1.8 & 1.64803480332555 & 0.151965196674454 \tabularnewline
53 & 1.7 & 1.48573392374139 & 0.214266076258611 \tabularnewline
54 & 1.7 & 1.31907866244588 & 0.380921337554117 \tabularnewline
55 & 1.8 & 1.33453170979373 & 0.46546829020627 \tabularnewline
56 & 2 & 1.50546712984347 & 0.494532870156525 \tabularnewline
\hline
\end{tabular}
%Source: https://freestatistics.org/blog/index.php?pk=57962&T=4

[TABLE]
[ROW][C]Multiple Linear Regression - Actuals, Interpolation, and Residuals[/C][/ROW]
[ROW][C]Time or Index[/C][C]Actuals[/C][C]InterpolationForecast[/C][C]ResidualsPrediction Error[/C][/ROW]
[ROW][C]1[/C][C]3.7[/C][C]3.68564898573593[/C][C]0.0143510142640743[/C][/ROW]
[ROW][C]2[/C][C]3.7[/C][C]3.74918738325750[/C][C]-0.0491873832575032[/C][/ROW]
[ROW][C]3[/C][C]4.1[/C][C]4.05218796842994[/C][C]0.0478120315700565[/C][/ROW]
[ROW][C]4[/C][C]4.1[/C][C]3.9982343445441[/C][C]0.101765655455901[/C][/ROW]
[ROW][C]5[/C][C]3.8[/C][C]3.6472148653606[/C][C]0.152785134639397[/C][/ROW]
[ROW][C]6[/C][C]3.7[/C][C]3.62200172171155[/C][C]0.0779982782884519[/C][/ROW]
[ROW][C]7[/C][C]3.5[/C][C]3.51312087637392[/C][C]-0.0131208763739243[/C][/ROW]
[ROW][C]8[/C][C]3.6[/C][C]3.50600319295788[/C][C]0.0939968070421203[/C][/ROW]
[ROW][C]9[/C][C]4.1[/C][C]3.80520686673418[/C][C]0.294793133265823[/C][/ROW]
[ROW][C]10[/C][C]3.8[/C][C]3.62669608456115[/C][C]0.173303915438851[/C][/ROW]
[ROW][C]11[/C][C]3.7[/C][C]3.66742303902276[/C][C]0.0325769609772449[/C][/ROW]
[ROW][C]12[/C][C]3.6[/C][C]3.40079307766267[/C][C]0.199206922337333[/C][/ROW]
[ROW][C]13[/C][C]3.3[/C][C]3.26994117210814[/C][C]0.0300588278918644[/C][/ROW]
[ROW][C]14[/C][C]3.4[/C][C]3.22077488585968[/C][C]0.179225114140319[/C][/ROW]
[ROW][C]15[/C][C]3.7[/C][C]3.49941495847776[/C][C]0.200585041522239[/C][/ROW]
[ROW][C]16[/C][C]3.7[/C][C]3.47360462171109[/C][C]0.226395378288912[/C][/ROW]
[ROW][C]17[/C][C]3.4[/C][C]3.24922089554712[/C][C]0.150779104452875[/C][/ROW]
[ROW][C]18[/C][C]3.3[/C][C]3.26273943475453[/C][C]0.0372605652454654[/C][/ROW]
[ROW][C]19[/C][C]3[/C][C]3.10914133177869[/C][C]-0.109141331778691[/C][/ROW]
[ROW][C]20[/C][C]3[/C][C]3.09084021933498[/C][C]-0.0908402193349808[/C][/ROW]
[ROW][C]21[/C][C]3.3[/C][C]3.2408859697132[/C][C]0.0591140302868022[/C][/ROW]
[ROW][C]22[/C][C]3[/C][C]3.01457364467385[/C][C]-0.0145736446738475[/C][/ROW]
[ROW][C]23[/C][C]2.9[/C][C]2.70041201206848[/C][C]0.199587987931524[/C][/ROW]
[ROW][C]24[/C][C]2.8[/C][C]2.84026741631346[/C][C]-0.0402674163134567[/C][/ROW]
[ROW][C]25[/C][C]2.5[/C][C]2.63535915169381[/C][C]-0.135359151693805[/C][/ROW]
[ROW][C]26[/C][C]2.6[/C][C]2.73802746640404[/C][C]-0.138027466404044[/C][/ROW]
[ROW][C]27[/C][C]2.8[/C][C]3.03661198362256[/C][C]-0.236611983622564[/C][/ROW]
[ROW][C]28[/C][C]2.7[/C][C]2.95356128238874[/C][C]-0.253561282388737[/C][/ROW]
[ROW][C]29[/C][C]2.4[/C][C]2.69391050234463[/C][C]-0.293910502344634[/C][/ROW]
[ROW][C]30[/C][C]2.2[/C][C]2.58054056411447[/C][C]-0.380540564114472[/C][/ROW]
[ROW][C]31[/C][C]2.1[/C][C]2.38801357410492[/C][C]-0.288013574104923[/C][/ROW]
[ROW][C]32[/C][C]2.1[/C][C]2.3908417975242[/C][C]-0.290841797524198[/C][/ROW]
[ROW][C]33[/C][C]2.3[/C][C]2.49676500750494[/C][C]-0.196765007504937[/C][/ROW]
[ROW][C]34[/C][C]2.1[/C][C]2.296628239137[/C][C]-0.196628239136998[/C][/ROW]
[ROW][C]35[/C][C]2[/C][C]2.02638186984072[/C][C]-0.0263818698407166[/C][/ROW]
[ROW][C]36[/C][C]1.9[/C][C]2.10510415602002[/C][C]-0.205104156020022[/C][/ROW]
[ROW][C]37[/C][C]1.7[/C][C]1.88135029357376[/C][C]-0.181350293573761[/C][/ROW]
[ROW][C]38[/C][C]1.8[/C][C]2.00063196197474[/C][C]-0.20063196197474[/C][/ROW]
[ROW][C]39[/C][C]2.1[/C][C]2.31717607957364[/C][C]-0.217176079573639[/C][/ROW]
[ROW][C]40[/C][C]2[/C][C]2.22656494803053[/C][C]-0.22656494803053[/C][/ROW]
[ROW][C]41[/C][C]1.8[/C][C]2.02391981300625[/C][C]-0.223919813006249[/C][/ROW]
[ROW][C]42[/C][C]1.7[/C][C]1.81563961697356[/C][C]-0.115639616973563[/C][/ROW]
[ROW][C]43[/C][C]1.6[/C][C]1.65519250794873[/C][C]-0.0551925079487312[/C][/ROW]
[ROW][C]44[/C][C]1.6[/C][C]1.80684766033947[/C][C]-0.206847660339466[/C][/ROW]
[ROW][C]45[/C][C]1.8[/C][C]1.95714215604769[/C][C]-0.157142156047688[/C][/ROW]
[ROW][C]46[/C][C]1.7[/C][C]1.66210203162801[/C][C]0.0378979683719942[/C][/ROW]
[ROW][C]47[/C][C]1.7[/C][C]1.90578307906805[/C][C]-0.205783079068052[/C][/ROW]
[ROW][C]48[/C][C]1.5[/C][C]1.45383535000385[/C][C]0.0461646499961458[/C][/ROW]
[ROW][C]49[/C][C]1.5[/C][C]1.22770039688837[/C][C]0.272299603111628[/C][/ROW]
[ROW][C]50[/C][C]1.5[/C][C]1.29137830250403[/C][C]0.208621697495968[/C][/ROW]
[ROW][C]51[/C][C]1.8[/C][C]1.59460900989609[/C][C]0.205390990103907[/C][/ROW]
[ROW][C]52[/C][C]1.8[/C][C]1.64803480332555[/C][C]0.151965196674454[/C][/ROW]
[ROW][C]53[/C][C]1.7[/C][C]1.48573392374139[/C][C]0.214266076258611[/C][/ROW]
[ROW][C]54[/C][C]1.7[/C][C]1.31907866244588[/C][C]0.380921337554117[/C][/ROW]
[ROW][C]55[/C][C]1.8[/C][C]1.33453170979373[/C][C]0.46546829020627[/C][/ROW]
[ROW][C]56[/C][C]2[/C][C]1.50546712984347[/C][C]0.494532870156525[/C][/ROW]
[/TABLE]
Source: https://freestatistics.org/blog/index.php?pk=57962&T=4

Globally Unique Identifier (entire table): ba.freestatistics.org/blog/index.php?pk=57962&T=4

As an alternative you can also use a QR Code:  

The GUIDs for individual cells are displayed in the table below:

Multiple Linear Regression - Actuals, Interpolation, and Residuals
Time or IndexActualsInterpolationForecastResidualsPrediction Error
13.73.685648985735930.0143510142640743
23.73.74918738325750-0.0491873832575032
34.14.052187968429940.0478120315700565
44.13.99823434454410.101765655455901
53.83.64721486536060.152785134639397
63.73.622001721711550.0779982782884519
73.53.51312087637392-0.0131208763739243
83.63.506003192957880.0939968070421203
94.13.805206866734180.294793133265823
103.83.626696084561150.173303915438851
113.73.667423039022760.0325769609772449
123.63.400793077662670.199206922337333
133.33.269941172108140.0300588278918644
143.43.220774885859680.179225114140319
153.73.499414958477760.200585041522239
163.73.473604621711090.226395378288912
173.43.249220895547120.150779104452875
183.33.262739434754530.0372605652454654
1933.10914133177869-0.109141331778691
2033.09084021933498-0.0908402193349808
213.33.24088596971320.0591140302868022
2233.01457364467385-0.0145736446738475
232.92.700412012068480.199587987931524
242.82.84026741631346-0.0402674163134567
252.52.63535915169381-0.135359151693805
262.62.73802746640404-0.138027466404044
272.83.03661198362256-0.236611983622564
282.72.95356128238874-0.253561282388737
292.42.69391050234463-0.293910502344634
302.22.58054056411447-0.380540564114472
312.12.38801357410492-0.288013574104923
322.12.3908417975242-0.290841797524198
332.32.49676500750494-0.196765007504937
342.12.296628239137-0.196628239136998
3522.02638186984072-0.0263818698407166
361.92.10510415602002-0.205104156020022
371.71.88135029357376-0.181350293573761
381.82.00063196197474-0.20063196197474
392.12.31717607957364-0.217176079573639
4022.22656494803053-0.22656494803053
411.82.02391981300625-0.223919813006249
421.71.81563961697356-0.115639616973563
431.61.65519250794873-0.0551925079487312
441.61.80684766033947-0.206847660339466
451.81.95714215604769-0.157142156047688
461.71.662102031628010.0378979683719942
471.71.90578307906805-0.205783079068052
481.51.453835350003850.0461646499961458
491.51.227700396888370.272299603111628
501.51.291378302504030.208621697495968
511.81.594609009896090.205390990103907
521.81.648034803325550.151965196674454
531.71.485733923741390.214266076258611
541.71.319078662445880.380921337554117
551.81.334531709793730.46546829020627
5621.505467129843470.494532870156525


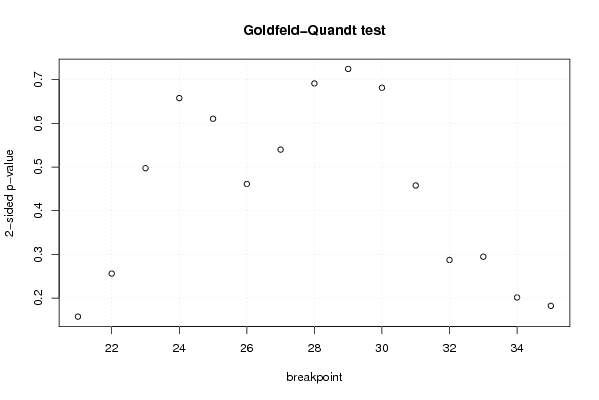
Goldfeld-Quandt test for Heteroskedasticity
p-valuesAlternative Hypothesis
breakpoint indexgreater2-sidedless
210.0786951026052720.1573902052105440.921304897394728
220.1280195465632230.2560390931264460.871980453436777
230.2486445136751920.4972890273503840.751355486324808
240.3288707393287960.6577414786575930.671129260671204
250.3052739994806380.6105479989612760.694726000519362
260.2306220520632120.4612441041264240.769377947936788
270.2699307298900830.5398614597801660.730069270109917
280.3456517114227280.6913034228454560.654348288577272
290.3622750121329520.7245500242659040.637724987867048
300.3407693264705460.6815386529410920.659230673529454
310.228850436257660.457700872515320.77114956374234
320.1436057732827270.2872115465654540.856394226717273
330.1473573943654200.2947147887308400.85264260563458
340.1006779018386790.2013558036773590.89932209816132
350.9089230409470250.1821539181059510.0910769590529753

\begin{tabular}{lllllllll}
\hline
Goldfeld-Quandt test for Heteroskedasticity \tabularnewline
p-values & Alternative Hypothesis \tabularnewline
breakpoint index & greater & 2-sided & less \tabularnewline
21 & 0.078695102605272 & 0.157390205210544 & 0.921304897394728 \tabularnewline
22 & 0.128019546563223 & 0.256039093126446 & 0.871980453436777 \tabularnewline
23 & 0.248644513675192 & 0.497289027350384 & 0.751355486324808 \tabularnewline
24 & 0.328870739328796 & 0.657741478657593 & 0.671129260671204 \tabularnewline
25 & 0.305273999480638 & 0.610547998961276 & 0.694726000519362 \tabularnewline
26 & 0.230622052063212 & 0.461244104126424 & 0.769377947936788 \tabularnewline
27 & 0.269930729890083 & 0.539861459780166 & 0.730069270109917 \tabularnewline
28 & 0.345651711422728 & 0.691303422845456 & 0.654348288577272 \tabularnewline
29 & 0.362275012132952 & 0.724550024265904 & 0.637724987867048 \tabularnewline
30 & 0.340769326470546 & 0.681538652941092 & 0.659230673529454 \tabularnewline
31 & 0.22885043625766 & 0.45770087251532 & 0.77114956374234 \tabularnewline
32 & 0.143605773282727 & 0.287211546565454 & 0.856394226717273 \tabularnewline
33 & 0.147357394365420 & 0.294714788730840 & 0.85264260563458 \tabularnewline
34 & 0.100677901838679 & 0.201355803677359 & 0.89932209816132 \tabularnewline
35 & 0.908923040947025 & 0.182153918105951 & 0.0910769590529753 \tabularnewline
\hline
\end{tabular}
%Source: https://freestatistics.org/blog/index.php?pk=57962&T=5

[TABLE]
[ROW][C]Goldfeld-Quandt test for Heteroskedasticity[/C][/ROW]
[ROW][C]p-values[/C][C]Alternative Hypothesis[/C][/ROW]
[ROW][C]breakpoint index[/C][C]greater[/C][C]2-sided[/C][C]less[/C][/ROW]
[ROW][C]21[/C][C]0.078695102605272[/C][C]0.157390205210544[/C][C]0.921304897394728[/C][/ROW]
[ROW][C]22[/C][C]0.128019546563223[/C][C]0.256039093126446[/C][C]0.871980453436777[/C][/ROW]
[ROW][C]23[/C][C]0.248644513675192[/C][C]0.497289027350384[/C][C]0.751355486324808[/C][/ROW]
[ROW][C]24[/C][C]0.328870739328796[/C][C]0.657741478657593[/C][C]0.671129260671204[/C][/ROW]
[ROW][C]25[/C][C]0.305273999480638[/C][C]0.610547998961276[/C][C]0.694726000519362[/C][/ROW]
[ROW][C]26[/C][C]0.230622052063212[/C][C]0.461244104126424[/C][C]0.769377947936788[/C][/ROW]
[ROW][C]27[/C][C]0.269930729890083[/C][C]0.539861459780166[/C][C]0.730069270109917[/C][/ROW]
[ROW][C]28[/C][C]0.345651711422728[/C][C]0.691303422845456[/C][C]0.654348288577272[/C][/ROW]
[ROW][C]29[/C][C]0.362275012132952[/C][C]0.724550024265904[/C][C]0.637724987867048[/C][/ROW]
[ROW][C]30[/C][C]0.340769326470546[/C][C]0.681538652941092[/C][C]0.659230673529454[/C][/ROW]
[ROW][C]31[/C][C]0.22885043625766[/C][C]0.45770087251532[/C][C]0.77114956374234[/C][/ROW]
[ROW][C]32[/C][C]0.143605773282727[/C][C]0.287211546565454[/C][C]0.856394226717273[/C][/ROW]
[ROW][C]33[/C][C]0.147357394365420[/C][C]0.294714788730840[/C][C]0.85264260563458[/C][/ROW]
[ROW][C]34[/C][C]0.100677901838679[/C][C]0.201355803677359[/C][C]0.89932209816132[/C][/ROW]
[ROW][C]35[/C][C]0.908923040947025[/C][C]0.182153918105951[/C][C]0.0910769590529753[/C][/ROW]
[/TABLE]
Source: https://freestatistics.org/blog/index.php?pk=57962&T=5

Globally Unique Identifier (entire table): ba.freestatistics.org/blog/index.php?pk=57962&T=5

As an alternative you can also use a QR Code:  

The GUIDs for individual cells are displayed in the table below:

Goldfeld-Quandt test for Heteroskedasticity
p-valuesAlternative Hypothesis
breakpoint indexgreater2-sidedless
210.0786951026052720.1573902052105440.921304897394728
220.1280195465632230.2560390931264460.871980453436777
230.2486445136751920.4972890273503840.751355486324808
240.3288707393287960.6577414786575930.671129260671204
250.3052739994806380.6105479989612760.694726000519362
260.2306220520632120.4612441041264240.769377947936788
270.2699307298900830.5398614597801660.730069270109917
280.3456517114227280.6913034228454560.654348288577272
290.3622750121329520.7245500242659040.637724987867048
300.3407693264705460.6815386529410920.659230673529454
310.228850436257660.457700872515320.77114956374234
320.1436057732827270.2872115465654540.856394226717273
330.1473573943654200.2947147887308400.85264260563458
340.1006779018386790.2013558036773590.89932209816132
350.9089230409470250.1821539181059510.0910769590529753


Meta Analysis of Goldfeld-Quandt test for Heteroskedasticity
Description# significant tests% significant testsOK/NOK
1% type I error level00OK
5% type I error level00OK
10% type I error level00OK

\begin{tabular}{lllllllll}
\hline
Meta Analysis of Goldfeld-Quandt test for Heteroskedasticity \tabularnewline
Description & # significant tests & % significant tests & OK/NOK \tabularnewline
1% type I error level & 0 & 0 & OK \tabularnewline
5% type I error level & 0 & 0 & OK \tabularnewline
10% type I error level & 0 & 0 & OK \tabularnewline
\hline
\end{tabular}
%Source: https://freestatistics.org/blog/index.php?pk=57962&T=6

[TABLE]
[ROW][C]Meta Analysis of Goldfeld-Quandt test for Heteroskedasticity[/C][/ROW]
[ROW][C]Description[/C][C]# significant tests[/C][C]% significant tests[/C][C]OK/NOK[/C][/ROW]
[ROW][C]1% type I error level[/C][C]0[/C][C]0[/C][C]OK[/C][/ROW]
[ROW][C]5% type I error level[/C][C]0[/C][C]0[/C][C]OK[/C][/ROW]
[ROW][C]10% type I error level[/C][C]0[/C][C]0[/C][C]OK[/C][/ROW]
[/TABLE]
Source: https://freestatistics.org/blog/index.php?pk=57962&T=6

Globally Unique Identifier (entire table): ba.freestatistics.org/blog/index.php?pk=57962&T=6

As an alternative you can also use a QR Code:  

The GUIDs for individual cells are displayed in the table below:

Meta Analysis of Goldfeld-Quandt test for Heteroskedasticity
Description# significant tests% significant testsOK/NOK
1% type I error level00OK
5% type I error level00OK
10% type I error level00OK


Parameters (Session):
par1 = 1 ; par2 = Include Monthly Dummies ; par3 = Linear Trend ;
Parameters (R input):
par1 = 1 ; par2 = Include Monthly Dummies ; par3 = Linear Trend ;
R code (references can be found in the software module):
library(lattice)
library(lmtest)
n25 <- 25 #minimum number of obs. for Goldfeld-Quandt test
par1 <- as.numeric(par1)
x <- t(y)
k <- length(x[1,])
n <- length(x[,1])
x1 <- cbind(x[,par1], x[,1:k!=par1])
mycolnames <- c(colnames(x)[par1], colnames(x)[1:k!=par1])
colnames(x1) <- mycolnames #colnames(x)[par1]
x <- x1
if (par3 == 'First Differences'){
x2 <- array(0, dim=c(n-1,k), dimnames=list(1:(n-1), paste('(1-B)',colnames(x),sep='')))
for (i in 1:n-1) {
for (j in 1:k) {
x2[i,j] <- x[i+1,j] - x[i,j]
}
}
x <- x2
}
if (par2 == 'Include Monthly Dummies'){
x2 <- array(0, dim=c(n,11), dimnames=list(1:n, paste('M', seq(1:11), sep ='')))
for (i in 1:11){
x2[seq(i,n,12),i] <- 1
}
x <- cbind(x, x2)
}
if (par2 == 'Include Quarterly Dummies'){
x2 <- array(0, dim=c(n,3), dimnames=list(1:n, paste('Q', seq(1:3), sep ='')))
for (i in 1:3){
x2[seq(i,n,4),i] <- 1
}
x <- cbind(x, x2)
}
k <- length(x[1,])
if (par3 == 'Linear Trend'){
x <- cbind(x, c(1:n))
colnames(x)[k+1] <- 't'
}
x
k <- length(x[1,])
df <- as.data.frame(x)
(mylm <- lm(df))
(mysum <- summary(mylm))
if (n > n25) {
kp3 <- k + 3
nmkm3 <- n - k - 3
gqarr <- array(NA, dim=c(nmkm3-kp3+1,3))
numgqtests <- 0
numsignificant1 <- 0
numsignificant5 <- 0
numsignificant10 <- 0
for (mypoint in kp3:nmkm3) {
j <- 0
numgqtests <- numgqtests + 1
for (myalt in c('greater', 'two.sided', 'less')) {
j <- j + 1
gqarr[mypoint-kp3+1,j] <- gqtest(mylm, point=mypoint, alternative=myalt)$p.value
}
if (gqarr[mypoint-kp3+1,2] < 0.01) numsignificant1 <- numsignificant1 + 1
if (gqarr[mypoint-kp3+1,2] < 0.05) numsignificant5 <- numsignificant5 + 1
if (gqarr[mypoint-kp3+1,2] < 0.10) numsignificant10 <- numsignificant10 + 1
}
gqarr
}
bitmap(file='test0.png')
plot(x[,1], type='l', main='Actuals and Interpolation', ylab='value of Actuals and Interpolation (dots)', xlab='time or index')
points(x[,1]-mysum$resid)
grid()
dev.off()
bitmap(file='test1.png')
plot(mysum$resid, type='b', pch=19, main='Residuals', ylab='value of Residuals', xlab='time or index')
grid()
dev.off()
bitmap(file='test2.png')
hist(mysum$resid, main='Residual Histogram', xlab='values of Residuals')
grid()
dev.off()
bitmap(file='test3.png')
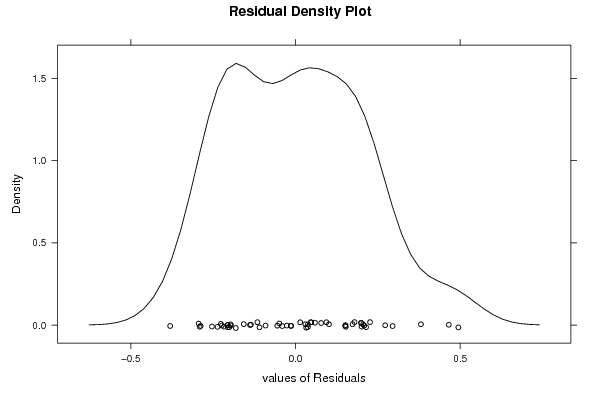
densityplot(~mysum$resid,col='black',main='Residual Density Plot', xlab='values of Residuals')
dev.off()
bitmap(file='test4.png')
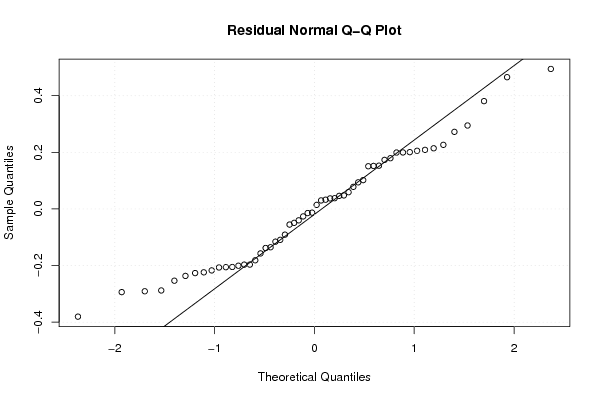
qqnorm(mysum$resid, main='Residual Normal Q-Q Plot')
qqline(mysum$resid)
grid()
dev.off()
(myerror <- as.ts(mysum$resid))
bitmap(file='test5.png')
dum <- cbind(lag(myerror,k=1),myerror)
dum
dum1 <- dum[2:length(myerror),]
dum1
z <- as.data.frame(dum1)
z
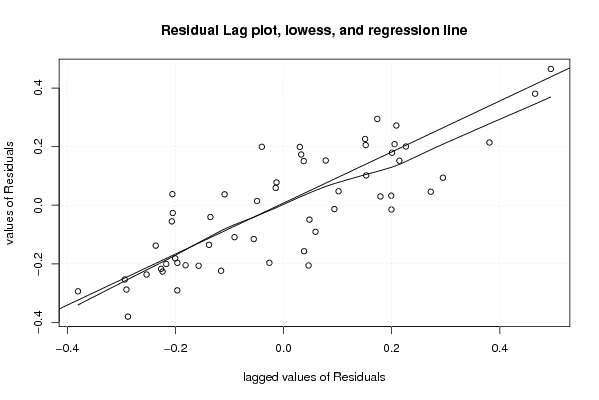
plot(z,main=paste('Residual Lag plot, lowess, and regression line'), ylab='values of Residuals', xlab='lagged values of Residuals')
lines(lowess(z))
abline(lm(z))
grid()
dev.off()
bitmap(file='test6.png')
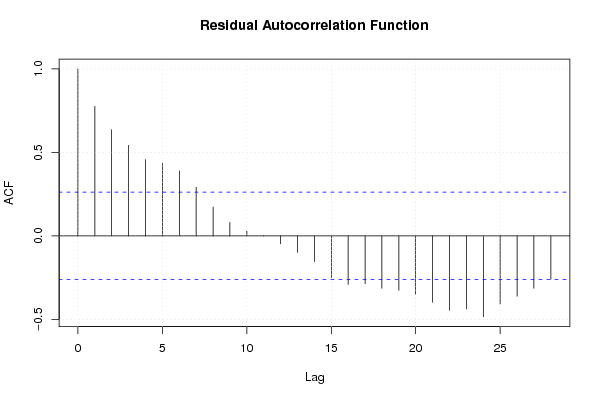
acf(mysum$resid, lag.max=length(mysum$resid)/2, main='Residual Autocorrelation Function')
grid()
dev.off()
bitmap(file='test7.png')
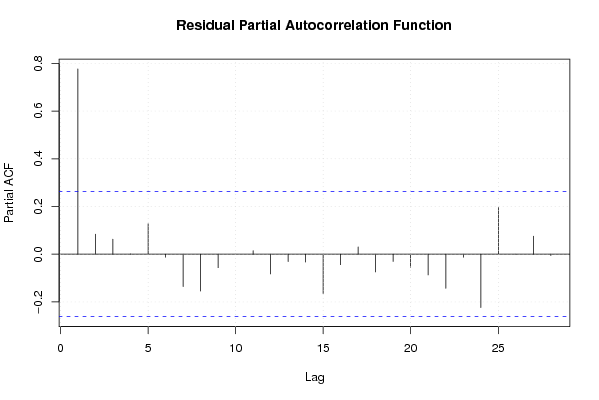
pacf(mysum$resid, lag.max=length(mysum$resid)/2, main='Residual Partial Autocorrelation Function')
grid()
dev.off()
bitmap(file='test8.png')
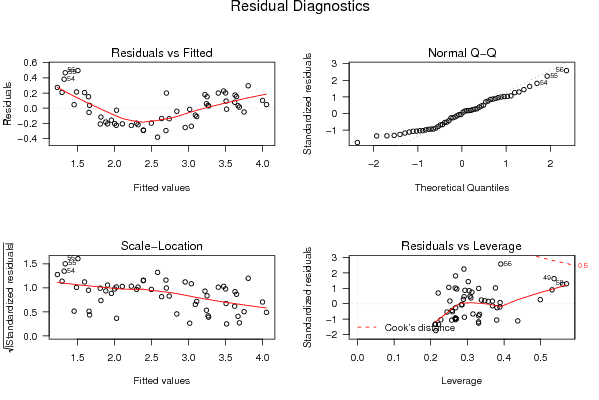
opar <- par(mfrow = c(2,2), oma = c(0, 0, 1.1, 0))
plot(mylm, las = 1, sub='Residual Diagnostics')
par(opar)
dev.off()
if (n > n25) {
bitmap(file='test9.png')
plot(kp3:nmkm3,gqarr[,2], main='Goldfeld-Quandt test',ylab='2-sided p-value',xlab='breakpoint')
grid()
dev.off()
}
load(file='createtable')
a<-table.start()
a<-table.row.start(a)
a<-table.element(a, 'Multiple Linear Regression - Estimated Regression Equation', 1, TRUE)
a<-table.row.end(a)
myeq <- colnames(x)[1]
myeq <- paste(myeq, '[t] = ', sep='')
for (i in 1:k){
if (mysum$coefficients[i,1] > 0) myeq <- paste(myeq, '+', '')
myeq <- paste(myeq, mysum$coefficients[i,1], sep=' ')
if (rownames(mysum$coefficients)[i] != '(Intercept)') {
myeq <- paste(myeq, rownames(mysum$coefficients)[i], sep='')
if (rownames(mysum$coefficients)[i] != 't') myeq <- paste(myeq, '[t]', sep='')
}
}
myeq <- paste(myeq, ' + e[t]')
a<-table.row.start(a)
a<-table.element(a, myeq)
a<-table.row.end(a)
a<-table.end(a)
table.save(a,file='mytable1.tab')
a<-table.start()
a<-table.row.start(a)
a<-table.element(a,hyperlink('ols1.htm','Multiple Linear Regression - Ordinary Least Squares',''), 6, TRUE)
a<-table.row.end(a)
a<-table.row.start(a)
a<-table.element(a,'Variable',header=TRUE)
a<-table.element(a,'Parameter',header=TRUE)
a<-table.element(a,'S.D.',header=TRUE)
a<-table.element(a,'T-STAT
H0: parameter = 0',header=TRUE)
a<-table.element(a,'2-tail p-value',header=TRUE)
a<-table.element(a,'1-tail p-value',header=TRUE)
a<-table.row.end(a)
for (i in 1:k){
a<-table.row.start(a)
a<-table.element(a,rownames(mysum$coefficients)[i],header=TRUE)
a<-table.element(a,mysum$coefficients[i,1])
a<-table.element(a, round(mysum$coefficients[i,2],6))
a<-table.element(a, round(mysum$coefficients[i,3],4))
a<-table.element(a, round(mysum$coefficients[i,4],6))
a<-table.element(a, round(mysum$coefficients[i,4]/2,6))
a<-table.row.end(a)
}
a<-table.end(a)
table.save(a,file='mytable2.tab')
a<-table.start()
a<-table.row.start(a)
a<-table.element(a, 'Multiple Linear Regression - Regression Statistics', 2, TRUE)
a<-table.row.end(a)
a<-table.row.start(a)
a<-table.element(a, 'Multiple R',1,TRUE)
a<-table.element(a, sqrt(mysum$r.squared))
a<-table.row.end(a)
a<-table.row.start(a)
a<-table.element(a, 'R-squared',1,TRUE)
a<-table.element(a, mysum$r.squared)
a<-table.row.end(a)
a<-table.row.start(a)
a<-table.element(a, 'Adjusted R-squared',1,TRUE)
a<-table.element(a, mysum$adj.r.squared)
a<-table.row.end(a)
a<-table.row.start(a)
a<-table.element(a, 'F-TEST (value)',1,TRUE)
a<-table.element(a, mysum$fstatistic[1])
a<-table.row.end(a)
a<-table.row.start(a)
a<-table.element(a, 'F-TEST (DF numerator)',1,TRUE)
a<-table.element(a, mysum$fstatistic[2])
a<-table.row.end(a)
a<-table.row.start(a)
a<-table.element(a, 'F-TEST (DF denominator)',1,TRUE)
a<-table.element(a, mysum$fstatistic[3])
a<-table.row.end(a)
a<-table.row.start(a)
a<-table.element(a, 'p-value',1,TRUE)
a<-table.element(a, 1-pf(mysum$fstatistic[1],mysum$fstatistic[2],mysum$fstatistic[3]))
a<-table.row.end(a)
a<-table.row.start(a)
a<-table.element(a, 'Multiple Linear Regression - Residual Statistics', 2, TRUE)
a<-table.row.end(a)
a<-table.row.start(a)
a<-table.element(a, 'Residual Standard Deviation',1,TRUE)
a<-table.element(a, mysum$sigma)
a<-table.row.end(a)
a<-table.row.start(a)
a<-table.element(a, 'Sum Squared Residuals',1,TRUE)
a<-table.element(a, sum(myerror*myerror))
a<-table.row.end(a)
a<-table.end(a)
table.save(a,file='mytable3.tab')
a<-table.start()
a<-table.row.start(a)
a<-table.element(a, 'Multiple Linear Regression - Actuals, Interpolation, and Residuals', 4, TRUE)
a<-table.row.end(a)
a<-table.row.start(a)
a<-table.element(a, 'Time or Index', 1, TRUE)
a<-table.element(a, 'Actuals', 1, TRUE)
a<-table.element(a, 'Interpolation
Forecast', 1, TRUE)
a<-table.element(a, 'Residuals
Prediction Error', 1, TRUE)
a<-table.row.end(a)
for (i in 1:n) {
a<-table.row.start(a)
a<-table.element(a,i, 1, TRUE)
a<-table.element(a,x[i])
a<-table.element(a,x[i]-mysum$resid[i])
a<-table.element(a,mysum$resid[i])
a<-table.row.end(a)
}
a<-table.end(a)
table.save(a,file='mytable4.tab')
if (n > n25) {
a<-table.start()
a<-table.row.start(a)
a<-table.element(a,'Goldfeld-Quandt test for Heteroskedasticity',4,TRUE)
a<-table.row.end(a)
a<-table.row.start(a)
a<-table.element(a,'p-values',header=TRUE)
a<-table.element(a,'Alternative Hypothesis',3,header=TRUE)
a<-table.row.end(a)
a<-table.row.start(a)
a<-table.element(a,'breakpoint index',header=TRUE)
a<-table.element(a,'greater',header=TRUE)
a<-table.element(a,'2-sided',header=TRUE)
a<-table.element(a,'less',header=TRUE)
a<-table.row.end(a)
for (mypoint in kp3:nmkm3) {
a<-table.row.start(a)
a<-table.element(a,mypoint,header=TRUE)
a<-table.element(a,gqarr[mypoint-kp3+1,1])
a<-table.element(a,gqarr[mypoint-kp3+1,2])
a<-table.element(a,gqarr[mypoint-kp3+1,3])
a<-table.row.end(a)
}
a<-table.end(a)
table.save(a,file='mytable5.tab')
a<-table.start()
a<-table.row.start(a)
a<-table.element(a,'Meta Analysis of Goldfeld-Quandt test for Heteroskedasticity',4,TRUE)
a<-table.row.end(a)
a<-table.row.start(a)
a<-table.element(a,'Description',header=TRUE)
a<-table.element(a,'# significant tests',header=TRUE)
a<-table.element(a,'% significant tests',header=TRUE)
a<-table.element(a,'OK/NOK',header=TRUE)
a<-table.row.end(a)
a<-table.row.start(a)
a<-table.element(a,'1% type I error level',header=TRUE)
a<-table.element(a,numsignificant1)
a<-table.element(a,numsignificant1/numgqtests)
if (numsignificant1/numgqtests < 0.01) dum <- 'OK' else dum <- 'NOK'
a<-table.element(a,dum)
a<-table.row.end(a)
a<-table.row.start(a)
a<-table.element(a,'5% type I error level',header=TRUE)
a<-table.element(a,numsignificant5)
a<-table.element(a,numsignificant5/numgqtests)
if (numsignificant5/numgqtests < 0.05) dum <- 'OK' else dum <- 'NOK'
a<-table.element(a,dum)
a<-table.row.end(a)
a<-table.row.start(a)
a<-table.element(a,'10% type I error level',header=TRUE)
a<-table.element(a,numsignificant10)
a<-table.element(a,numsignificant10/numgqtests)
if (numsignificant10/numgqtests < 0.1) dum <- 'OK' else dum <- 'NOK'
a<-table.element(a,dum)
a<-table.row.end(a)
a<-table.end(a)
table.save(a,file='mytable6.tab')
}