| Multiple Linear Regression - Estimated Regression Equation |
| unempl[t] = + 5.27350954525389 -0.0126416256269494proman[t] + 0.366770003948042M1[t] + 0.147528205533444M2[t] + 0.148660914596817M3[t] -0.0350531745152288M4[t] -0.116195958064706M5[t] + 0.0960089185315434M6[t] -0.0378519689375812M7[t] + 0.378004755217993M8[t] + 0.254054582521167M9[t] + 0.257968449222469M10[t] + 0.155666429147978M11[t] -0.0444982262546406t + e[t] |
| Multiple Linear Regression - Ordinary Least Squares | |||||
| Variable | Parameter | S.D. | T-STAT H0: parameter = 0 | 2-tail p-value | 1-tail p-value |
| (Intercept) | 5.27350954525389 | 0.534087 | 9.8739 | 0 | 0 |
| proman | -0.0126416256269494 | 0.006315 | -2.0018 | 0.051227 | 0.025614 |
| M1 | 0.366770003948042 | 0.186394 | 1.9677 | 0.055147 | 0.027573 |
| M2 | 0.147528205533444 | 0.173759 | 0.849 | 0.400257 | 0.200128 |
| M3 | 0.148660914596817 | 0.186955 | 0.7952 | 0.430598 | 0.215299 |
| M4 | -0.0350531745152288 | 0.161555 | -0.217 | 0.829189 | 0.414594 |
| M5 | -0.116195958064706 | 0.170646 | -0.6809 | 0.499338 | 0.249669 |
| M6 | 0.0960089185315434 | 0.198414 | 0.4839 | 0.630765 | 0.315383 |
| M7 | -0.0378519689375812 | 0.191981 | -0.1972 | 0.844567 | 0.422284 |
| M8 | 0.378004755217993 | 0.17645 | 2.1423 | 0.037498 | 0.018749 |
| M9 | 0.254054582521167 | 0.19509 | 1.3022 | 0.199316 | 0.099658 |
| M10 | 0.257968449222469 | 0.213032 | 1.2109 | 0.232104 | 0.116052 |
| M11 | 0.155666429147978 | 0.202344 | 0.7693 | 0.445637 | 0.222819 |
| t | -0.0444982262546406 | 0.003026 | -14.7063 | 0 | 0 |
| Multiple Linear Regression - Regression Statistics | |
| Multiple R | 0.971427086516528 |
| R-squared | 0.94367058441799 |
| Adjusted R-squared | 0.92775140175351 |
| F-TEST (value) | 59.2788338639719 |
| F-TEST (DF numerator) | 13 |
| F-TEST (DF denominator) | 46 |
| p-value | 0 |
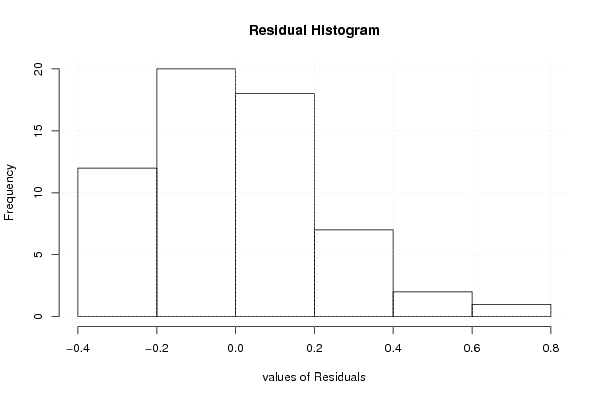
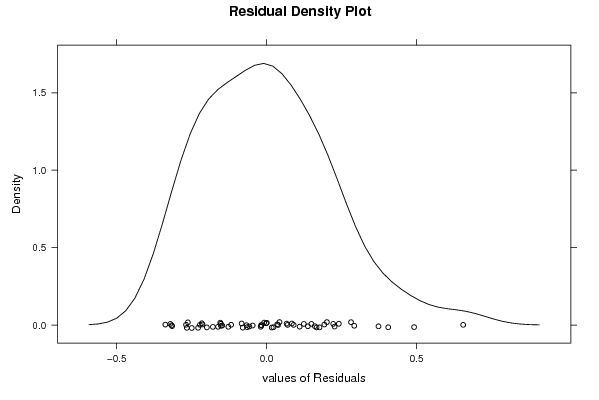
| Multiple Linear Regression - Residual Statistics | |
| Residual Standard Deviation | 0.241960821749243 |
| Sum Squared Residuals | 2.69307180603216 |
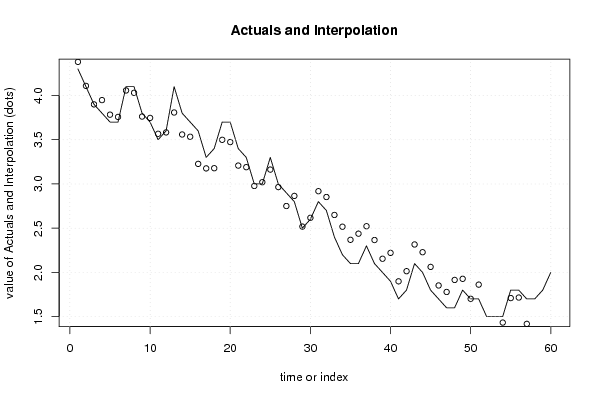
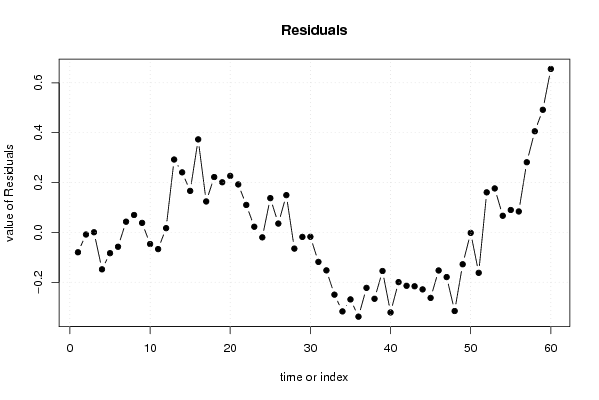
| Multiple Linear Regression - Actuals, Interpolation, and Residuals | |||
| Time or Index | Actuals | Interpolation Forecast | Residuals Prediction Error |
| 1 | 4.3 | 4.37965693763479 | -0.0796569376347907 |
| 2 | 4.1 | 4.10833193758935 | -0.00833193758935118 |
| 3 | 3.9 | 3.89936112468505 | 0.000638875314950401 |
| 4 | 3.8 | 3.94800041054855 | -0.148000410548554 |
| 5 | 3.7 | 3.78317036130089 | -0.0831703613008928 |
| 6 | 3.7 | 3.75746013955018 | -0.057460139550176 |
| 7 | 4.1 | 4.0569544745251 | 0.0430455254749015 |
| 8 | 4.1 | 4.03010176517713 | 0.0698982348228741 |
| 9 | 3.8 | 3.76178452377276 | 0.0382154762272423 |
| 10 | 3.7 | 3.74648341547332 | -0.0464834154733195 |
| 11 | 3.5 | 3.56681494251412 | -0.0668149425141187 |
| 12 | 3.6 | 3.58282208533234 | 0.0171779146676650 |
| 13 | 4.1 | 3.80775334569822 | 0.292246654301775 |
| 14 | 3.8 | 3.55918327178133 | 0.240816728218674 |
| 15 | 3.7 | 3.53351603046779 | 0.166483969532212 |
| 16 | 3.6 | 3.22692563621402 | 0.373074363785985 |
| 17 | 3.3 | 3.1758702176089 | 0.124129782391101 |
| 18 | 3.4 | 3.17797157223747 | 0.222028427762529 |
| 19 | 3.7 | 3.49895667077821 | 0.201043329221793 |
| 20 | 3.7 | 3.47336812399293 | 0.226631876007071 |
| 21 | 3.4 | 3.20757920771395 | 0.192420792286047 |
| 22 | 3.3 | 3.18974977428912 | 0.110250225710876 |
| 23 | 3 | 2.97721307469985 | 0.022786925300146 |
| 24 | 3 | 3.01976763133466 | -0.0197676313346639 |
| 25 | 3.3 | 3.16252832512538 | 0.137471674874616 |
| 26 | 3 | 2.96452475371628 | 0.035475246283718 |
| 27 | 2.9 | 2.7504972905612 | 0.149502709438802 |
| 28 | 2.8 | 2.86487302968484 | -0.0648730296848397 |
| 29 | 2.5 | 2.51800357140911 | -0.0180035714091081 |
| 30 | 2.6 | 2.61744544336519 | -0.0174454433651901 |
| 31 | 2.8 | 2.91820394090281 | -0.118203940902807 |
| 32 | 2.7 | 2.85216219211129 | -0.152162192111291 |
| 33 | 2.4 | 2.64958140396706 | -0.249581403967062 |
| 34 | 2.2 | 2.51671317733699 | -0.316713177336993 |
| 35 | 2.1 | 2.36864876844517 | -0.268648768445165 |
| 36 | 2.1 | 2.43775073889657 | -0.337750738896569 |
| 37 | 2.3 | 2.52235995480332 | -0.222359954803322 |
| 38 | 2.1 | 2.36607374796315 | -0.266073747963153 |
| 39 | 2 | 2.15457460993346 | -0.154574609933459 |
| 40 | 1.9 | 2.22091217167469 | -0.320912171674693 |
| 41 | 1.7 | 1.89932596465286 | -0.19932596465286 |
| 42 | 1.8 | 2.01393778736128 | -0.213937787361281 |
| 43 | 2.1 | 2.31596044746159 | -0.215960447461593 |
| 44 | 2 | 2.22842793510426 | -0.228427935104264 |
| 45 | 1.8 | 2.06250786127819 | -0.262507861278187 |
| 46 | 1.7 | 1.85252571832373 | -0.152525718323727 |
| 47 | 1.6 | 1.7790469006309 | -0.179046900630901 |
| 48 | 1.6 | 1.91514948690514 | -0.315149486905136 |
| 49 | 1.8 | 1.92770143673828 | -0.127701436738278 |
| 50 | 1.7 | 1.70188628894989 | -0.00188628894988755 |
| 51 | 1.7 | 1.86205094435251 | -0.162050944352505 |
| 52 | 1.5 | 1.33928875187790 | 0.160711248122102 |
| 53 | 1.5 | 1.32362988502824 | 0.17637011497176 |
| 54 | 1.5 | 1.43318505748588 | 0.0668149425141189 |
| 55 | 1.8 | 1.70992446633230 | 0.090075533667705 |
| 56 | 1.8 | 1.71593998361439 | 0.0840600163856097 |
| 57 | 1.7 | 1.41854700326804 | 0.281452996731960 |
| 58 | 1.7 | 1.29452791457684 | 0.405472085423163 |
| 59 | 1.8 | 1.30827631370996 | 0.491723686290039 |
| 60 | 2 | 1.34451005753130 | 0.655489942468704 |
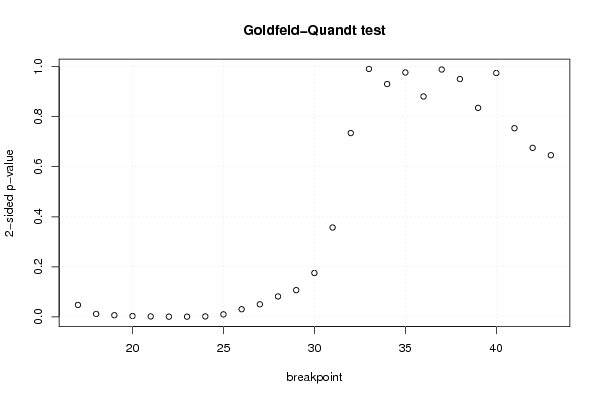
| Goldfeld-Quandt test for Heteroskedasticity | |||
| p-values | Alternative Hypothesis | ||
| breakpoint index | greater | 2-sided | less |
| 17 | 0.0236747283528351 | 0.0473494567056701 | 0.976325271647165 |
| 18 | 0.00569619103736995 | 0.0113923820747399 | 0.99430380896263 |
| 19 | 0.00314260325388835 | 0.00628520650777669 | 0.996857396746112 |
| 20 | 0.0015781762718727 | 0.0031563525437454 | 0.998421823728127 |
| 21 | 0.000751290883266664 | 0.00150258176653333 | 0.999248709116733 |
| 22 | 0.000311178535794732 | 0.000622357071589463 | 0.999688821464205 |
| 23 | 0.000307886877352475 | 0.000615773754704951 | 0.999692113122647 |
| 24 | 0.000758662736263702 | 0.00151732547252740 | 0.999241337263736 |
| 25 | 0.00490288175990124 | 0.00980576351980248 | 0.995097118240099 |
| 26 | 0.0151697409309748 | 0.0303394818619495 | 0.984830259069025 |
| 27 | 0.0249892238227263 | 0.0499784476454527 | 0.975010776177274 |
| 28 | 0.0406834781731418 | 0.0813669563462835 | 0.959316521826858 |
| 29 | 0.0532691388953546 | 0.106538277790709 | 0.946730861104645 |
| 30 | 0.0875458855125677 | 0.175091771025135 | 0.912454114487432 |
| 31 | 0.178507275930518 | 0.357014551861036 | 0.821492724069482 |
| 32 | 0.367234579219025 | 0.73446915843805 | 0.632765420780975 |
| 33 | 0.495433092053572 | 0.990866184107143 | 0.504566907946428 |
| 34 | 0.534715097976511 | 0.930569804046978 | 0.465284902023489 |
| 35 | 0.488356625493512 | 0.976713250987025 | 0.511643374506488 |
| 36 | 0.440450142908868 | 0.880900285817737 | 0.559549857091132 |
| 37 | 0.494320379543081 | 0.988640759086162 | 0.505679620456919 |
| 38 | 0.475259774719181 | 0.950519549438363 | 0.524740225280819 |
| 39 | 0.582387943488719 | 0.835224113022563 | 0.417612056511281 |
| 40 | 0.487244349558929 | 0.974488699117858 | 0.512755650441071 |
| 41 | 0.37697089576828 | 0.75394179153656 | 0.62302910423172 |
| 42 | 0.337718597117964 | 0.675437194235927 | 0.662281402882037 |
| 43 | 0.322981328999180 | 0.645962657998359 | 0.67701867100082 |
| Meta Analysis of Goldfeld-Quandt test for Heteroskedasticity | |||
| Description | # significant tests | % significant tests | OK/NOK |
| 1% type I error level | 7 | 0.259259259259259 | NOK |
| 5% type I error level | 11 | 0.407407407407407 | NOK |
| 10% type I error level | 12 | 0.444444444444444 | NOK |