| Multiple Linear Regression - Estimated Regression Equation |
| X[t] = + 10.0715783709973 -0.00873369273130395Y[t] -0.100931769606700M1[t] -0.322832544139754M2[t] -0.445119417252861M3[t] -0.359524319432952M4[t] -0.148775873837516M5[t] -0.151564495620915M6[t] -0.258369990641970M7[t] -0.587534677183279M8[t] -0.811808183085685M9[t] -0.779661721234496M10[t] -0.221928197710249M11[t] -0.0262069253751581t + e[t] |
| Multiple Linear Regression - Ordinary Least Squares | |||||
| Variable | Parameter | S.D. | T-STAT H0: parameter = 0 | 2-tail p-value | 1-tail p-value |
| (Intercept) | 10.0715783709973 | 1.651738 | 6.0976 | 0 | 0 |
| Y | -0.00873369273130395 | 0.017653 | -0.4947 | 0.62304 | 0.31152 |
| M1 | -0.100931769606700 | 0.390912 | -0.2582 | 0.79736 | 0.39868 |
| M2 | -0.322832544139754 | 0.391096 | -0.8255 | 0.413197 | 0.206598 |
| M3 | -0.445119417252861 | 0.346364 | -1.2851 | 0.204917 | 0.102459 |
| M4 | -0.359524319432952 | 0.303319 | -1.1853 | 0.241733 | 0.120867 |
| M5 | -0.148775873837516 | 0.303999 | -0.4894 | 0.626791 | 0.313396 |
| M6 | -0.151564495620915 | 0.307623 | -0.4927 | 0.624474 | 0.312237 |
| M7 | -0.258369990641970 | 0.386147 | -0.6691 | 0.506638 | 0.253319 |
| M8 | -0.587534677183279 | 0.325445 | -1.8053 | 0.077298 | 0.038649 |
| M9 | -0.811808183085685 | 0.316373 | -2.566 | 0.013465 | 0.006733 |
| M10 | -0.779661721234496 | 0.405862 | -1.921 | 0.060682 | 0.030341 |
| M11 | -0.221928197710249 | 0.353809 | -0.6273 | 0.533465 | 0.266732 |
| t | -0.0262069253751581 | 0.00477 | -5.494 | 1e-06 | 1e-06 |
| Multiple Linear Regression - Regression Statistics | |
| Multiple R | 0.807916145521653 |
| R-squared | 0.652728498194565 |
| Adjusted R-squared | 0.558675799788926 |
| F-TEST (value) | 6.94002946496464 |
| F-TEST (DF numerator) | 13 |
| F-TEST (DF denominator) | 48 |
| p-value | 2.76054716197294e-07 |
| Multiple Linear Regression - Residual Statistics | |
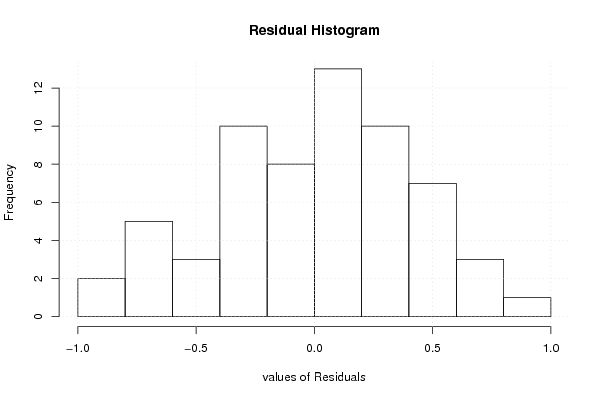
| Residual Standard Deviation | 0.471765822725034 |
| Sum Squared Residuals | 10.6830235915885 |
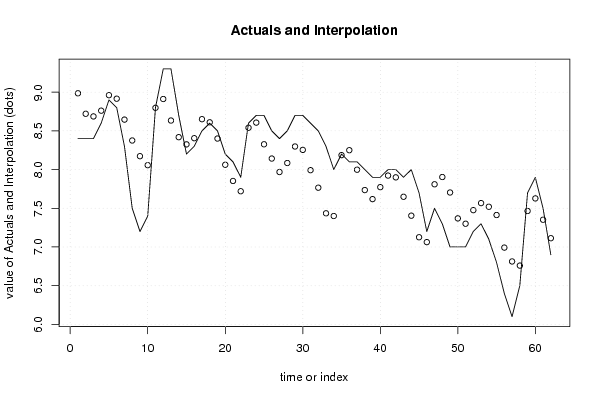
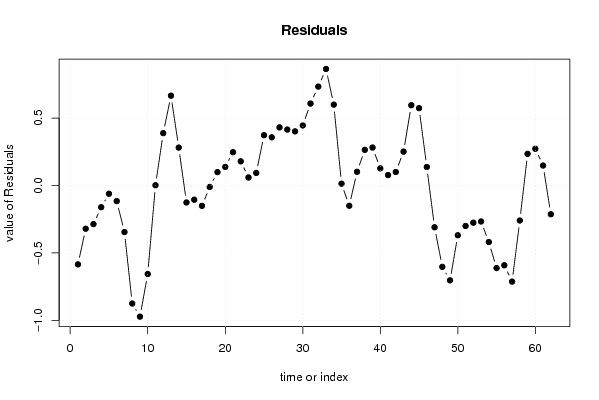
| Multiple Linear Regression - Actuals, Interpolation, and Residuals | |||
| Time or Index | Actuals | Interpolation Forecast | Residuals Prediction Error |
| 1 | 8.4 | 8.9854802141183 | -0.585480214118304 |
| 2 | 8.4 | 8.72077849802058 | -0.320778498020583 |
| 3 | 8.4 | 8.6866960743124 | -0.286696074312398 |
| 4 | 8.6 | 8.76093152440037 | -0.160931524400368 |
| 5 | 8.9 | 8.96119369153699 | -0.061193691536991 |
| 6 | 8.8 | 8.91560412818896 | -0.115604128188956 |
| 7 | 8.3 | 8.64547273191127 | -0.345472731911272 |
| 8 | 7.5 | 8.37569130876158 | -0.875691308761584 |
| 9 | 7.2 | 8.17324618750619 | -0.97324618750619 |
| 10 | 7.4 | 8.05691402574397 | -0.656914025743966 |
| 11 | 8.8 | 8.79804924944435 | 0.00195075055565072 |
| 12 | 9.3 | 8.91167381010519 | 0.388326189894816 |
| 13 | 9.3 | 8.63344223087177 | 0.666557769128233 |
| 14 | 8.7 | 8.41852256334251 | 0.281477436657489 |
| 15 | 8.2 | 8.3259243983346 | -0.125924398334592 |
| 16 | 8.3 | 8.40540006406134 | -0.105400064061340 |
| 17 | 8.5 | 8.65107743340075 | -0.151077433400746 |
| 18 | 8.6 | 8.6107280856915 | -0.0107280856914942 |
| 19 | 8.5 | 8.4008591692598 | 0.0991408307401932 |
| 20 | 8.2 | 8.06208157353282 | 0.137918426467182 |
| 21 | 8.1 | 7.85264949809238 | 0.247350501907618 |
| 22 | 7.9 | 7.72059668941381 | 0.179403310586191 |
| 23 | 8.6 | 8.54033514769593 | 0.0596648523040709 |
| 24 | 8.7 | 8.60679776760772 | 0.0932022323922777 |
| 25 | 8.7 | 8.32681944982804 | 0.373180550171955 |
| 26 | 8.5 | 8.14246770685835 | 0.357532293141649 |
| 27 | 8.4 | 7.9686461994493 | 0.431353800550695 |
| 28 | 8.5 | 8.08480337464753 | 0.415196625352469 |
| 29 | 8.7 | 8.29816608088111 | 0.401833919118887 |
| 30 | 8.7 | 8.25432325607934 | 0.445676743920661 |
| 31 | 8.6 | 7.99205218325983 | 0.607947816740172 |
| 32 | 8.5 | 7.76593922376666 | 0.734060776233341 |
| 33 | 8.3 | 7.4351088193611 | 0.864891180638903 |
| 34 | 8 | 7.4 | 0.6 |
| 35 | 8.2 | 8.18655042590316 | 0.0134495740968354 |
| 36 | 8.1 | 8.25039293799557 | -0.150392937995566 |
| 37 | 8.1 | 7.99836243695606 | 0.101637563043939 |
| 38 | 8 | 7.73540745940463 | 0.264592540595368 |
| 39 | 7.9 | 7.61835495474906 | 0.281645045250939 |
| 40 | 7.9 | 7.77294037796503 | 0.127059622034975 |
| 41 | 8 | 7.92254712726009 | 0.0774528727399124 |
| 42 | 8 | 7.89966516501344 | 0.100334834986557 |
| 43 | 7.9 | 7.64874789274463 | 0.251252107255373 |
| 44 | 8 | 7.40429417851572 | 0.59570582148428 |
| 45 | 7.7 | 7.12586593049798 | 0.574134069502017 |
| 46 | 7.2 | 7.06280929439671 | 0.137190705603287 |
| 47 | 7.5 | 7.81005810300901 | -0.310058103009009 |
| 48 | 7.3 | 7.90359517038784 | -0.603595170387844 |
| 49 | 7 | 7.70396682573616 | -0.703966825736163 |
| 50 | 7 | 7.36939556778804 | -0.369395567788042 |
| 51 | 7 | 7.30037837315464 | -0.300378373154644 |
| 52 | 7.2 | 7.47592465892574 | -0.275924658925736 |
| 53 | 7.3 | 7.56701566692106 | -0.267015666921062 |
| 54 | 7.1 | 7.51967936502677 | -0.419679365026767 |
| 55 | 6.8 | 7.41286802282447 | -0.612868022824466 |
| 56 | 6.4 | 6.99199371542322 | -0.591993715423219 |
| 57 | 6.1 | 6.81312956454235 | -0.713129564542348 |
| 58 | 6.5 | 6.75967999044551 | -0.259679990445511 |
| 59 | 7.7 | 7.46500707394755 | 0.234992926052452 |
| 60 | 7.9 | 7.62754031390369 | 0.272459686096316 |
| 61 | 7.5 | 7.35192884248966 | 0.148071157510341 |
| 62 | 6.9 | 7.11342820458588 | -0.213428204585881 |
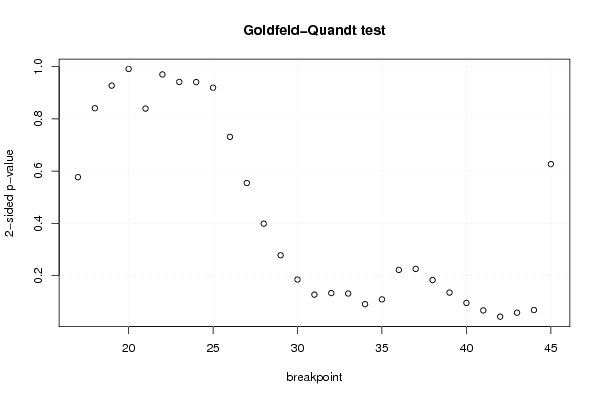
| Goldfeld-Quandt test for Heteroskedasticity | |||
| p-values | Alternative Hypothesis | ||
| breakpoint index | greater | 2-sided | less |
| 17 | 0.711589009135627 | 0.576821981728747 | 0.288410990864373 |
| 18 | 0.579622099510695 | 0.84075580097861 | 0.420377900489305 |
| 19 | 0.463638306938551 | 0.927276613877101 | 0.536361693061449 |
| 20 | 0.504391721543718 | 0.991216556912563 | 0.495608278456282 |
| 21 | 0.580260135005579 | 0.839479729988841 | 0.419739864994421 |
| 22 | 0.514880959126333 | 0.970238081747335 | 0.485119040873667 |
| 23 | 0.470691918950193 | 0.941383837900385 | 0.529308081049807 |
| 24 | 0.529537350370308 | 0.940925299259383 | 0.470462649629692 |
| 25 | 0.459691182011698 | 0.919382364023395 | 0.540308817988302 |
| 26 | 0.365469013549692 | 0.730938027099383 | 0.634530986450308 |
| 27 | 0.277178454412107 | 0.554356908824215 | 0.722821545587893 |
| 28 | 0.199354354653113 | 0.398708709306225 | 0.800645645346888 |
| 29 | 0.138814228890680 | 0.277628457781360 | 0.86118577110932 |
| 30 | 0.0922940444822546 | 0.184588088964509 | 0.907705955517745 |
| 31 | 0.0634712853925621 | 0.126942570785124 | 0.936528714607438 |
| 32 | 0.0664497782445967 | 0.132899556489193 | 0.933550221755403 |
| 33 | 0.0655712858138789 | 0.131142571627758 | 0.934428714186121 |
| 34 | 0.0452374549537841 | 0.0904749099075682 | 0.954762545046216 |
| 35 | 0.0543210058990873 | 0.108642011798175 | 0.945678994100913 |
| 36 | 0.110744823025405 | 0.22148964605081 | 0.889255176974595 |
| 37 | 0.112748665535106 | 0.225497331070213 | 0.887251334464894 |
| 38 | 0.0913332908430246 | 0.182666581686049 | 0.908666709156975 |
| 39 | 0.067408095740584 | 0.134816191481168 | 0.932591904259416 |
| 40 | 0.0475772995962073 | 0.0951545991924146 | 0.952422700403793 |
| 41 | 0.0332520791887349 | 0.0665041583774697 | 0.966747920811265 |
| 42 | 0.0212878885804527 | 0.0425757771609055 | 0.978712111419547 |
| 43 | 0.0289161247545929 | 0.0578322495091858 | 0.971083875245407 |
| 44 | 0.0339757542625198 | 0.0679515085250397 | 0.96602424573748 |
| 45 | 0.313321462055144 | 0.626642924110289 | 0.686678537944855 |
| Meta Analysis of Goldfeld-Quandt test for Heteroskedasticity | |||
| Description | # significant tests | % significant tests | OK/NOK |
| 1% type I error level | 0 | 0 | OK |
| 5% type I error level | 1 | 0.0344827586206897 | OK |
| 10% type I error level | 6 | 0.206896551724138 | NOK |