| Multiple Linear Regression - Estimated Regression Equation |
| X[t] = + 15.9233811697884 -0.0770963900381123Y[t] + 0.996295645871979M1[t] + 0.762999863713578M2[t] + 0.344480759308709M3[t] -0.0705681875557902M4[t] + 0.149521935264028M5[t] + 0.206663386712050M6[t] + 0.754543431491648M7[t] -0.0342476813499836M8[t] -0.366763349395718M9[t] + 0.311865128579307M10[t] -0.944976434817711M11[t] + e[t] |
| Multiple Linear Regression - Ordinary Least Squares | |||||
| Variable | Parameter | S.D. | T-STAT H0: parameter = 0 | 2-tail p-value | 1-tail p-value |
| (Intercept) | 15.9233811697884 | 1.594683 | 9.9853 | 0 | 0 |
| Y | -0.0770963900381123 | 0.015817 | -4.8741 | 1.2e-05 | 6e-06 |
| M1 | 0.996295645871979 | 0.424485 | 2.3471 | 0.023007 | 0.011504 |
| M2 | 0.762999863713578 | 0.4263 | 1.7898 | 0.079663 | 0.039832 |
| M3 | 0.344480759308709 | 0.398075 | 0.8654 | 0.391055 | 0.195528 |
| M4 | -0.0705681875557902 | 0.37734 | -0.187 | 0.852421 | 0.426211 |
| M5 | 0.149521935264028 | 0.377829 | 0.3957 | 0.694015 | 0.347008 |
| M6 | 0.206663386712050 | 0.379752 | 0.5442 | 0.588767 | 0.294384 |
| M7 | 0.754543431491648 | 0.428583 | 1.7606 | 0.084554 | 0.042277 |
| M8 | -0.0342476813499836 | 0.390916 | -0.0876 | 0.930545 | 0.465272 |
| M9 | -0.366763349395718 | 0.386312 | -0.9494 | 0.347078 | 0.173539 |
| M10 | 0.311865128579307 | 0.44705 | 0.6976 | 0.48872 | 0.24436 |
| M11 | -0.944976434817711 | 0.414852 | -2.2779 | 0.027134 | 0.013567 |
| Multiple Linear Regression - Regression Statistics | |
| Multiple R | 0.659051412074979 |
| R-squared | 0.434348763758023 |
| Adjusted R-squared | 0.295821930392641 |
| F-TEST (value) | 3.13548467979755 |
| F-TEST (DF numerator) | 12 |
| F-TEST (DF denominator) | 49 |
| p-value | 0.00228889097970797 |
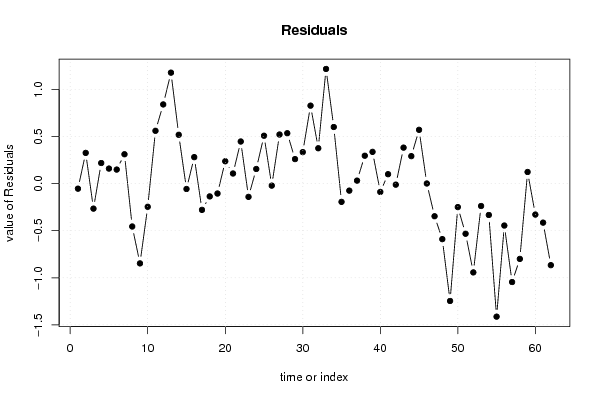
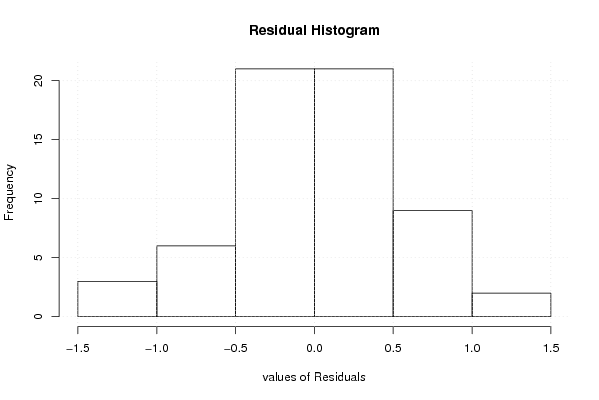
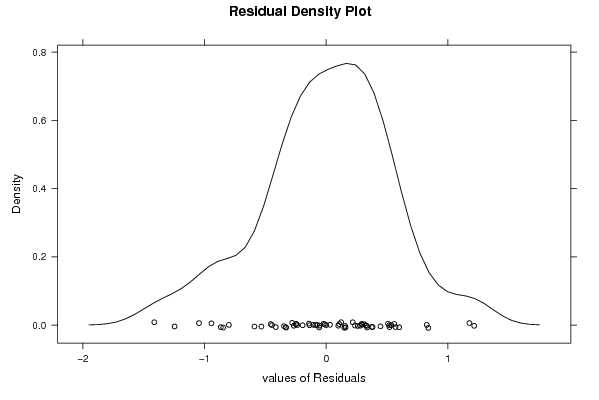
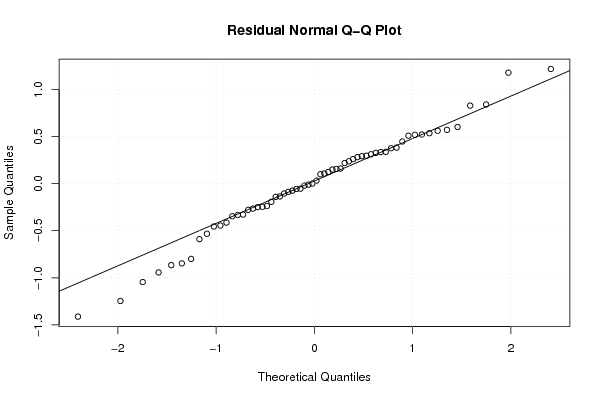
| Multiple Linear Regression - Residual Statistics | |
| Residual Standard Deviation | 0.595921221440596 |
| Sum Squared Residuals | 17.4009830059994 |
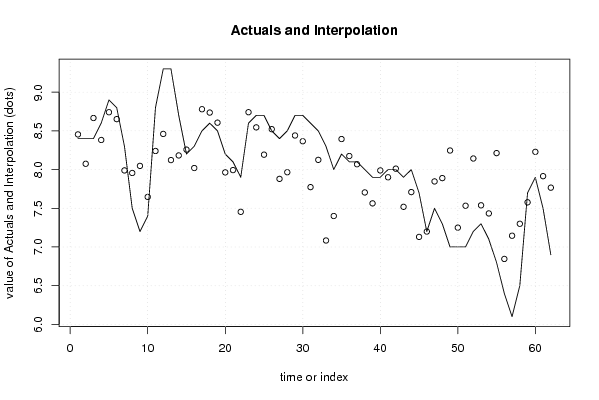
| Multiple Linear Regression - Actuals, Interpolation, and Residuals | |||
| Time or Index | Actuals | Interpolation Forecast | Residuals Prediction Error |
| 1 | 8.4 | 8.45449318947566 | -0.0544931894756573 |
| 2 | 8.4 | 8.0747142662448 | 0.325285733755204 |
| 3 | 8.4 | 8.6661578713392 | -0.266157871339199 |
| 4 | 8.6 | 8.38217278753949 | 0.217827212460509 |
| 5 | 8.9 | 8.74103641242791 | 0.158963587572089 |
| 6 | 8.8 | 8.65169472280352 | 0.148305277196481 |
| 7 | 8.3 | 7.98916144398475 | 0.310838556015246 |
| 8 | 7.5 | 7.95591495351662 | -0.455914953516623 |
| 9 | 7.2 | 8.0474294306805 | -0.847429430680506 |
| 10 | 7.4 | 7.64670844812196 | -0.246708448121959 |
| 11 | 8.8 | 8.24018024563964 | 0.559819754360364 |
| 12 | 9.3 | 8.4604506140991 | 0.83954938590091 |
| 13 | 9.3 | 8.12297871231173 | 1.17702128768827 |
| 14 | 8.7 | 8.18264921229816 | 0.517350787701845 |
| 15 | 8.2 | 8.2575470041372 | -0.0575470041372048 |
| 16 | 8.3 | 8.01981975436036 | 0.280180245639637 |
| 17 | 8.5 | 8.77958460744697 | -0.279584607446968 |
| 18 | 8.6 | 8.73650075184544 | -0.136500751845443 |
| 19 | 8.5 | 8.60593256428965 | -0.105932564289653 |
| 20 | 8.2 | 7.96362459252043 | 0.236375407479564 |
| 21 | 8.1 | 7.99346195765383 | 0.106538042346171 |
| 22 | 7.9 | 7.45396747302668 | 0.446032526973322 |
| 23 | 8.6 | 8.74130678088737 | -0.141306780887367 |
| 24 | 8.7 | 8.54525664314102 | 0.154743356858984 |
| 25 | 8.7 | 8.19236546334603 | 0.50763453665397 |
| 26 | 8.5 | 8.52187332846585 | -0.0218733284658483 |
| 27 | 8.4 | 7.87977469295045 | 0.520225307049546 |
| 28 | 8.5 | 7.96585228133369 | 0.534147718666315 |
| 29 | 8.7 | 8.44036049127927 | 0.259639508720726 |
| 30 | 8.7 | 8.3664380796625 | 0.333561920337495 |
| 31 | 8.6 | 7.77329155187804 | 0.82670844812196 |
| 32 | 8.5 | 8.12552701160047 | 0.374472988399530 |
| 33 | 8.3 | 7.0837245552041 | 1.21627544479590 |
| 34 | 8 | 7.4 | 0.6 |
| 35 | 8.2 | 8.39437302571586 | -0.194373025715862 |
| 36 | 8.1 | 8.17519397095808 | -0.0751939709580769 |
| 37 | 8.1 | 8.06901123928505 | 0.0309887607149493 |
| 38 | 8 | 7.70465159406186 | 0.295348405938142 |
| 39 | 7.9 | 7.56367949379419 | 0.336320506205807 |
| 40 | 7.9 | 7.98898119834512 | -0.088981198345118 |
| 41 | 8 | 7.90068576101249 | 0.0993142389875127 |
| 42 | 8 | 8.01179468548719 | -0.0117946854871877 |
| 43 | 7.9 | 7.51887346475227 | 0.381126535247730 |
| 44 | 8 | 7.70920650539466 | 0.290793494605335 |
| 45 | 7.7 | 7.12998238922697 | 0.57001761077303 |
| 46 | 7.2 | 7.19954938590091 | 0.000450614099091947 |
| 47 | 7.5 | 7.84698865644526 | -0.346988656445265 |
| 48 | 7.3 | 7.88993732781706 | -0.589937327817061 |
| 49 | 7 | 8.24633293637271 | -1.24633293637271 |
| 50 | 7 | 7.249782892837 | -0.249782892836995 |
| 51 | 7 | 7.53284093777895 | -0.532840937778949 |
| 52 | 7.2 | 8.14317397842134 | -0.943173978421343 |
| 53 | 7.3 | 7.53833272783336 | -0.238332727833359 |
| 54 | 7.1 | 7.43357176020135 | -0.333571760201346 |
| 55 | 6.8 | 8.21274097509528 | -1.41274097509528 |
| 56 | 6.4 | 6.8457269369678 | -0.445726936967806 |
| 57 | 6.1 | 7.14540166723459 | -1.04540166723459 |
| 58 | 6.5 | 7.29977469295045 | -0.799774692950454 |
| 59 | 7.7 | 7.57715129131187 | 0.122848708688129 |
| 60 | 7.9 | 8.22916144398476 | -0.329161443984755 |
| 61 | 7.5 | 7.91481845920883 | -0.414818459208826 |
| 62 | 6.9 | 7.76632870609235 | -0.866328706092347 |
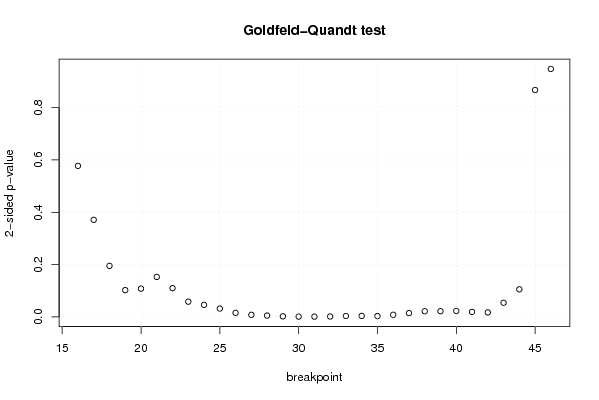
| Goldfeld-Quandt test for Heteroskedasticity | |||
| p-values | Alternative Hypothesis | ||
| breakpoint index | greater | 2-sided | less |
| 16 | 0.288656256314636 | 0.577312512629273 | 0.711343743685364 |
| 17 | 0.185537990109705 | 0.37107598021941 | 0.814462009890295 |
| 18 | 0.0975842354058738 | 0.195168470811748 | 0.902415764594126 |
| 19 | 0.0512089367009808 | 0.102417873401962 | 0.94879106329902 |
| 20 | 0.0540480842533272 | 0.108096168506654 | 0.945951915746673 |
| 21 | 0.0764995145054434 | 0.152999029010887 | 0.923500485494557 |
| 22 | 0.0550627286983965 | 0.110125457396793 | 0.944937271301604 |
| 23 | 0.0291282623335279 | 0.0582565246670557 | 0.970871737666472 |
| 24 | 0.0229918614122505 | 0.0459837228245009 | 0.97700813858775 |
| 25 | 0.0160172664236255 | 0.0320345328472509 | 0.983982733576374 |
| 26 | 0.00781855059471062 | 0.0156371011894212 | 0.99218144940529 |
| 27 | 0.00401307438741618 | 0.00802614877483237 | 0.995986925612584 |
| 28 | 0.00260537272923674 | 0.00521074545847348 | 0.997394627270763 |
| 29 | 0.00117749152481466 | 0.00235498304962932 | 0.998822508475185 |
| 30 | 0.000555115648320069 | 0.00111023129664014 | 0.99944488435168 |
| 31 | 0.000535562917236048 | 0.00107112583447210 | 0.999464437082764 |
| 32 | 0.000831477721426997 | 0.00166295544285399 | 0.999168522278573 |
| 33 | 0.00177050821657676 | 0.00354101643315353 | 0.998229491783423 |
| 34 | 0.00199631325396319 | 0.00399262650792637 | 0.998003686746037 |
| 35 | 0.00160814230362017 | 0.00321628460724034 | 0.99839185769638 |
| 36 | 0.00412641200389955 | 0.0082528240077991 | 0.9958735879961 |
| 37 | 0.00733390153005977 | 0.0146678030601195 | 0.99266609846994 |
| 38 | 0.0109233368972966 | 0.0218466737945931 | 0.989076663102703 |
| 39 | 0.0109605826596985 | 0.0219211653193970 | 0.989039417340301 |
| 40 | 0.0114011619941477 | 0.0228023239882954 | 0.988598838005852 |
| 41 | 0.0095906890805261 | 0.0191813781610522 | 0.990409310919474 |
| 42 | 0.00866992213408834 | 0.0173398442681767 | 0.991330077865912 |
| 43 | 0.0270958802743233 | 0.0541917605486465 | 0.972904119725677 |
| 44 | 0.0527791089135693 | 0.105558217827139 | 0.947220891086431 |
| 45 | 0.433671202761077 | 0.867342405522153 | 0.566328797238923 |
| 46 | 0.526056830913735 | 0.94788633817253 | 0.473943169086265 |
| Meta Analysis of Goldfeld-Quandt test for Heteroskedasticity | |||
| Description | # significant tests | % significant tests | OK/NOK |
| 1% type I error level | 10 | 0.32258064516129 | NOK |
| 5% type I error level | 19 | 0.612903225806452 | NOK |
| 10% type I error level | 21 | 0.67741935483871 | NOK |