| Multiple Linear Regression - Estimated Regression Equation |
| y[t] = -0.0346622960368248 + 0.0589758078691045x[t] + 1.50682864869239y1[t] -0.632805983146732y2[t] -0.275699725509361y3[t] + 0.431531623605503y4[t] -0.0126969934258707M1[t] -0.209114897281531M2[t] -0.142221133838311M3[t] -0.178080352483085M4[t] -0.238176192560859M5[t] -0.383383749504528M6[t] -0.0469800234484245M7[t] -0.488027705147431M8[t] -0.340348596260656M9[t] -0.213105342498909M10[t] -0.202673655015069M11[t] + 0.00164230830510336t + e[t] |
| Multiple Linear Regression - Ordinary Least Squares | |||||
| Variable | Parameter | S.D. | T-STAT H0: parameter = 0 | 2-tail p-value | 1-tail p-value |
| (Intercept) | -0.0346622960368248 | 0.620921 | -0.0558 | 0.955791 | 0.477895 |
| x | 0.0589758078691045 | 0.094445 | 0.6244 | 0.536273 | 0.268137 |
| y1 | 1.50682864869239 | 0.16233 | 9.2825 | 0 | 0 |
| y2 | -0.632805983146732 | 0.294958 | -2.1454 | 0.038738 | 0.019369 |
| y3 | -0.275699725509361 | 0.299869 | -0.9194 | 0.364007 | 0.182003 |
| y4 | 0.431531623605503 | 0.186137 | 2.3184 | 0.026223 | 0.013112 |
| M1 | -0.0126969934258707 | 0.124226 | -0.1022 | 0.919158 | 0.459579 |
| M2 | -0.209114897281531 | 0.131705 | -1.5877 | 0.121089 | 0.060544 |
| M3 | -0.142221133838311 | 0.135794 | -1.0473 | 0.301929 | 0.150964 |
| M4 | -0.178080352483085 | 0.135795 | -1.3114 | 0.19803 | 0.099015 |
| M5 | -0.238176192560859 | 0.134072 | -1.7765 | 0.084106 | 0.042053 |
| M6 | -0.383383749504528 | 0.134458 | -2.8513 | 0.007165 | 0.003583 |
| M7 | -0.0469800234484245 | 0.13453 | -0.3492 | 0.728962 | 0.364481 |
| M8 | -0.488027705147431 | 0.132214 | -3.6912 | 0.000734 | 0.000367 |
| M9 | -0.340348596260656 | 0.144005 | -2.3635 | 0.023624 | 0.011812 |
| M10 | -0.213105342498909 | 0.12887 | -1.6536 | 0.106895 | 0.053448 |
| M11 | -0.202673655015069 | 0.124838 | -1.6235 | 0.11321 | 0.056605 |
| t | 0.00164230830510336 | 0.003143 | 0.5225 | 0.604525 | 0.302263 |
| Multiple Linear Regression - Regression Statistics | |
| Multiple R | 0.96454395128867 |
| R-squared | 0.93034503396756 |
| Adjusted R-squared | 0.897452411118909 |
| F-TEST (value) | 28.2843067349277 |
| F-TEST (DF numerator) | 17 |
| F-TEST (DF denominator) | 36 |
| p-value | 7.7715611723761e-16 |
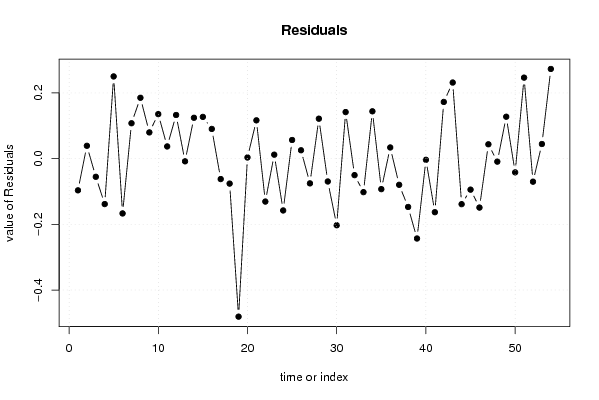
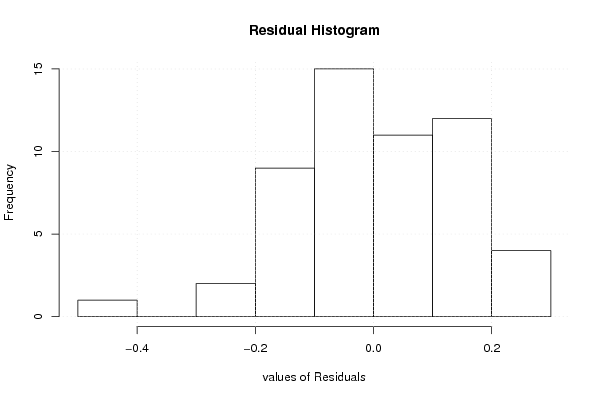
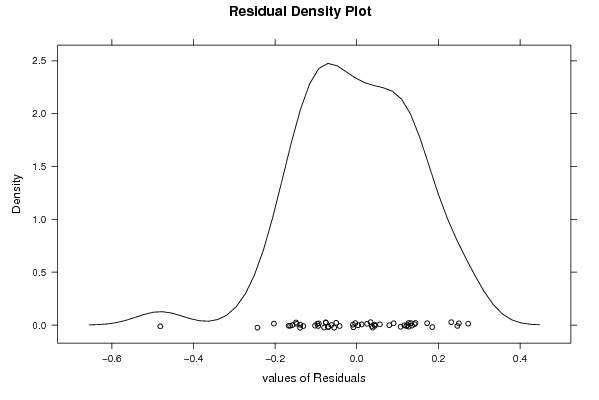
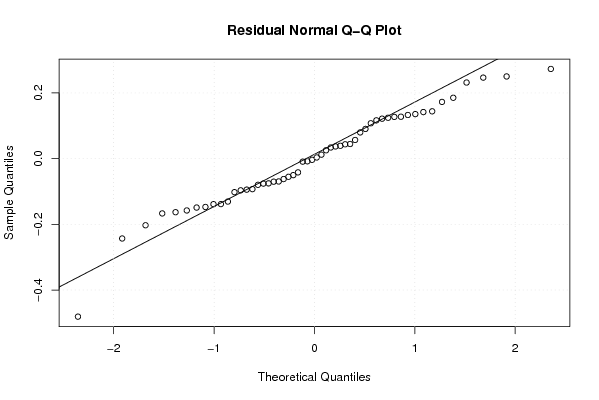
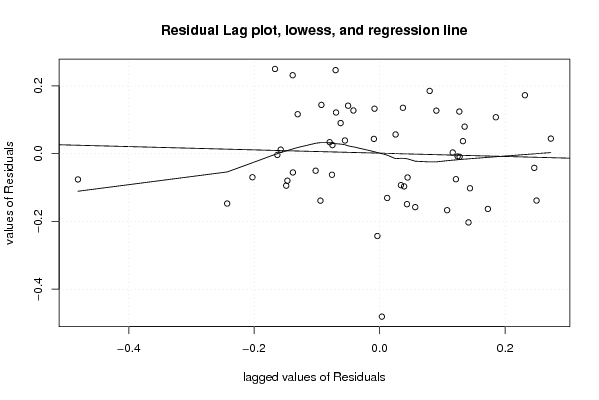
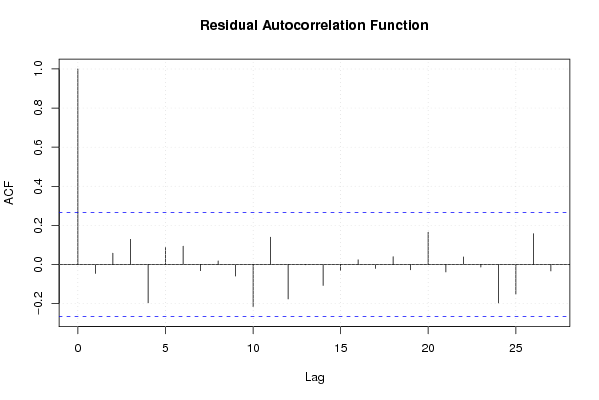
| Multiple Linear Regression - Residual Statistics | |
| Residual Standard Deviation | 0.174263106623220 |
| Sum Squared Residuals | 1.09323469187913 |
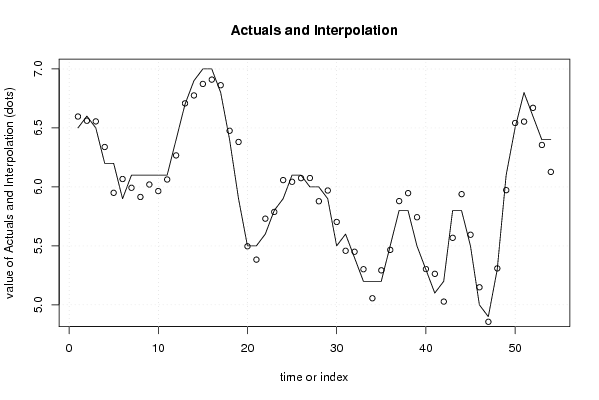
| Multiple Linear Regression - Actuals, Interpolation, and Residuals | |||
| Time or Index | Actuals | Interpolation Forecast | Residuals Prediction Error |
| 1 | 6.5 | 6.59649793896602 | -0.0964979389660187 |
| 2 | 6.6 | 6.56094368671497 | 0.0390563132850288 |
| 3 | 6.5 | 6.55530831924076 | -0.0553083192407632 |
| 4 | 6.2 | 6.33829432533641 | -0.138294325336408 |
| 5 | 6.2 | 5.94980914944086 | 0.250190850559141 |
| 6 | 5.9 | 6.0668088306578 | -0.166808830657799 |
| 7 | 6.1 | 5.99236302570355 | 0.107636974296451 |
| 8 | 6.1 | 5.91470568991049 | 0.185294310089509 |
| 9 | 6.1 | 6.02017582812583 | 0.0798241718741687 |
| 10 | 6.1 | 5.96446195800916 | 0.135538041990841 |
| 11 | 6.1 | 6.0628422785192 | 0.0371577214807976 |
| 12 | 6.4 | 6.26715824183937 | 0.132841758160626 |
| 13 | 6.7 | 6.70815215132632 | -0.00815215132632399 |
| 14 | 6.9 | 6.77558335543946 | 0.124416644560537 |
| 15 | 7 | 6.87293344432944 | 0.127066555670564 |
| 16 | 7 | 6.9095877716585 | 0.0904122283415 |
| 17 | 6.8 | 6.86217318355093 | -0.0621731835509351 |
| 18 | 6.4 | 6.47597855734406 | -0.0759785573440556 |
| 19 | 5.9 | 6.38100749121821 | -0.481007491218206 |
| 20 | 5.5 | 5.49645013183867 | 0.00354986816132527 |
| 21 | 5.5 | 5.38341664660961 | 0.116583353390393 |
| 22 | 5.6 | 5.73066181524763 | -0.13066181524763 |
| 23 | 5.8 | 5.7879327543068 | 0.0120672456931957 |
| 24 | 5.9 | 6.05772119960858 | -0.157721199608579 |
| 25 | 6.1 | 6.04321821017677 | 0.0567817898232305 |
| 26 | 6.1 | 6.07454096330869 | 0.0254590366913063 |
| 27 | 6 | 6.07525219059784 | -0.075252190597835 |
| 28 | 6 | 5.8783656326476 | 0.121634367352395 |
| 29 | 5.9 | 5.96949902391071 | -0.0694990239107069 |
| 30 | 5.5 | 5.70282088295384 | -0.202820882953839 |
| 31 | 5.6 | 5.45826289379221 | 0.141737106207786 |
| 32 | 5.4 | 5.45023275107718 | -0.0502327510771779 |
| 33 | 5.2 | 5.3020345680591 | -0.102034568059102 |
| 34 | 5.2 | 5.05593297502368 | 0.144067024976317 |
| 35 | 5.2 | 5.2928612749044 | -0.0928612749043944 |
| 36 | 5.5 | 5.46601085860534 | 0.0339891413946611 |
| 37 | 5.8 | 5.87967425124029 | -0.0796742512402913 |
| 38 | 5.8 | 5.94710545535343 | -0.147105455353431 |
| 39 | 5.5 | 5.74308981450493 | -0.243089814504926 |
| 40 | 5.3 | 5.30357387898638 | -0.00357387898638284 |
| 41 | 5.1 | 5.2630558995009 | -0.163055899500905 |
| 42 | 5.2 | 5.02739603540602 | 0.172603964593985 |
| 43 | 5.8 | 5.56836658928603 | 0.231633410713970 |
| 44 | 5.8 | 5.93861142717366 | -0.138611427173657 |
| 45 | 5.5 | 5.59437295720546 | -0.0943729572054596 |
| 46 | 5 | 5.14894325171953 | -0.148943251719528 |
| 47 | 4.9 | 4.8563636922696 | 0.043636307730401 |
| 48 | 5.3 | 5.30910969994671 | -0.00910969994670775 |
| 49 | 6.1 | 5.9724574482906 | 0.127542551709403 |
| 50 | 6.5 | 6.54182653918344 | -0.0418265391834409 |
| 51 | 6.8 | 6.55341623132704 | 0.246583768672960 |
| 52 | 6.6 | 6.6701783913711 | -0.070178391371104 |
| 53 | 6.4 | 6.3554627435966 | 0.0445372564034061 |
| 54 | 6.4 | 6.12699569363829 | 0.273004306361709 |
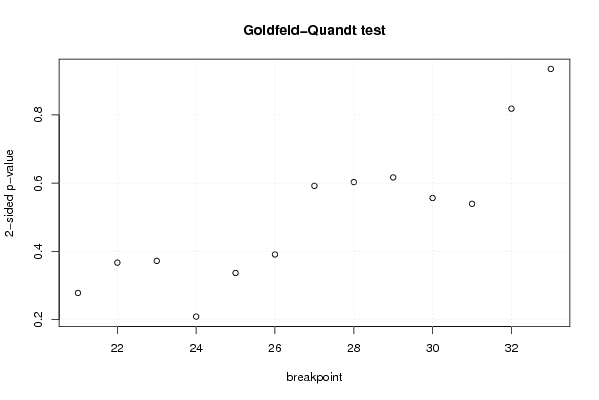
| Goldfeld-Quandt test for Heteroskedasticity | |||
| p-values | Alternative Hypothesis | ||
| breakpoint index | greater | 2-sided | less |
| 21 | 0.86079724994665 | 0.278405500106701 | 0.139202750053350 |
| 22 | 0.816399208721522 | 0.367201582556955 | 0.183600791278478 |
| 23 | 0.813820834029729 | 0.372358331940542 | 0.186179165970271 |
| 24 | 0.895529752167374 | 0.208940495665251 | 0.104470247832626 |
| 25 | 0.831519100812905 | 0.33696179837419 | 0.168480899187095 |
| 26 | 0.804417182977151 | 0.391165634045698 | 0.195582817022849 |
| 27 | 0.703922111633623 | 0.592155776732755 | 0.296077888366378 |
| 28 | 0.698365639199375 | 0.60326872160125 | 0.301634360800625 |
| 29 | 0.691525026063976 | 0.616949947872048 | 0.308474973936024 |
| 30 | 0.721648994756723 | 0.556702010486554 | 0.278351005243277 |
| 31 | 0.73019769261714 | 0.53960461476572 | 0.26980230738286 |
| 32 | 0.590892394428852 | 0.818215211142295 | 0.409107605571148 |
| 33 | 0.467412592136979 | 0.934825184273957 | 0.532587407863021 |
| Meta Analysis of Goldfeld-Quandt test for Heteroskedasticity | |||
| Description | # significant tests | % significant tests | OK/NOK |
| 1% type I error level | 0 | 0 | OK |
| 5% type I error level | 0 | 0 | OK |
| 10% type I error level | 0 | 0 | OK |