| Multiple Linear Regression - Estimated Regression Equation |
| Tprod[t] = + 104.239014386218 -0.949163093002725Rente[t] -0.429150643259583M1[t] -0.389285793353394M2[t] -0.376879098097416M3[t] -0.35979416242337M4[t] -0.266505879121328M5[t] -0.169285793353391M6[t] -0.0816924886093766M7[t] -0.0635908147953803M8[t] -0.103455664701495M9[t] -0.0986422741895337M10[t] -0.037490385955704M11[t] + e[t] |
| Multiple Linear Regression - Ordinary Least Squares | |||||
| Variable | Parameter | S.D. | T-STAT H0: parameter = 0 | 2-tail p-value | 1-tail p-value |
| (Intercept) | 104.239014386218 | 0.460177 | 226.5196 | 0 | 0 |
| Rente | -0.949163093002725 | 0.101565 | -9.3454 | 0 | 0 |
| M1 | -0.429150643259583 | 0.49181 | -0.8726 | 0.38732 | 0.19366 |
| M2 | -0.389285793353394 | 0.491987 | -0.7913 | 0.432772 | 0.216386 |
| M3 | -0.376879098097416 | 0.49195 | -0.7661 | 0.447452 | 0.223726 |
| M4 | -0.35979416242337 | 0.492035 | -0.7312 | 0.468264 | 0.234132 |
| M5 | -0.266505879121328 | 0.492105 | -0.5416 | 0.590677 | 0.295339 |
| M6 | -0.169285793353391 | 0.491987 | -0.3441 | 0.732316 | 0.366158 |
| M7 | -0.0816924886093766 | 0.492025 | -0.166 | 0.868843 | 0.434421 |
| M8 | -0.0635908147953803 | 0.492015 | -0.1292 | 0.897715 | 0.448857 |
| M9 | -0.103455664701495 | 0.491833 | -0.2103 | 0.834306 | 0.417153 |
| M10 | -0.0986422741895337 | 0.491773 | -0.2006 | 0.841889 | 0.420944 |
| M11 | -0.037490385955704 | 0.491592 | -0.0763 | 0.939533 | 0.469767 |
| Multiple Linear Regression - Regression Statistics | |
| Multiple R | 0.811936829502331 |
| R-squared | 0.659241415102298 |
| Adjusted R-squared | 0.572239223213523 |
| F-TEST (value) | 7.57729662656181 |
| F-TEST (DF numerator) | 12 |
| F-TEST (DF denominator) | 47 |
| p-value | 1.54445368716338e-07 |
| Multiple Linear Regression - Residual Statistics | |
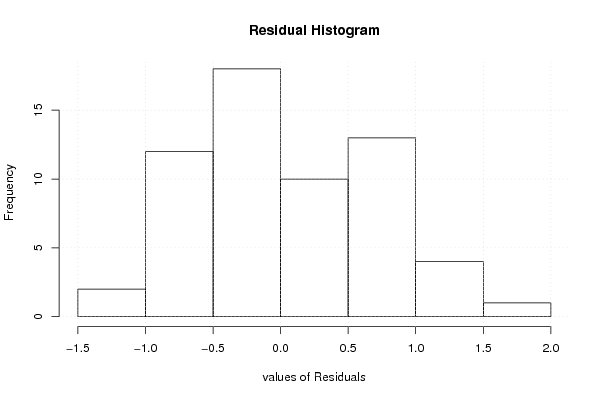
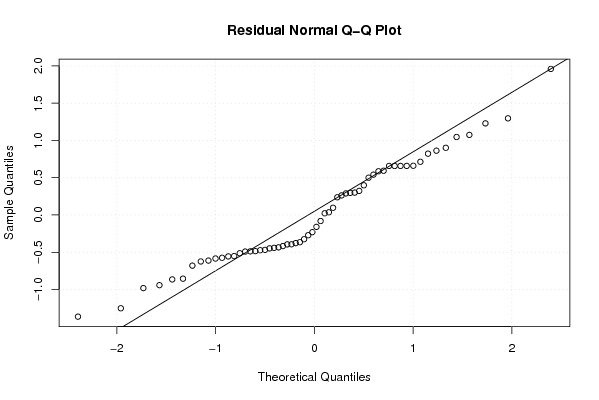
| Residual Standard Deviation | 0.77708225964867 |
| Sum Squared Residuals | 28.3812713982522 |
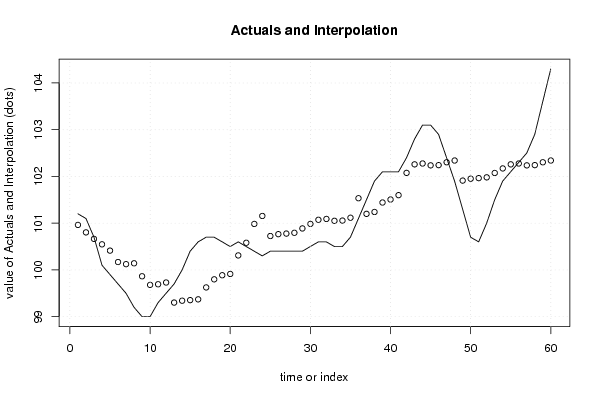
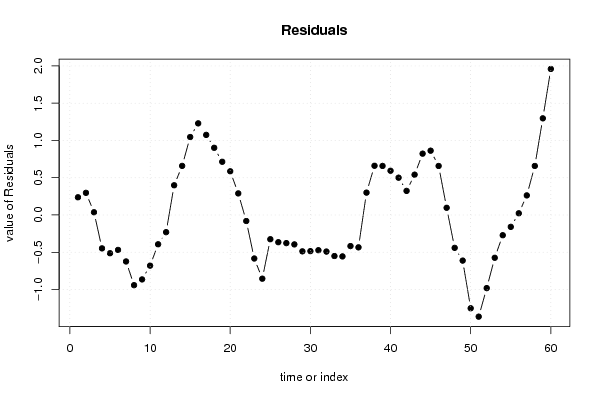
| Multiple Linear Regression - Actuals, Interpolation, and Residuals | |||
| Time or Index | Actuals | Interpolation Forecast | Residuals Prediction Error |
| 1 | 101.2 | 100.962374463951 | 0.237625536049289 |
| 2 | 101.1 | 100.802915064326 | 0.297084935674034 |
| 3 | 100.7 | 100.663455664701 | 0.0365443352985084 |
| 4 | 100.1 | 100.547657767355 | -0.447657767355165 |
| 5 | 99.9 | 100.413146908337 | -0.513146908336542 |
| 6 | 99.7 | 100.168668280624 | -0.4686682806235 |
| 7 | 99.5 | 100.123378752347 | -0.623378752347136 |
| 8 | 99.2 | 100.141480426161 | -0.94148042616113 |
| 9 | 99 | 99.8643248030043 | -0.864324803004337 |
| 10 | 99 | 99.6793055749158 | -0.679305574915753 |
| 11 | 99.3 | 99.6929993084995 | -0.39299930849945 |
| 12 | 99.5 | 99.7304896944551 | -0.230489694455151 |
| 13 | 99.7 | 99.3013390511956 | 0.398660948804435 |
| 14 | 100 | 99.3412039011017 | 0.658796098898244 |
| 15 | 100.4 | 99.3536105963577 | 1.04638940364227 |
| 16 | 100.6 | 99.3706955320318 | 1.22930446796821 |
| 17 | 100.7 | 99.6253415411443 | 1.07465845885572 |
| 18 | 100.7 | 99.7984946743524 | 0.901505325647562 |
| 19 | 100.6 | 99.8860879790965 | 0.713912020903539 |
| 20 | 100.5 | 99.9136812838405 | 0.586318716159522 |
| 21 | 100.6 | 100.310431456716 | 0.289568543284378 |
| 22 | 100.5 | 100.581010513268 | -0.081010513268341 |
| 23 | 100.4 | 100.983861114983 | -0.583861114983145 |
| 24 | 100.3 | 101.154234333959 | -0.85423433395924 |
| 25 | 100.4 | 100.725083690700 | -0.325083690699647 |
| 26 | 100.4 | 100.764948540606 | -0.364948540605836 |
| 27 | 100.4 | 100.777355235862 | -0.377355235861815 |
| 28 | 100.4 | 100.794440171536 | -0.394440171535861 |
| 29 | 100.4 | 100.887728454838 | -0.487728454837904 |
| 30 | 100.5 | 100.984948540606 | -0.484948540605845 |
| 31 | 100.6 | 101.072541845350 | -0.472541845349865 |
| 32 | 100.6 | 101.090643519164 | -0.490643519163862 |
| 33 | 100.5 | 101.050778669258 | -0.550778669257742 |
| 34 | 100.5 | 101.055592059770 | -0.555592059769703 |
| 35 | 100.7 | 101.116743948004 | -0.41674394800353 |
| 36 | 101.1 | 101.533899571160 | -0.433899571160332 |
| 37 | 101.5 | 101.199665237201 | 0.300334762798985 |
| 38 | 101.9 | 101.239530087107 | 0.660469912892802 |
| 39 | 102.1 | 101.441769400964 | 0.658230599036267 |
| 40 | 102.1 | 101.506312491288 | 0.593687508712085 |
| 41 | 102.1 | 101.59960077459 | 0.500399225410042 |
| 42 | 102.4 | 102.076486097559 | 0.323513902441028 |
| 43 | 102.8 | 102.258995711603 | 0.541004288396733 |
| 44 | 103.1 | 102.277097385417 | 0.822902614582734 |
| 45 | 103.1 | 102.237232535511 | 0.862767464488848 |
| 46 | 102.9 | 102.242045926023 | 0.657954073976898 |
| 47 | 102.4 | 102.303197814257 | 0.0968021857430683 |
| 48 | 101.9 | 102.340688200213 | -0.440688200212636 |
| 49 | 101.3 | 101.911537556953 | -0.61153755695306 |
| 50 | 100.7 | 101.951402406859 | -1.25140240685924 |
| 51 | 100.6 | 101.963809102115 | -1.36380910211523 |
| 52 | 101 | 101.980894037789 | -0.980894037789271 |
| 53 | 101.5 | 102.074182321091 | -0.574182321091314 |
| 54 | 101.9 | 102.171402406859 | -0.271402406859245 |
| 55 | 102.1 | 102.258995711603 | -0.158995711603270 |
| 56 | 102.3 | 102.277097385417 | 0.0229026145827360 |
| 57 | 102.5 | 102.237232535511 | 0.262767464488854 |
| 58 | 102.9 | 102.242045926023 | 0.657954073976898 |
| 59 | 103.6 | 102.303197814257 | 1.29680218574306 |
| 60 | 104.3 | 102.340688200213 | 1.95931179978736 |
| Goldfeld-Quandt test for Heteroskedasticity | |||
| p-values | Alternative Hypothesis | ||
| breakpoint index | greater | 2-sided | less |
| 16 | 0.310535172926722 | 0.621070345853444 | 0.689464827073278 |
| 17 | 0.367070722331768 | 0.734141444663536 | 0.632929277668232 |
| 18 | 0.40803609784493 | 0.81607219568986 | 0.59196390215507 |
| 19 | 0.450205515440260 | 0.900411030880519 | 0.54979448455974 |
| 20 | 0.525403245678041 | 0.949193508643918 | 0.474596754321959 |
| 21 | 0.584776897928257 | 0.830446204143486 | 0.415223102071743 |
| 22 | 0.559633362405663 | 0.880733275188675 | 0.440366637594337 |
| 23 | 0.472848271027772 | 0.945696542055544 | 0.527151728972228 |
| 24 | 0.393985090425049 | 0.787970180850097 | 0.606014909574951 |
| 25 | 0.305518483760296 | 0.611036967520592 | 0.694481516239704 |
| 26 | 0.236717165607875 | 0.473434331215749 | 0.763282834392125 |
| 27 | 0.180154029960253 | 0.360308059920505 | 0.819845970039747 |
| 28 | 0.125256022698981 | 0.250512045397962 | 0.874743977301019 |
| 29 | 0.0822495734847573 | 0.164499146969515 | 0.917750426515243 |
| 30 | 0.0504243856351433 | 0.100848771270287 | 0.949575614364857 |
| 31 | 0.0297346467966931 | 0.0594692935933862 | 0.970265353203307 |
| 32 | 0.0183576898787099 | 0.0367153797574197 | 0.98164231012129 |
| 33 | 0.0123361745475252 | 0.0246723490950505 | 0.987663825452475 |
| 34 | 0.0109066399323343 | 0.0218132798646686 | 0.989093360067666 |
| 35 | 0.0205022624493418 | 0.0410045248986836 | 0.979497737550658 |
| 36 | 0.177526622175992 | 0.355053244351985 | 0.822473377824008 |
| 37 | 0.185873924441009 | 0.371747848882018 | 0.814126075558991 |
| 38 | 0.159589218121650 | 0.319178436243301 | 0.84041078187835 |
| 39 | 0.135663122865382 | 0.271326245730764 | 0.864336877134618 |
| 40 | 0.107365958627557 | 0.214731917255113 | 0.892634041372443 |
| 41 | 0.0796688807366614 | 0.159337761473323 | 0.920331119263339 |
| 42 | 0.0499417203704934 | 0.0998834407409868 | 0.950058279629507 |
| 43 | 0.0392018293923445 | 0.078403658784689 | 0.960798170607656 |
| 44 | 0.0342409380334964 | 0.0684818760669927 | 0.965759061966504 |
| Meta Analysis of Goldfeld-Quandt test for Heteroskedasticity | |||
| Description | # significant tests | % significant tests | OK/NOK |
| 1% type I error level | 0 | 0 | OK |
| 5% type I error level | 4 | 0.137931034482759 | NOK |
| 10% type I error level | 8 | 0.275862068965517 | NOK |