| Multiple Linear Regression - Estimated Regression Equation |
| TWV[t] = + 5.8018408319185 + 0.169475099037918`WV-25`[t] + 0.391285653650254M1[t] + 0.0452611771363897M2[t] + 0.179236700622525M3[t] + 0.627087860780986M4[t] + 0.641063384267121M5[t] + 0.475038907753255M6[t] + 0.360867996604415M7[t] + 0.114843520090550M8[t] + 0.168819043576685M9[t] -0.027951046972269M10[t] + 0.206024476513865M11[t] -0.0339755234861347t + e[t] |
| Multiple Linear Regression - Ordinary Least Squares | |||||
| Variable | Parameter | S.D. | T-STAT H0: parameter = 0 | 2-tail p-value | 1-tail p-value |
| (Intercept) | 5.8018408319185 | 0.546032 | 10.6255 | 0 | 0 |
| `WV-25` | 0.169475099037918 | 0.019263 | 8.798 | 0 | 0 |
| M1 | 0.391285653650254 | 0.22511 | 1.7382 | 0.088866 | 0.044433 |
| M2 | 0.0452611771363897 | 0.224496 | 0.2016 | 0.841109 | 0.420554 |
| M3 | 0.179236700622525 | 0.223911 | 0.8005 | 0.427547 | 0.213773 |
| M4 | 0.627087860780986 | 0.234967 | 2.6688 | 0.010479 | 0.00524 |
| M5 | 0.641063384267121 | 0.234371 | 2.7353 | 0.008824 | 0.004412 |
| M6 | 0.475038907753255 | 0.233802 | 2.0318 | 0.047973 | 0.023987 |
| M7 | 0.360867996604415 | 0.239567 | 1.5063 | 0.138818 | 0.069409 |
| M8 | 0.114843520090550 | 0.239023 | 0.4805 | 0.63317 | 0.316585 |
| M9 | 0.168819043576685 | 0.238506 | 0.7078 | 0.482629 | 0.241314 |
| M10 | -0.027951046972269 | 0.204914 | -0.1364 | 0.892097 | 0.446049 |
| M11 | 0.206024476513865 | 0.204864 | 1.0057 | 0.319838 | 0.159919 |
| t | -0.0339755234861347 | 0.002601 | -13.06 | 0 | 0 |
| Multiple Linear Regression - Regression Statistics | |
| Multiple R | 0.94897538063781 |
| R-squared | 0.900554273056676 |
| Adjusted R-squared | 0.872450045877041 |
| F-TEST (value) | 32.0433743756968 |
| F-TEST (DF numerator) | 13 |
| F-TEST (DF denominator) | 46 |
| p-value | 0 |
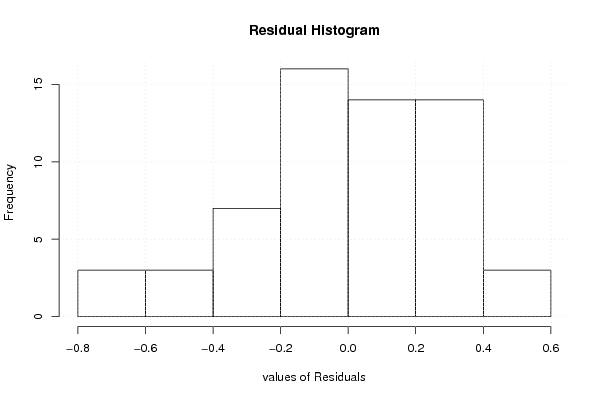
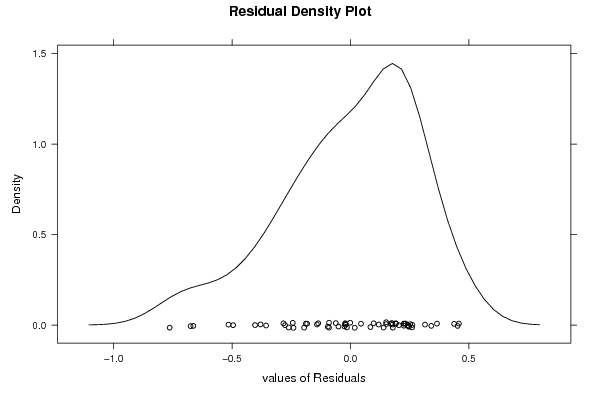
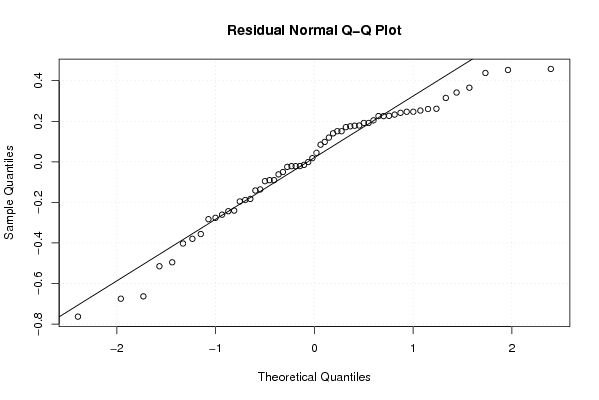
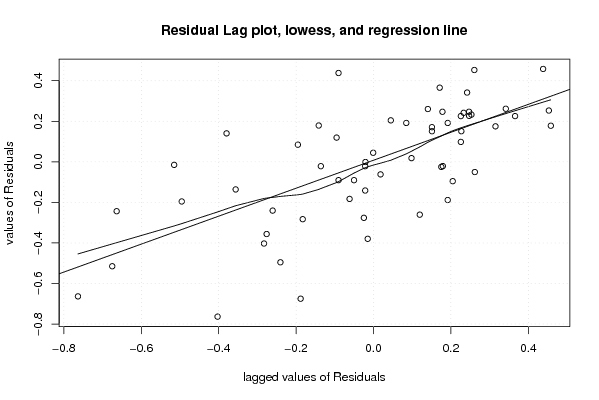
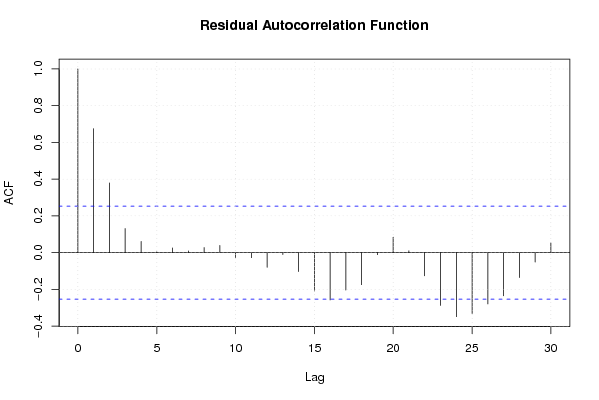
| Multiple Linear Regression - Residual Statistics | |
| Residual Standard Deviation | 0.323892318772898 |
| Sum Squared Residuals | 4.8256867713639 |
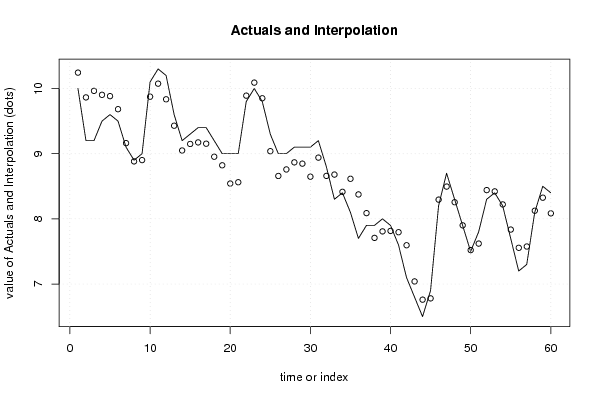
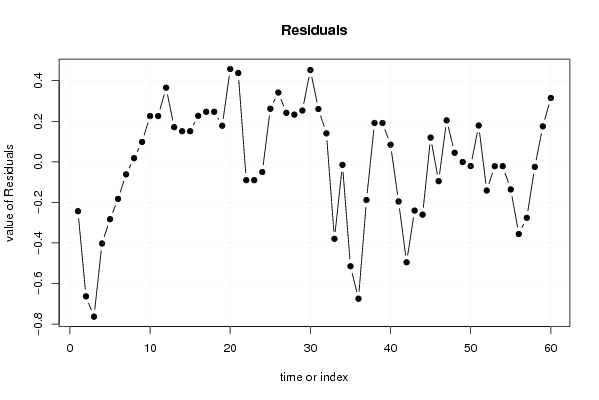
| Multiple Linear Regression - Actuals, Interpolation, and Residuals | |||
| Time or Index | Actuals | Interpolation Forecast | Residuals Prediction Error |
| 1 | 10 | 10.2435008488964 | -0.243500848896442 |
| 2 | 9.2 | 9.86350084889643 | -0.663500848896434 |
| 3 | 9.2 | 9.96350084889643 | -0.763500848896435 |
| 4 | 9.5 | 9.9028462082626 | -0.402846208262591 |
| 5 | 9.6 | 9.8828462082626 | -0.282846208262592 |
| 6 | 9.5 | 9.6828462082626 | -0.182846208262592 |
| 7 | 9.1 | 9.1618545557442 | -0.0618545557441999 |
| 8 | 8.9 | 8.8818545557442 | 0.0181454442558009 |
| 9 | 9 | 8.9018545557442 | 0.0981454442558003 |
| 10 | 10.1 | 9.87438214487832 | 0.225617855121676 |
| 11 | 10.3 | 10.0743821448783 | 0.225617855121676 |
| 12 | 10.2 | 9.83438214487832 | 0.365617855121675 |
| 13 | 9.6 | 9.42905432937182 | 0.170945670628185 |
| 14 | 9.2 | 9.04905432937182 | 0.150945670628183 |
| 15 | 9.3 | 9.14905432937182 | 0.150945670628184 |
| 16 | 9.4 | 9.17313723825693 | 0.226862761743068 |
| 17 | 9.4 | 9.15313723825693 | 0.246862761743068 |
| 18 | 9.2 | 8.95313723825693 | 0.246862761743068 |
| 19 | 9 | 8.82193831352575 | 0.178061686474251 |
| 20 | 9 | 8.54193831352575 | 0.45806168647425 |
| 21 | 9 | 8.56193831352575 | 0.438061686474250 |
| 22 | 9.8 | 9.8903636106395 | -0.0903636106395012 |
| 23 | 10 | 10.0903636106395 | -0.0903636106395018 |
| 24 | 9.8 | 9.8503636106395 | -0.0503636106395007 |
| 25 | 9.3 | 9.038295557442 | 0.261704442558010 |
| 26 | 9 | 8.658295557442 | 0.341704442558008 |
| 27 | 9 | 8.758295557442 | 0.241704442558008 |
| 28 | 9.1 | 8.86711601584607 | 0.232883984153932 |
| 29 | 9.1 | 8.84711601584607 | 0.252883984153933 |
| 30 | 9.1 | 8.64711601584607 | 0.452883984153933 |
| 31 | 9.2 | 8.93960483870968 | 0.260395161290322 |
| 32 | 8.8 | 8.65960483870968 | 0.140395161290323 |
| 33 | 8.3 | 8.67960483870968 | -0.379604838709677 |
| 34 | 8.4 | 8.414964204867 | -0.0149642048670055 |
| 35 | 8.1 | 8.614964204867 | -0.514964204867006 |
| 36 | 7.7 | 8.374964204867 | -0.674964204867005 |
| 37 | 7.9 | 8.08826895868704 | -0.188268958687038 |
| 38 | 7.9 | 7.70826895868704 | 0.19173104131296 |
| 39 | 8 | 7.80826895868704 | 0.191731041312959 |
| 40 | 7.9 | 7.81540435766837 | 0.0845956423316355 |
| 41 | 7.6 | 7.79540435766836 | -0.195404357668365 |
| 42 | 7.1 | 7.59540435766836 | -0.495404357668364 |
| 43 | 6.8 | 7.04051768534239 | -0.240517685342388 |
| 44 | 6.5 | 6.76051768534239 | -0.260517685342388 |
| 45 | 6.9 | 6.78051768534239 | 0.119482314657612 |
| 46 | 8.2 | 8.29536559139785 | -0.0953655913978506 |
| 47 | 8.7 | 8.49536559139785 | 0.204634408602149 |
| 48 | 8.3 | 8.25536559139785 | 0.0446344086021515 |
| 49 | 7.9 | 7.90088030560271 | -0.00088030560271447 |
| 50 | 7.5 | 7.52088030560272 | -0.0208803056027165 |
| 51 | 7.8 | 7.62088030560272 | 0.179119694397283 |
| 52 | 8.3 | 8.44149617996604 | -0.141496179966045 |
| 53 | 8.4 | 8.42149617996605 | -0.0214961799660445 |
| 54 | 8.2 | 8.22149617996604 | -0.0214961799660452 |
| 55 | 7.7 | 7.83608460667799 | -0.136084606677985 |
| 56 | 7.2 | 7.55608460667799 | -0.356084606677986 |
| 57 | 7.3 | 7.57608460667799 | -0.276084606677986 |
| 58 | 8.1 | 8.12492444821732 | -0.0249244482173187 |
| 59 | 8.5 | 8.32492444821732 | 0.175075551782682 |
| 60 | 8.4 | 8.08492444821732 | 0.315075551782682 |
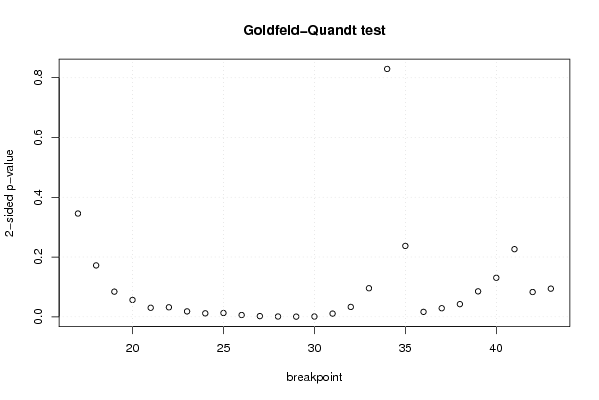
| Goldfeld-Quandt test for Heteroskedasticity | |||
| p-values | Alternative Hypothesis | ||
| breakpoint index | greater | 2-sided | less |
| 17 | 0.172779626822282 | 0.345559253644564 | 0.827220373177718 |
| 18 | 0.0859977206166429 | 0.171995441233286 | 0.914002279383357 |
| 19 | 0.042107397916807 | 0.084214795833614 | 0.957892602083193 |
| 20 | 0.0282338908194061 | 0.0564677816388122 | 0.971766109180594 |
| 21 | 0.0151356531328832 | 0.0302713062657664 | 0.984864346867117 |
| 22 | 0.0159286522869259 | 0.0318573045738519 | 0.984071347713074 |
| 23 | 0.00909840878325215 | 0.0181968175665043 | 0.990901591216748 |
| 24 | 0.00586030098722628 | 0.0117206019744526 | 0.994139699012774 |
| 25 | 0.00640955784415428 | 0.0128191156883086 | 0.993590442155846 |
| 26 | 0.00295772033001304 | 0.00591544066002609 | 0.997042279669987 |
| 27 | 0.00117729782321747 | 0.00235459564643493 | 0.998822702176783 |
| 28 | 0.000509642846894112 | 0.00101928569378822 | 0.999490357153106 |
| 29 | 0.000279626406053876 | 0.000559252812107753 | 0.999720373593946 |
| 30 | 0.000445376683116328 | 0.000890753366232657 | 0.999554623316884 |
| 31 | 0.00536627952735794 | 0.0107325590547159 | 0.994633720472642 |
| 32 | 0.0165592171954506 | 0.0331184343909013 | 0.98344078280455 |
| 33 | 0.0478143150248297 | 0.0956286300496594 | 0.95218568497517 |
| 34 | 0.58533487017873 | 0.82933025964254 | 0.41466512982127 |
| 35 | 0.881357898178846 | 0.237284203642307 | 0.118642101821154 |
| 36 | 0.99172631068892 | 0.0165473786221595 | 0.00827368931107973 |
| 37 | 0.985608619053027 | 0.0287827618939453 | 0.0143913809469726 |
| 38 | 0.978797083966787 | 0.0424058320664252 | 0.0212029160332126 |
| 39 | 0.957377014407276 | 0.0852459711854474 | 0.0426229855927237 |
| 40 | 0.934717861146 | 0.130564277708 | 0.065282138854 |
| 41 | 0.886836378894011 | 0.226327242211977 | 0.113163621105989 |
| 42 | 0.958541665035612 | 0.0829166699287756 | 0.0414583349643878 |
| 43 | 0.952915523254095 | 0.0941689534918109 | 0.0470844767459054 |
| Meta Analysis of Goldfeld-Quandt test for Heteroskedasticity | |||
| Description | # significant tests | % significant tests | OK/NOK |
| 1% type I error level | 5 | 0.185185185185185 | NOK |
| 5% type I error level | 15 | 0.555555555555556 | NOK |
| 10% type I error level | 21 | 0.777777777777778 | NOK |