| Multiple Linear Regression - Estimated Regression Equation |
| Tprod[t] = + 104.057458254309 -0.954366625790823Rente[t] + e[t] |
| Multiple Linear Regression - Ordinary Least Squares | |||||
| Variable | Parameter | S.D. | T-STAT H0: parameter = 0 | 2-tail p-value | 1-tail p-value |
| (Intercept) | 104.057458254309 | 0.308823 | 336.9486 | 0 | 0 |
| Rente | -0.954366625790823 | 0.093353 | -10.2232 | 0 | 0 |
| Multiple Linear Regression - Regression Statistics | |
| Multiple R | 0.801939374471285 |
| R-squared | 0.643106760327396 |
| Adjusted R-squared | 0.636953428608903 |
| F-TEST (value) | 104.513585444225 |
| F-TEST (DF numerator) | 1 |
| F-TEST (DF denominator) | 58 |
| p-value | 1.35447209004269e-14 |
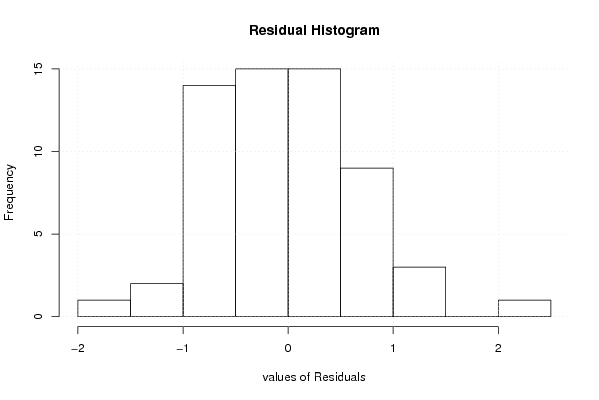
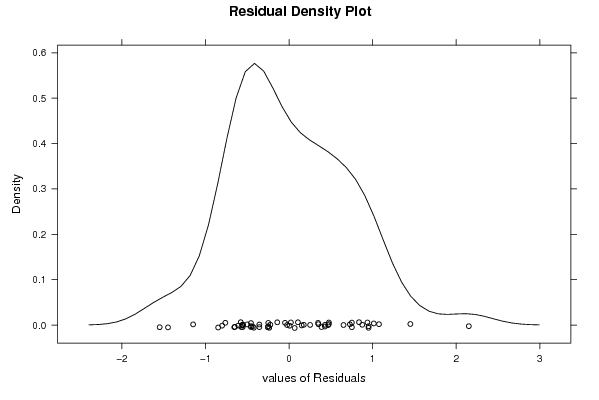
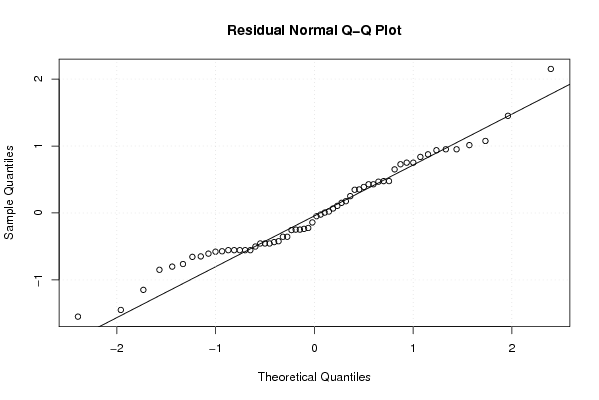
| Multiple Linear Regression - Residual Statistics | |
| Residual Standard Deviation | 0.715892288571204 |
| Sum Squared Residuals | 29.7251025924716 |
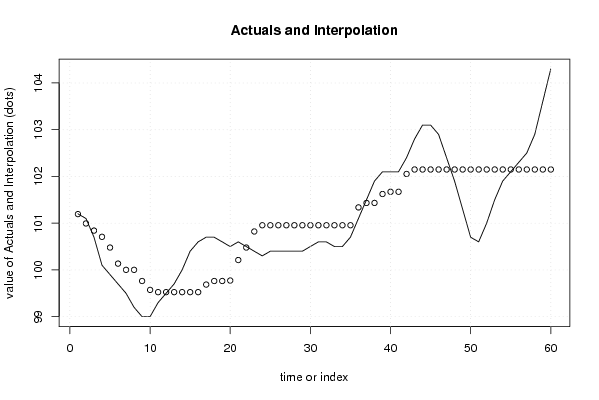
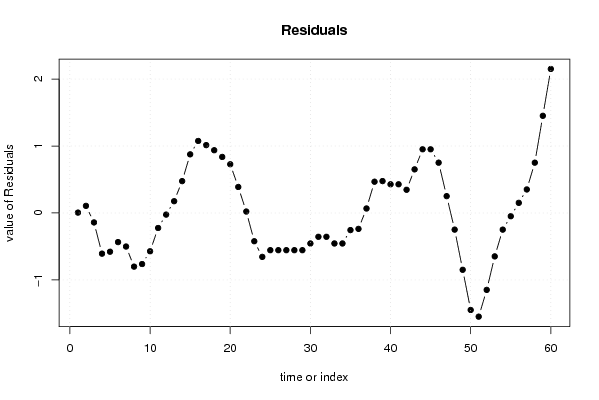
| Multiple Linear Regression - Actuals, Interpolation, and Residuals | |||
| Time or Index | Actuals | Interpolation Forecast | Residuals Prediction Error |
| 1 | 101.2 | 101.194358376937 | 0.00564162306336613 |
| 2 | 101.1 | 100.993941385520 | 0.106058614479800 |
| 3 | 100.7 | 100.841242725394 | -0.14124272539365 |
| 4 | 100.1 | 100.707631397783 | -0.607631397782944 |
| 5 | 99.9 | 100.478583407593 | -0.578583407593135 |
| 6 | 99.7 | 100.135011422308 | -0.435011422308442 |
| 7 | 99.5 | 100.001400094698 | -0.50140009469773 |
| 8 | 99.2 | 100.001400094698 | -0.801400094697727 |
| 9 | 99 | 99.76280843825 | -0.762808438250024 |
| 10 | 99 | 99.5719351130919 | -0.571935113091859 |
| 11 | 99.3 | 99.5242167818023 | -0.224216781802321 |
| 12 | 99.5 | 99.5242167818023 | -0.0242167818023186 |
| 13 | 99.7 | 99.5242167818023 | 0.175783218197684 |
| 14 | 100 | 99.5242167818023 | 0.475783218197681 |
| 15 | 100.4 | 99.5242167818023 | 0.875783218197687 |
| 16 | 100.6 | 99.5242167818023 | 1.07578321819768 |
| 17 | 100.7 | 99.6864591081868 | 1.01354089181324 |
| 18 | 100.7 | 99.76280843825 | 0.937191561749979 |
| 19 | 100.6 | 99.76280843825 | 0.83719156174997 |
| 20 | 100.5 | 99.772352104508 | 0.727647895492068 |
| 21 | 100.6 | 100.211360752372 | 0.388639247628284 |
| 22 | 100.5 | 100.478583407593 | 0.0214165924068594 |
| 23 | 100.4 | 100.822155392878 | -0.422155392877831 |
| 24 | 100.3 | 100.955766720489 | -0.655766720488555 |
| 25 | 100.4 | 100.955766720489 | -0.555766720488546 |
| 26 | 100.4 | 100.955766720489 | -0.555766720488546 |
| 27 | 100.4 | 100.955766720489 | -0.555766720488546 |
| 28 | 100.4 | 100.955766720489 | -0.555766720488546 |
| 29 | 100.4 | 100.955766720489 | -0.555766720488546 |
| 30 | 100.5 | 100.955766720489 | -0.455766720488552 |
| 31 | 100.6 | 100.955766720489 | -0.355766720488557 |
| 32 | 100.6 | 100.955766720489 | -0.355766720488557 |
| 33 | 100.5 | 100.955766720489 | -0.455766720488552 |
| 34 | 100.5 | 100.955766720489 | -0.455766720488552 |
| 35 | 100.7 | 100.955766720489 | -0.255766720488549 |
| 36 | 101.1 | 101.337513370805 | -0.237513370804886 |
| 37 | 101.5 | 101.432950033384 | 0.0670499666160373 |
| 38 | 101.9 | 101.432950033384 | 0.467049966616043 |
| 39 | 102.1 | 101.623823358542 | 0.476176641457867 |
| 40 | 102.1 | 101.671541689832 | 0.428458310168326 |
| 41 | 102.1 | 101.671541689832 | 0.428458310168326 |
| 42 | 102.4 | 102.053288340148 | 0.346711659852009 |
| 43 | 102.8 | 102.148725002727 | 0.651274997272918 |
| 44 | 103.1 | 102.148725002727 | 0.951274997272915 |
| 45 | 103.1 | 102.148725002727 | 0.951274997272915 |
| 46 | 102.9 | 102.148725002727 | 0.751274997272926 |
| 47 | 102.4 | 102.148725002727 | 0.251274997272926 |
| 48 | 101.9 | 102.148725002727 | -0.248725002727074 |
| 49 | 101.3 | 102.148725002727 | -0.848725002727082 |
| 50 | 100.7 | 102.148725002727 | -1.44872500272708 |
| 51 | 100.6 | 102.148725002727 | -1.54872500272709 |
| 52 | 101 | 102.148725002727 | -1.14872500272708 |
| 53 | 101.5 | 102.148725002727 | -0.648725002727079 |
| 54 | 101.9 | 102.148725002727 | -0.248725002727074 |
| 55 | 102.1 | 102.148725002727 | -0.048725002727085 |
| 56 | 102.3 | 102.148725002727 | 0.151274997272918 |
| 57 | 102.5 | 102.148725002727 | 0.351274997272921 |
| 58 | 102.9 | 102.148725002727 | 0.751274997272926 |
| 59 | 103.6 | 102.148725002727 | 1.45127499727291 |
| 60 | 104.3 | 102.148725002727 | 2.15127499727292 |
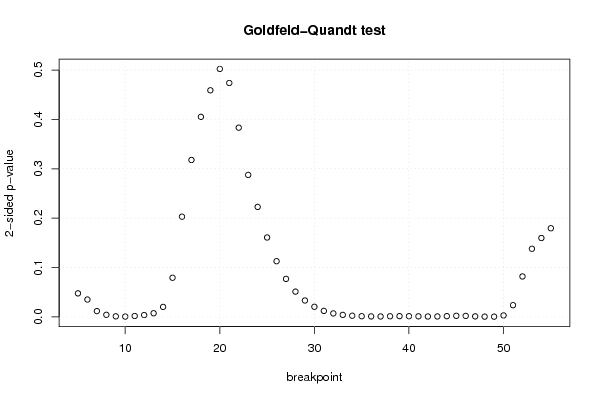
| Goldfeld-Quandt test for Heteroskedasticity | |||
| p-values | Alternative Hypothesis | ||
| breakpoint index | greater | 2-sided | less |
| 5 | 0.0238414848985247 | 0.0476829697970493 | 0.976158515101475 |
| 6 | 0.0175742657329251 | 0.0351485314658503 | 0.982425734267075 |
| 7 | 0.00588102145143733 | 0.0117620429028747 | 0.994118978548563 |
| 8 | 0.00212059348618305 | 0.0042411869723661 | 0.997879406513817 |
| 9 | 0.000587320787481028 | 0.00117464157496206 | 0.999412679212519 |
| 10 | 0.000355771251568655 | 0.00071154250313731 | 0.999644228748431 |
| 11 | 0.000916860634170218 | 0.00183372126834044 | 0.99908313936583 |
| 12 | 0.00188229342758154 | 0.00376458685516307 | 0.998117706572418 |
| 13 | 0.00370584581143945 | 0.0074116916228789 | 0.99629415418856 |
| 14 | 0.0101284476909174 | 0.0202568953818349 | 0.989871552309083 |
| 15 | 0.0396372483011431 | 0.0792744966022861 | 0.960362751698857 |
| 16 | 0.101478894352433 | 0.202957788704866 | 0.898521105647567 |
| 17 | 0.158906136109628 | 0.317812272219257 | 0.841093863890372 |
| 18 | 0.202557896956443 | 0.405115793912886 | 0.797442103043557 |
| 19 | 0.229450237180475 | 0.45890047436095 | 0.770549762819525 |
| 20 | 0.251077598223512 | 0.502155196447023 | 0.748922401776488 |
| 21 | 0.236879486477723 | 0.473758972955446 | 0.763120513522277 |
| 22 | 0.191609557800884 | 0.383219115601767 | 0.808390442199116 |
| 23 | 0.143768948443547 | 0.287537896887095 | 0.856231051556453 |
| 24 | 0.111371536587479 | 0.222743073174958 | 0.888628463412521 |
| 25 | 0.0804102619006545 | 0.160820523801309 | 0.919589738099346 |
| 26 | 0.0564017844102695 | 0.112803568820539 | 0.94359821558973 |
| 27 | 0.0384875308259434 | 0.0769750616518868 | 0.961512469174057 |
| 28 | 0.0255948325572355 | 0.0511896651144709 | 0.974405167442765 |
| 29 | 0.0166304111824254 | 0.0332608223648507 | 0.983369588817575 |
| 30 | 0.0102533731673888 | 0.0205067463347776 | 0.989746626832611 |
| 31 | 0.00610286334121223 | 0.0122057266824245 | 0.993897136658788 |
| 32 | 0.0035329438724069 | 0.0070658877448138 | 0.996467056127593 |
| 33 | 0.00204770988652225 | 0.0040954197730445 | 0.997952290113478 |
| 34 | 0.00120545321976379 | 0.00241090643952759 | 0.998794546780236 |
| 35 | 0.000709218934285636 | 0.00141843786857127 | 0.999290781065714 |
| 36 | 0.00049634629441276 | 0.00099269258882552 | 0.999503653705587 |
| 37 | 0.000449264742047960 | 0.000898529484095919 | 0.999550735257952 |
| 38 | 0.000635528068441109 | 0.00127105613688222 | 0.999364471931559 |
| 39 | 0.000780352109471887 | 0.00156070421894377 | 0.999219647890528 |
| 40 | 0.000730067843889776 | 0.00146013568777955 | 0.99926993215611 |
| 41 | 0.000598886702834567 | 0.00119777340566913 | 0.999401113297165 |
| 42 | 0.000426411742353679 | 0.000852823484707357 | 0.999573588257646 |
| 43 | 0.000450595353112242 | 0.000901190706224483 | 0.999549404646888 |
| 44 | 0.000759443295558633 | 0.00151888659111727 | 0.999240556704441 |
| 45 | 0.00109893598646372 | 0.00219787197292743 | 0.998901064013536 |
| 46 | 0.00102634543867735 | 0.00205269087735470 | 0.998973654561323 |
| 47 | 0.00053025011919278 | 0.00106050023838556 | 0.999469749880807 |
| 48 | 0.000260090374649883 | 0.000520180749299765 | 0.99973990962535 |
| 49 | 0.000274141591900503 | 0.000548283183801007 | 0.9997258584081 |
| 50 | 0.00147642595810291 | 0.00295285191620582 | 0.998523574041897 |
| 51 | 0.0118934802413496 | 0.0237869604826992 | 0.98810651975865 |
| 52 | 0.0409522125086278 | 0.0819044250172556 | 0.959047787491372 |
| 53 | 0.068976932881847 | 0.137953865763694 | 0.931023067118153 |
| 54 | 0.0798764811657025 | 0.159752962331405 | 0.920123518834298 |
| 55 | 0.0897685256990436 | 0.179537051398087 | 0.910231474300956 |
| Meta Analysis of Goldfeld-Quandt test for Heteroskedasticity | |||
| Description | # significant tests | % significant tests | OK/NOK |
| 1% type I error level | 25 | 0.490196078431373 | NOK |
| 5% type I error level | 33 | 0.647058823529412 | NOK |
| 10% type I error level | 37 | 0.725490196078431 | NOK |