| Multiple Linear Regression - Estimated Regression Equation |
| TWV[t] = + 2.53000723423698 + 0.250196720479237`WV-25`[t] + 1.10081835719362M1[t] + 0.720818357193624M2[t] + 0.820818357193624M3[t] + 1.34608983145497M4[t] + 1.32608983145497M5[t] + 1.12608983145497M6[t] + 1.03121966697127M7[t] + 0.751219666971267M8[t] + 0.771219666971266M9[t] + 0.0400000000000001M10[t] + 0.24M11[t] + e[t] |
| Multiple Linear Regression - Ordinary Least Squares | |||||
| Variable | Parameter | S.D. | T-STAT H0: parameter = 0 | 2-tail p-value | 1-tail p-value |
| (Intercept) | 2.53000723423698 | 1.041451 | 2.4293 | 0.019004 | 0.009502 |
| `WV-25` | 0.250196720479237 | 0.039163 | 6.3886 | 0 | 0 |
| M1 | 1.10081835719362 | 0.46893 | 2.3475 | 0.023162 | 0.011581 |
| M2 | 0.720818357193624 | 0.46893 | 1.5372 | 0.130961 | 0.06548 |
| M3 | 0.820818357193624 | 0.46893 | 1.7504 | 0.086574 | 0.043287 |
| M4 | 1.34608983145497 | 0.490332 | 2.7453 | 0.008539 | 0.004269 |
| M5 | 1.32608983145497 | 0.490332 | 2.7045 | 0.009497 | 0.004748 |
| M6 | 1.12608983145497 | 0.490332 | 2.2966 | 0.026145 | 0.013073 |
| M7 | 1.03121966697127 | 0.502304 | 2.053 | 0.045665 | 0.022832 |
| M8 | 0.751219666971267 | 0.502304 | 1.4955 | 0.141457 | 0.070728 |
| M9 | 0.771219666971266 | 0.502304 | 1.5354 | 0.1314 | 0.0657 |
| M10 | 0.0400000000000001 | 0.439719 | 0.091 | 0.927905 | 0.463953 |
| M11 | 0.24 | 0.439719 | 0.5458 | 0.587783 | 0.293891 |
| Multiple Linear Regression - Regression Statistics | |
| Multiple R | 0.729257593587251 |
| R-squared | 0.531816637804669 |
| Adjusted R-squared | 0.412280460222882 |
| F-TEST (value) | 4.44900153713548 |
| F-TEST (DF numerator) | 12 |
| F-TEST (DF denominator) | 47 |
| p-value | 9.98343333580287e-05 |
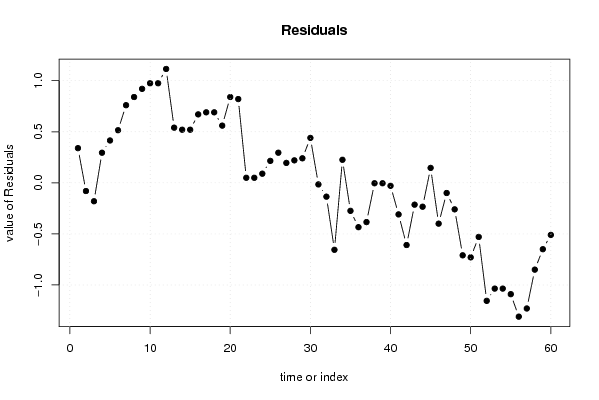
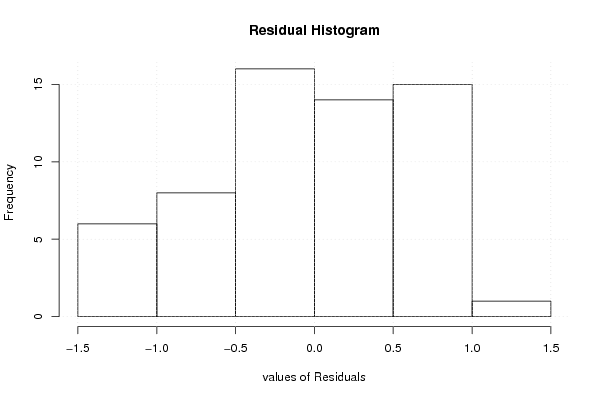
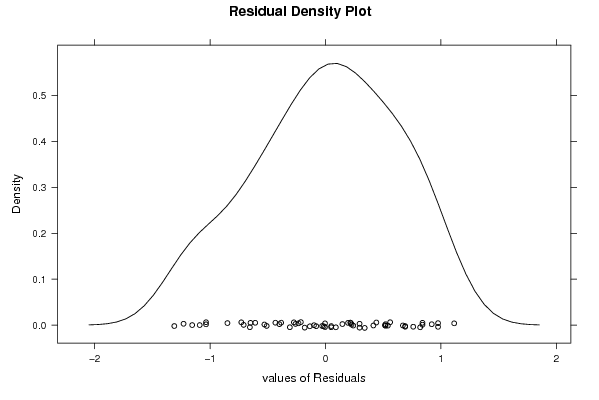
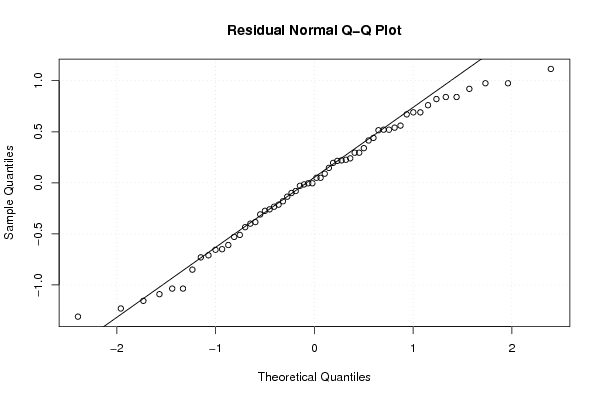
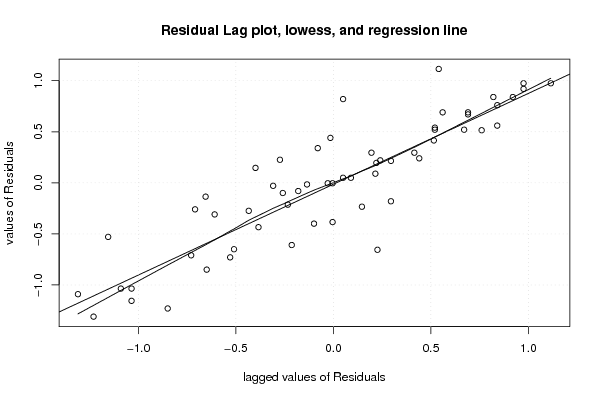
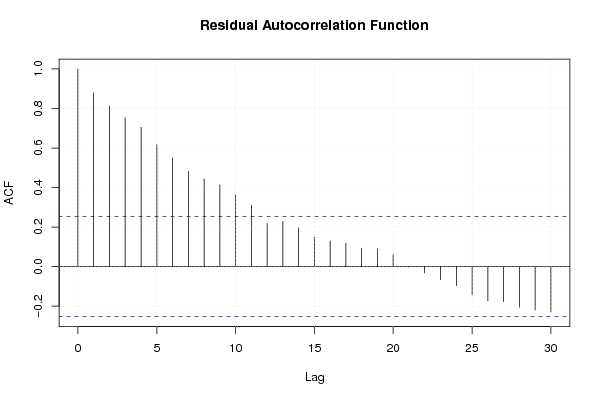
| Multiple Linear Regression - Residual Statistics | |
| Residual Standard Deviation | 0.695257304326818 |
| Sum Squared Residuals | 22.7189878033303 |
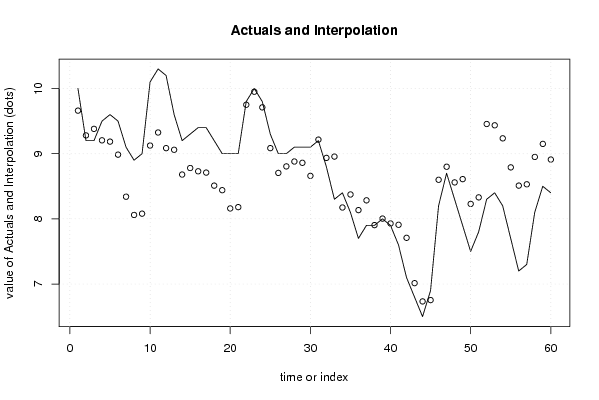
| Multiple Linear Regression - Actuals, Interpolation, and Residuals | |||
| Time or Index | Actuals | Interpolation Forecast | Residuals Prediction Error |
| 1 | 10 | 9.6605665549802 | 0.339433445019795 |
| 2 | 9.2 | 9.2805665549802 | -0.0805665549802007 |
| 3 | 9.2 | 9.3805665549802 | -0.180566554980201 |
| 4 | 9.5 | 9.20528721189968 | 0.294712788100315 |
| 5 | 9.6 | 9.18528721189968 | 0.414712788100316 |
| 6 | 9.5 | 8.98528721189968 | 0.514712788100314 |
| 7 | 9.1 | 8.33998426236166 | 0.760015737638337 |
| 8 | 8.9 | 8.05998426236166 | 0.840015737638338 |
| 9 | 9 | 8.07998426236166 | 0.920015737638338 |
| 10 | 10.1 | 9.12516131079297 | 0.974838689207026 |
| 11 | 10.3 | 9.32516131079297 | 0.974838689207027 |
| 12 | 10.2 | 9.08516131079297 | 1.11483868920703 |
| 13 | 9.6 | 9.06009442583003 | 0.539905574169967 |
| 14 | 9.2 | 8.68009442583003 | 0.519905574169966 |
| 15 | 9.3 | 8.78009442583003 | 0.519905574169967 |
| 16 | 9.4 | 8.72991344298914 | 0.670086557010864 |
| 17 | 9.4 | 8.70991344298914 | 0.690086557010864 |
| 18 | 9.2 | 8.50991344298914 | 0.690086557010864 |
| 19 | 9 | 8.44006295055335 | 0.559937049446645 |
| 20 | 9 | 8.16006295055336 | 0.839937049446644 |
| 21 | 9 | 8.18006295055335 | 0.819937049446645 |
| 22 | 9.8 | 9.75065311199107 | 0.0493468880089356 |
| 23 | 10 | 9.95065311199106 | 0.0493468880089351 |
| 24 | 9.8 | 9.71065311199106 | 0.089346888008936 |
| 25 | 9.3 | 9.08511409787796 | 0.214885902122044 |
| 26 | 9 | 8.70511409787796 | 0.294885902122043 |
| 27 | 9 | 8.80511409787796 | 0.194885902122043 |
| 28 | 9.1 | 8.88003147527668 | 0.219968524723321 |
| 29 | 9.1 | 8.86003147527668 | 0.239968524723322 |
| 30 | 9.1 | 8.66003147527668 | 0.439968524723322 |
| 31 | 9.2 | 9.21567278403899 | -0.0156727840389892 |
| 32 | 8.8 | 8.93567278403899 | -0.135672784038989 |
| 33 | 8.3 | 8.95567278403899 | -0.655672784038989 |
| 34 | 8.4 | 8.17441377297187 | 0.225586227028125 |
| 35 | 8.1 | 8.37441377297188 | -0.274413772971875 |
| 36 | 7.7 | 8.13441377297188 | -0.434413772971875 |
| 37 | 7.9 | 8.2844845923444 | -0.384484592344400 |
| 38 | 7.9 | 7.9044845923444 | -0.00448459234440062 |
| 39 | 8 | 8.0044845923444 | -0.00448459234440128 |
| 40 | 7.9 | 7.92928393745558 | -0.0292839374555795 |
| 41 | 7.6 | 7.90928393745558 | -0.30928393745558 |
| 42 | 7.1 | 7.70928393745558 | -0.609283937455579 |
| 43 | 6.8 | 7.01394164382171 | -0.213941643821708 |
| 44 | 6.5 | 6.73394164382171 | -0.233941643821708 |
| 45 | 6.9 | 6.75394164382171 | 0.146058356178292 |
| 46 | 8.2 | 8.59974819778658 | -0.399748197786578 |
| 47 | 8.7 | 8.79974819778658 | -0.0997481977865782 |
| 48 | 8.3 | 8.55974819778658 | -0.259748197786576 |
| 49 | 7.9 | 8.6097403289674 | -0.709740328967406 |
| 50 | 7.5 | 8.2297403289674 | -0.729740328967407 |
| 51 | 7.8 | 8.3297403289674 | -0.529740328967408 |
| 52 | 8.3 | 9.45548393237892 | -1.15548393237892 |
| 53 | 8.4 | 9.43548393237892 | -1.03548393237892 |
| 54 | 8.2 | 9.23548393237892 | -1.03548393237892 |
| 55 | 7.7 | 8.79033835922429 | -1.09033835922429 |
| 56 | 7.2 | 8.51033835922429 | -1.31033835922429 |
| 57 | 7.3 | 8.53033835922429 | -1.23033835922429 |
| 58 | 8.1 | 8.9500236064575 | -0.850023606457509 |
| 59 | 8.5 | 9.1500236064575 | -0.650023606457508 |
| 60 | 8.4 | 8.9100236064575 | -0.510023606457508 |
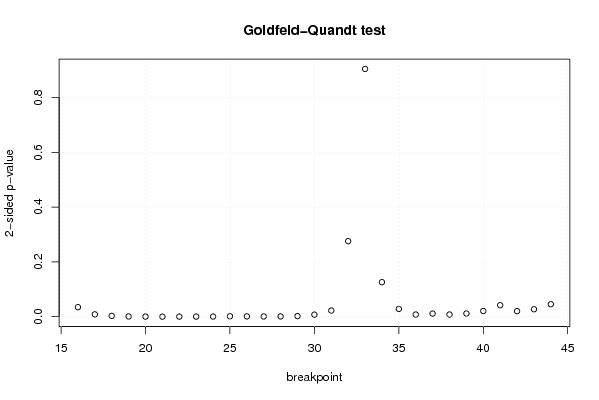
| Goldfeld-Quandt test for Heteroskedasticity | |||
| p-values | Alternative Hypothesis | ||
| breakpoint index | greater | 2-sided | less |
| 16 | 0.0173508021579016 | 0.0347016043158033 | 0.982649197842098 |
| 17 | 0.0042640607898098 | 0.0085281215796196 | 0.99573593921019 |
| 18 | 0.00149328090501298 | 0.00298656181002595 | 0.998506719094987 |
| 19 | 0.00042708878972079 | 0.00085417757944158 | 0.99957291121028 |
| 20 | 0.000141613478035156 | 0.000283226956070313 | 0.999858386521965 |
| 21 | 5.21703675492622e-05 | 0.000104340735098524 | 0.99994782963245 |
| 22 | 0.000147913742829223 | 0.000295827485658446 | 0.99985208625717 |
| 23 | 0.000148655999713856 | 0.000297311999427711 | 0.999851344000286 |
| 24 | 0.000194323995958999 | 0.000388647991917999 | 0.99980567600404 |
| 25 | 0.000750795786805677 | 0.00150159157361135 | 0.999249204213194 |
| 26 | 0.000520047153302895 | 0.00104009430660579 | 0.999479952846697 |
| 27 | 0.00036161537450658 | 0.00072323074901316 | 0.999638384625493 |
| 28 | 0.000494936536980767 | 0.000989873073961535 | 0.999505063463019 |
| 29 | 0.00103198085576886 | 0.00206396171153772 | 0.99896801914423 |
| 30 | 0.00372871101092813 | 0.00745742202185626 | 0.996271288989072 |
| 31 | 0.0112518788958429 | 0.0225037577916858 | 0.988748121104157 |
| 32 | 0.137872887350192 | 0.275745774700383 | 0.862127112649808 |
| 33 | 0.452274161329804 | 0.904548322659608 | 0.547725838670196 |
| 34 | 0.937038298740902 | 0.125923402518196 | 0.0629617012590978 |
| 35 | 0.985844290709973 | 0.0283114185800541 | 0.0141557092900271 |
| 36 | 0.9960855905881 | 0.00782881882379962 | 0.00391440941189981 |
| 37 | 0.994332777581581 | 0.0113344448368376 | 0.00566722241841879 |
| 38 | 0.996069448343571 | 0.00786110331285731 | 0.00393055165642866 |
| 39 | 0.994217190384286 | 0.0115656192314270 | 0.00578280961571351 |
| 40 | 0.989691177254486 | 0.0206176454910274 | 0.0103088227455137 |
| 41 | 0.97906205515759 | 0.0418758896848188 | 0.0209379448424094 |
| 42 | 0.9898316232196 | 0.0203367535608011 | 0.0101683767804006 |
| 43 | 0.986452468584297 | 0.027095062831405 | 0.0135475314157025 |
| 44 | 0.977251668920627 | 0.0454966621587467 | 0.0227483310793733 |
| Meta Analysis of Goldfeld-Quandt test for Heteroskedasticity | |||
| Description | # significant tests | % significant tests | OK/NOK |
| 1% type I error level | 16 | 0.551724137931034 | NOK |
| 5% type I error level | 26 | 0.896551724137931 | NOK |
| 10% type I error level | 26 | 0.896551724137931 | NOK |