| Multiple Linear Regression - Estimated Regression Equation |
| X[t] = + 5.84831039520222 + 0.448276619582171Y[t] + 0.0237866131382666M1[t] -0.117936154009505M2[t] -0.224486583115485M3[t] -0.12758893331283M4[t] -0.015518945468392M5[t] -0.0248281013158757M6[t] -0.122412998030213M7[t] -0.306204700394689M8[t] -0.449996402759166M9[t] -0.386891507948712M10[t] -0.0756910638313447M11[t] -0.0334495708940197t + e[t] |
| Multiple Linear Regression - Ordinary Least Squares | |||||
| Variable | Parameter | S.D. | T-STAT H0: parameter = 0 | 2-tail p-value | 1-tail p-value |
| (Intercept) | 5.84831039520222 | 0.774291 | 7.5531 | 0 | 0 |
| Y | 0.448276619582171 | 0.122045 | 3.673 | 0.000646 | 0.000323 |
| M1 | 0.0237866131382666 | 0.236036 | 0.1008 | 0.920187 | 0.460093 |
| M2 | -0.117936154009505 | 0.236405 | -0.4989 | 0.620353 | 0.310177 |
| M3 | -0.224486583115485 | 0.236168 | -0.9505 | 0.34703 | 0.173515 |
| M4 | -0.12758893331283 | 0.236315 | -0.5399 | 0.591981 | 0.29599 |
| M5 | -0.015518945468392 | 0.244118 | -0.0636 | 0.949599 | 0.4748 |
| M6 | -0.0248281013158757 | 0.249726 | -0.0994 | 0.921255 | 0.460628 |
| M7 | -0.122412998030213 | 0.249527 | -0.4906 | 0.626162 | 0.313081 |
| M8 | -0.306204700394689 | 0.244954 | -1.25 | 0.21789 | 0.108945 |
| M9 | -0.449996402759166 | 0.241298 | -1.8649 | 0.068873 | 0.034437 |
| M10 | -0.386891507948712 | 0.237591 | -1.6284 | 0.110582 | 0.055291 |
| M11 | -0.0756910638313447 | 0.248838 | -0.3042 | 0.762426 | 0.381213 |
| t | -0.0334495708940197 | 0.003317 | -10.0854 | 0 | 0 |
| Multiple Linear Regression - Regression Statistics | |
| Multiple R | 0.920223356592374 |
| R-squared | 0.846811026018135 |
| Adjusted R-squared | 0.801550647341675 |
| F-TEST (value) | 18.7097644955976 |
| F-TEST (DF numerator) | 13 |
| F-TEST (DF denominator) | 44 |
| p-value | 8.81517081552374e-14 |
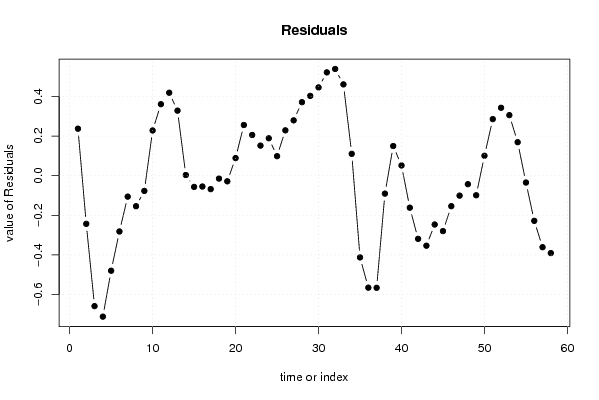
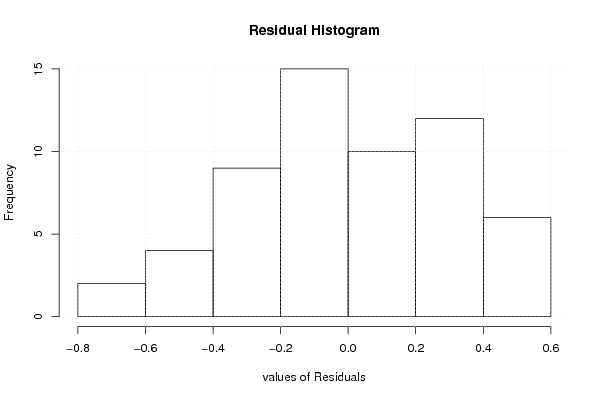
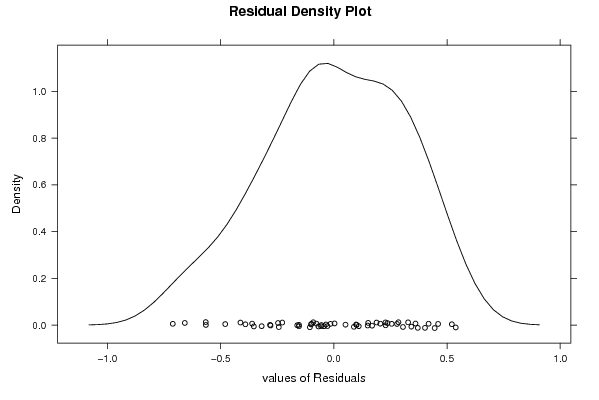
| Multiple Linear Regression - Residual Statistics | |
| Residual Standard Deviation | 0.351111530753584 |
| Sum Squared Residuals | 5.42428950923751 |
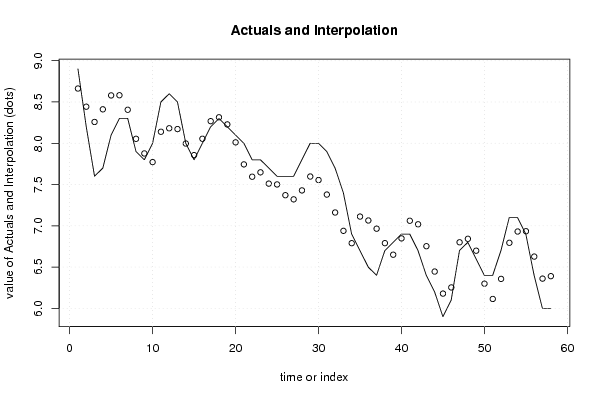
| Multiple Linear Regression - Actuals, Interpolation, and Residuals | |||
| Time or Index | Actuals | Interpolation Forecast | Residuals Prediction Error |
| 1 | 8.9 | 8.6627901408141 | 0.237209859185902 |
| 2 | 8.2 | 8.44279014081413 | -0.242790140814131 |
| 3 | 7.6 | 8.25796247885591 | -0.657962478855914 |
| 4 | 7.7 | 8.41106588168098 | -0.711065881680984 |
| 5 | 8.1 | 8.57934162254784 | -0.479341622547837 |
| 6 | 8.3 | 8.58141055776455 | -0.281410557764549 |
| 7 | 8.3 | 8.40554842819798 | -0.105548428197976 |
| 8 | 7.9 | 8.05382416906483 | -0.153824169064829 |
| 9 | 7.8 | 7.87658289580633 | -0.076582895806333 |
| 10 | 8 | 7.77175523384812 | 0.228244766151884 |
| 11 | 8.5 | 8.1391614309879 | 0.360838569012104 |
| 12 | 8.6 | 8.18140292392522 | 0.418597076074778 |
| 13 | 8.5 | 8.17173996616947 | 0.328260033830531 |
| 14 | 8 | 7.99656762812768 | 0.00343237187232173 |
| 15 | 7.8 | 7.85656762812768 | -0.056567628127678 |
| 16 | 8 | 8.05449869291096 | -0.054498692910965 |
| 17 | 8.2 | 8.26760209573603 | -0.0676020957360353 |
| 18 | 8.3 | 8.31449869291097 | -0.0144986929109648 |
| 19 | 8.2 | 8.22829188726083 | -0.0282918872608263 |
| 20 | 8.1 | 8.01105061400233 | 0.0889493859976702 |
| 21 | 8 | 7.7441540168274 | 0.255845983172601 |
| 22 | 7.8 | 7.59449869291096 | 0.205501307089035 |
| 23 | 7.8 | 7.64811125634323 | 0.151888743656773 |
| 24 | 7.7 | 7.51104210144768 | 0.188957898552316 |
| 25 | 7.6 | 7.50137914369193 | 0.0986208563080689 |
| 26 | 7.6 | 7.37103446760836 | 0.228965532391643 |
| 27 | 7.6 | 7.3206897915248 | 0.279310208475209 |
| 28 | 7.8 | 7.42896553239164 | 0.371034467608356 |
| 29 | 8 | 7.5972412732585 | 0.402758726741504 |
| 30 | 8 | 7.55448254651699 | 0.445517453483008 |
| 31 | 7.9 | 7.37862041695042 | 0.521379583049582 |
| 32 | 7.7 | 7.16137914369192 | 0.538620856308078 |
| 33 | 7.4 | 6.93931020847521 | 0.460689791524791 |
| 34 | 6.9 | 6.78965488455878 | 0.110345115441225 |
| 35 | 6.7 | 7.11223341974034 | -0.412233419740339 |
| 36 | 6.5 | 7.06481958876123 | -0.564819588761231 |
| 37 | 6.4 | 6.96550130708904 | -0.565501307089043 |
| 38 | 6.7 | 6.79032896904725 | -0.090328969047252 |
| 39 | 6.8 | 6.65032896904725 | 0.149671030952747 |
| 40 | 6.9 | 6.84826003383054 | 0.0517399661694614 |
| 41 | 6.9 | 7.06136343665561 | -0.161363436655608 |
| 42 | 6.7 | 7.0186047099141 | -0.318604709914105 |
| 43 | 6.4 | 6.7530872564311 | -0.353087256431097 |
| 44 | 6.2 | 6.44619065925617 | -0.246190659256167 |
| 45 | 5.9 | 6.17929406208124 | -0.279294062081236 |
| 46 | 6.1 | 6.25377704795589 | -0.153777047955888 |
| 47 | 6.7 | 6.80049389292854 | -0.100493892928537 |
| 48 | 6.8 | 6.84273538586586 | -0.042735385865863 |
| 49 | 6.6 | 6.69858944223546 | -0.098589442235459 |
| 50 | 6.4 | 6.29927879440258 | 0.100721205597419 |
| 51 | 6.4 | 6.11445113244436 | 0.285548867555635 |
| 52 | 6.7 | 6.35720985918587 | 0.342790140814131 |
| 53 | 7.1 | 6.79445157180202 | 0.305548428197976 |
| 54 | 7.1 | 6.93100349289339 | 0.168996507106611 |
| 55 | 6.9 | 6.93445201115968 | -0.034452011159683 |
| 56 | 6.4 | 6.62755541398475 | -0.227555413984753 |
| 57 | 6 | 6.36065881680982 | -0.360658816809822 |
| 58 | 6 | 6.39031414072626 | -0.390314140726257 |
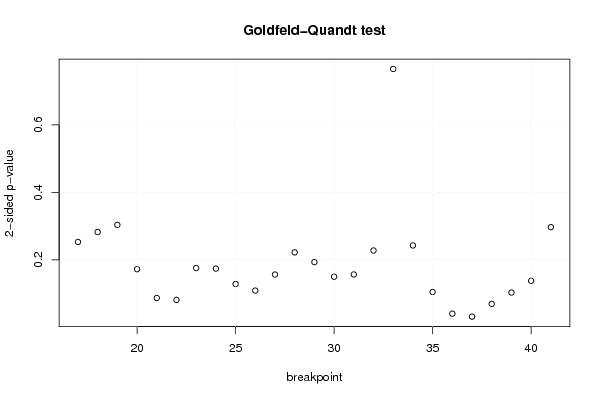
| Goldfeld-Quandt test for Heteroskedasticity | |||
| p-values | Alternative Hypothesis | ||
| breakpoint index | greater | 2-sided | less |
| 17 | 0.126431160513478 | 0.252862321026957 | 0.873568839486522 |
| 18 | 0.141174429739971 | 0.282348859479943 | 0.858825570260029 |
| 19 | 0.151807444768731 | 0.303614889537463 | 0.848192555231269 |
| 20 | 0.0861039136991613 | 0.172207827398323 | 0.913896086300839 |
| 21 | 0.0433814834496858 | 0.0867629668993715 | 0.956618516550314 |
| 22 | 0.0405923924815952 | 0.0811847849631903 | 0.959407607518405 |
| 23 | 0.0877823662841692 | 0.175564732568338 | 0.912217633715831 |
| 24 | 0.0869880230815024 | 0.173976046163005 | 0.913011976918498 |
| 25 | 0.0641046757107843 | 0.128209351421569 | 0.935895324289216 |
| 26 | 0.0544185819617961 | 0.108837163923592 | 0.945581418038204 |
| 27 | 0.0781687422722486 | 0.156337484544497 | 0.921831257727751 |
| 28 | 0.111009741086210 | 0.222019482172421 | 0.88899025891379 |
| 29 | 0.0965843349273213 | 0.193168669854643 | 0.903415665072679 |
| 30 | 0.0749500339699477 | 0.149900067939895 | 0.925049966030052 |
| 31 | 0.0782850978189508 | 0.156570195637902 | 0.921714902181049 |
| 32 | 0.113823580532326 | 0.227647161064651 | 0.886176419467674 |
| 33 | 0.383007225410385 | 0.76601445082077 | 0.616992774589615 |
| 34 | 0.878692520762069 | 0.242614958475862 | 0.121307479237931 |
| 35 | 0.94766769029534 | 0.104664619409319 | 0.0523323097046596 |
| 36 | 0.9798066356593 | 0.0403867286813983 | 0.0201933643406991 |
| 37 | 0.984268200137132 | 0.0314635997257352 | 0.0157317998628676 |
| 38 | 0.965304621074648 | 0.0693907578507036 | 0.0346953789253518 |
| 39 | 0.948507027799715 | 0.102985944400569 | 0.0514929722002845 |
| 40 | 0.931103765123004 | 0.137792469753992 | 0.0688962348769959 |
| 41 | 0.851584758937722 | 0.296830482124555 | 0.148415241062278 |
| Meta Analysis of Goldfeld-Quandt test for Heteroskedasticity | |||
| Description | # significant tests | % significant tests | OK/NOK |
| 1% type I error level | 0 | 0 | OK |
| 5% type I error level | 2 | 0.08 | NOK |
| 10% type I error level | 5 | 0.2 | NOK |