Free Statistics

of Irreproducible Research!

Author's title

Author*The author of this computation has been verified*
R Software Modulerwasp_multipleregression.wasp
Title produced by softwareMultiple Regression
Date of computationThu, 19 Nov 2009 13:05:09 -0700
Cite this page as followsStatistical Computations at FreeStatistics.org, Office for Research Development and Education, URL https://freestatistics.org/blog/index.php?v=date/2009/Nov/19/t125866122187ga0zsyst1232l.htm/, Retrieved Tue, 23 Apr 2024 15:21:16 +0000
Statistical Computations at FreeStatistics.org, Office for Research Development and Education, URL https://freestatistics.org/blog/index.php?pk=57927, Retrieved Tue, 23 Apr 2024 15:21:16 +0000
QR Codes:

Original text written by user:
IsPrivate?No (this computation is public)
User-defined keywords
Estimated Impact131
Family? (F = Feedback message, R = changed R code, M = changed R Module, P = changed Parameters, D = changed Data)
-     [Multiple Regression] [Q1 The Seatbeltlaw] [2007-11-14 19:27:43] [8cd6641b921d30ebe00b648d1481bba0]
- RM D  [Multiple Regression] [Seatbelt] [2009-11-12 14:10:54] [b98453cac15ba1066b407e146608df68]
-   PD    [Multiple Regression] [] [2009-11-19 19:58:46] [5edbdb7a459c4059b6c3b063ba86821c]
-    D        [Multiple Regression] [] [2009-11-19 20:05:09] [24029b2c7217429de6ff94b5379eb52c] [Current]
Feedback Forum

Post a new message
Dataseries X:
100.4	120.2	17	74	79.9	72.9	72.9
103	122.1	16	76	74	79.9	72.9
99	119.3	20	69.6	76	74	79.9
104.8	121.7	24	77.3	69.6	76	74
104.5	113.5	23	75.2	77.3	69.6	76
104.8	123.7	20	75.8	75.2	77.3	69.6
103.8	123.4	21	77.6	75.8	75.2	77.3
106.3	126.4	19	76.7	77.6	75.8	75.2
105.2	124.1	23	77	76.7	77.6	75.8
108.2	125.6	23	77.9	77	76.7	77.6
106.2	124.8	23	76.7	77.9	77	76.7
103.9	123	23	71.9	76.7	77.9	77
104.9	126.9	27	73.4	71.9	76.7	77.9
106.2	127.3	26	72.5	73.4	71.9	76.7
107.9	129	17	73.7	72.5	73.4	71.9
106.9	126.2	24	69.5	73.7	72.5	73.4
110.3	125.4	26	74.7	69.5	73.7	72.5
109.8	126.3	24	72.5	74.7	69.5	73.7
108.3	126.3	27	72.1	72.5	74.7	69.5
110.9	128.4	27	70.7	72.1	72.5	74.7
109.8	127.2	26	71.4	70.7	72.1	72.5
109.3	128.5	24	69.5	71.4	70.7	72.1
109	129	23	73.5	69.5	71.4	70.7
107.9	128.9	23	72.4	73.5	69.5	71.4
108.4	128.3	24	74.5	72.4	73.5	69.5
107.2	124.6	17	72.2	74.5	72.4	73.5
109.5	126.2	21	73	72.2	74.5	72.4
109.9	129.1	19	73.3	73	72.2	74.5
108	127.3	22	71.3	73.3	73	72.2
114.7	129.2	22	73.6	71.3	73.3	73
115.6	130.4	18	71.3	73.6	71.3	73.3
107.6	125.9	16	71.2	71.3	73.6	71.3
115.9	135.8	14	81.4	71.2	71.3	73.6
111.8	126.4	12	76.1	81.4	71.2	71.3
110	129.5	14	71.1	76.1	81.4	71.2
109.2	128.4	16	75.7	71.1	76.1	81.4
108	125.6	8	70	75.7	71.1	76.1
105.6	127.7	3	68.5	70	75.7	71.1
103	126.4	0	56.7	68.5	70	75.7
99.6	124.2	5	57.9	56.7	68.5	70
97.9	126.4	1	58.8	57.9	56.7	68.5
97.6	123.7	1	59.3	58.8	57.9	56.7
96.2	121.8	3	61.3	59.3	58.8	57.9
97.9	124	6	62.9	61.3	59.3	58.8
94.5	122.7	7	61.4	62.9	61.3	59.3
95.4	122.9	8	64.5	61.4	62.9	61.3
94.4	121	14	63.8	64.5	61.4	62.9
96.3	122.8	14	61.6	63.8	64.5	61.4
95.1	122.9	13	64.7	61.6	63.8	64.5


Summary of computational transaction
Raw Inputview raw input (R code)
Raw Outputview raw output of R engine
Computing time5 seconds
R Server'Gwilym Jenkins' @ 72.249.127.135
R Framework error message
The field 'Names of X columns' contains a hard return which cannot be interpreted.
Please, resubmit your request without hard returns in the 'Names of X columns'.

\begin{tabular}{lllllllll}
\hline
Summary of computational transaction \tabularnewline
Raw Input & view raw input (R code)  \tabularnewline
Raw Output & view raw output of R engine  \tabularnewline
Computing time & 5 seconds \tabularnewline
R Server & 'Gwilym Jenkins' @ 72.249.127.135 \tabularnewline
R Framework error message & 
The field 'Names of X columns' contains a hard return which cannot be interpreted.
Please, resubmit your request without hard returns in the 'Names of X columns'.
\tabularnewline \hline \end{tabular} %Source: https://freestatistics.org/blog/index.php?pk=57927&T=0

[TABLE]
[ROW][C]Summary of computational transaction[/C][/ROW]
[ROW][C]Raw Input[/C][C]view raw input (R code) [/C][/ROW]
[ROW][C]Raw Output[/C][C]view raw output of R engine [/C][/ROW]
[ROW][C]Computing time[/C][C]5 seconds[/C][/ROW]
[ROW][C]R Server[/C][C]'Gwilym Jenkins' @ 72.249.127.135[/C][/ROW]
[ROW][C]R Framework error message[/C][C]
The field 'Names of X columns' contains a hard return which cannot be interpreted.
Please, resubmit your request without hard returns in the 'Names of X columns'.
[/C][/ROW] [/TABLE] Source: https://freestatistics.org/blog/index.php?pk=57927&T=0

Globally Unique Identifier (entire table): ba.freestatistics.org/blog/index.php?pk=57927&T=0

As an alternative you can also use a QR Code:  

The GUIDs for individual cells are displayed in the table below:

Summary of computational transaction
Raw Inputview raw input (R code)
Raw Outputview raw output of R engine
Computing time5 seconds
R Server'Gwilym Jenkins' @ 72.249.127.135
R Framework error message
The field 'Names of X columns' contains a hard return which cannot be interpreted.
Please, resubmit your request without hard returns in the 'Names of X columns'.


Multiple Linear Regression - Estimated Regression Equation
Y[t] = + 20.2513189201664 + 0.425341901487542totid[t] -0.0455449630743466ndzcg[t] + 0.0436802973309247indc[t] + 0.188344373020551y1[t] + 0.163567515100477y2[t] -0.130967620439291`y3 `[t] + 0.296514116202145M1[t] -0.835837579481557M2[t] -3.76745489042413M3[t] -2.08061356471506M4[t] -1.12030986429559M5[t] -1.97031879592753M6[t] -1.21767349589456M7[t] -1.11620771659602M8[t] + 1.25633708049614M9[t] + 0.269097496660407M10[t] -0.08551092511179M11[t] -0.166442807258652t + e[t]

\begin{tabular}{lllllllll}
\hline
Multiple Linear Regression - Estimated Regression Equation \tabularnewline
Y[t] =  +  20.2513189201664 +  0.425341901487542totid[t] -0.0455449630743466ndzcg[t] +  0.0436802973309247indc[t] +  0.188344373020551y1[t] +  0.163567515100477y2[t] -0.130967620439291`y3
`[t] +  0.296514116202145M1[t] -0.835837579481557M2[t] -3.76745489042413M3[t] -2.08061356471506M4[t] -1.12030986429559M5[t] -1.97031879592753M6[t] -1.21767349589456M7[t] -1.11620771659602M8[t] +  1.25633708049614M9[t] +  0.269097496660407M10[t] -0.08551092511179M11[t] -0.166442807258652t  + e[t] \tabularnewline
\hline
\end{tabular}
%Source: https://freestatistics.org/blog/index.php?pk=57927&T=1

[TABLE]
[ROW][C]Multiple Linear Regression - Estimated Regression Equation[/C][/ROW]
[ROW][C]Y[t] =  +  20.2513189201664 +  0.425341901487542totid[t] -0.0455449630743466ndzcg[t] +  0.0436802973309247indc[t] +  0.188344373020551y1[t] +  0.163567515100477y2[t] -0.130967620439291`y3
`[t] +  0.296514116202145M1[t] -0.835837579481557M2[t] -3.76745489042413M3[t] -2.08061356471506M4[t] -1.12030986429559M5[t] -1.97031879592753M6[t] -1.21767349589456M7[t] -1.11620771659602M8[t] +  1.25633708049614M9[t] +  0.269097496660407M10[t] -0.08551092511179M11[t] -0.166442807258652t  + e[t][/C][/ROW]
[/TABLE]
Source: https://freestatistics.org/blog/index.php?pk=57927&T=1

Globally Unique Identifier (entire table): ba.freestatistics.org/blog/index.php?pk=57927&T=1

As an alternative you can also use a QR Code:  

The GUIDs for individual cells are displayed in the table below:

Multiple Linear Regression - Estimated Regression Equation
Y[t] = + 20.2513189201664 + 0.425341901487542totid[t] -0.0455449630743466ndzcg[t] + 0.0436802973309247indc[t] + 0.188344373020551y1[t] + 0.163567515100477y2[t] -0.130967620439291`y3 `[t] + 0.296514116202145M1[t] -0.835837579481557M2[t] -3.76745489042413M3[t] -2.08061356471506M4[t] -1.12030986429559M5[t] -1.97031879592753M6[t] -1.21767349589456M7[t] -1.11620771659602M8[t] + 1.25633708049614M9[t] + 0.269097496660407M10[t] -0.08551092511179M11[t] -0.166442807258652t + e[t]


Multiple Linear Regression - Ordinary Least Squares
VariableParameterS.D.T-STATH0: parameter = 02-tail p-value1-tail p-value
(Intercept)20.251318920166423.2680820.87030.3910220.195511
totid0.4253419014875420.2444991.73960.0921730.046086
ndzcg-0.04554496307434660.268582-0.16960.8664820.433241
indc0.04368029733092470.1045830.41770.679170.339585
y10.1883443730205510.1895510.99360.3283480.164174
y20.1635675151004770.168830.96880.3403780.170189
`y3 `-0.1309676204392910.163436-0.80130.4292370.214619
M10.2965141162021452.1271640.13940.890070.445035
M2-0.8358375794815572.415932-0.3460.7317810.36589
M3-3.767454890424132.405121-1.56640.1277370.063868
M4-2.080613564715062.526785-0.82340.4167650.208383
M5-1.120309864295592.680751-0.41790.678990.339495
M6-1.970318795927532.718052-0.72490.4741290.237065
M7-1.217673495894562.517465-0.48370.6321180.316059
M8-1.116207716596022.409731-0.46320.6465580.323279
M91.256337080496142.3856670.52660.6023310.301165
M100.2690974966604072.3629870.11390.9100910.455046
M11-0.085510925111792.259958-0.03780.9700680.485034
t-0.1664428072586520.077479-2.14820.0398920.019946

\begin{tabular}{lllllllll}
\hline
Multiple Linear Regression - Ordinary Least Squares \tabularnewline
Variable & Parameter & S.D. & T-STATH0: parameter = 0 & 2-tail p-value & 1-tail p-value \tabularnewline
(Intercept) & 20.2513189201664 & 23.268082 & 0.8703 & 0.391022 & 0.195511 \tabularnewline
totid & 0.425341901487542 & 0.244499 & 1.7396 & 0.092173 & 0.046086 \tabularnewline
ndzcg & -0.0455449630743466 & 0.268582 & -0.1696 & 0.866482 & 0.433241 \tabularnewline
indc & 0.0436802973309247 & 0.104583 & 0.4177 & 0.67917 & 0.339585 \tabularnewline
y1 & 0.188344373020551 & 0.189551 & 0.9936 & 0.328348 & 0.164174 \tabularnewline
y2 & 0.163567515100477 & 0.16883 & 0.9688 & 0.340378 & 0.170189 \tabularnewline
`y3
` & -0.130967620439291 & 0.163436 & -0.8013 & 0.429237 & 0.214619 \tabularnewline
M1 & 0.296514116202145 & 2.127164 & 0.1394 & 0.89007 & 0.445035 \tabularnewline
M2 & -0.835837579481557 & 2.415932 & -0.346 & 0.731781 & 0.36589 \tabularnewline
M3 & -3.76745489042413 & 2.405121 & -1.5664 & 0.127737 & 0.063868 \tabularnewline
M4 & -2.08061356471506 & 2.526785 & -0.8234 & 0.416765 & 0.208383 \tabularnewline
M5 & -1.12030986429559 & 2.680751 & -0.4179 & 0.67899 & 0.339495 \tabularnewline
M6 & -1.97031879592753 & 2.718052 & -0.7249 & 0.474129 & 0.237065 \tabularnewline
M7 & -1.21767349589456 & 2.517465 & -0.4837 & 0.632118 & 0.316059 \tabularnewline
M8 & -1.11620771659602 & 2.409731 & -0.4632 & 0.646558 & 0.323279 \tabularnewline
M9 & 1.25633708049614 & 2.385667 & 0.5266 & 0.602331 & 0.301165 \tabularnewline
M10 & 0.269097496660407 & 2.362987 & 0.1139 & 0.910091 & 0.455046 \tabularnewline
M11 & -0.08551092511179 & 2.259958 & -0.0378 & 0.970068 & 0.485034 \tabularnewline
t & -0.166442807258652 & 0.077479 & -2.1482 & 0.039892 & 0.019946 \tabularnewline
\hline
\end{tabular}
%Source: https://freestatistics.org/blog/index.php?pk=57927&T=2

[TABLE]
[ROW][C]Multiple Linear Regression - Ordinary Least Squares[/C][/ROW]
[ROW][C]Variable[/C][C]Parameter[/C][C]S.D.[/C][C]T-STATH0: parameter = 0[/C][C]2-tail p-value[/C][C]1-tail p-value[/C][/ROW]
[ROW][C](Intercept)[/C][C]20.2513189201664[/C][C]23.268082[/C][C]0.8703[/C][C]0.391022[/C][C]0.195511[/C][/ROW]
[ROW][C]totid[/C][C]0.425341901487542[/C][C]0.244499[/C][C]1.7396[/C][C]0.092173[/C][C]0.046086[/C][/ROW]
[ROW][C]ndzcg[/C][C]-0.0455449630743466[/C][C]0.268582[/C][C]-0.1696[/C][C]0.866482[/C][C]0.433241[/C][/ROW]
[ROW][C]indc[/C][C]0.0436802973309247[/C][C]0.104583[/C][C]0.4177[/C][C]0.67917[/C][C]0.339585[/C][/ROW]
[ROW][C]y1[/C][C]0.188344373020551[/C][C]0.189551[/C][C]0.9936[/C][C]0.328348[/C][C]0.164174[/C][/ROW]
[ROW][C]y2[/C][C]0.163567515100477[/C][C]0.16883[/C][C]0.9688[/C][C]0.340378[/C][C]0.170189[/C][/ROW]
[ROW][C]`y3
`[/C][C]-0.130967620439291[/C][C]0.163436[/C][C]-0.8013[/C][C]0.429237[/C][C]0.214619[/C][/ROW]
[ROW][C]M1[/C][C]0.296514116202145[/C][C]2.127164[/C][C]0.1394[/C][C]0.89007[/C][C]0.445035[/C][/ROW]
[ROW][C]M2[/C][C]-0.835837579481557[/C][C]2.415932[/C][C]-0.346[/C][C]0.731781[/C][C]0.36589[/C][/ROW]
[ROW][C]M3[/C][C]-3.76745489042413[/C][C]2.405121[/C][C]-1.5664[/C][C]0.127737[/C][C]0.063868[/C][/ROW]
[ROW][C]M4[/C][C]-2.08061356471506[/C][C]2.526785[/C][C]-0.8234[/C][C]0.416765[/C][C]0.208383[/C][/ROW]
[ROW][C]M5[/C][C]-1.12030986429559[/C][C]2.680751[/C][C]-0.4179[/C][C]0.67899[/C][C]0.339495[/C][/ROW]
[ROW][C]M6[/C][C]-1.97031879592753[/C][C]2.718052[/C][C]-0.7249[/C][C]0.474129[/C][C]0.237065[/C][/ROW]
[ROW][C]M7[/C][C]-1.21767349589456[/C][C]2.517465[/C][C]-0.4837[/C][C]0.632118[/C][C]0.316059[/C][/ROW]
[ROW][C]M8[/C][C]-1.11620771659602[/C][C]2.409731[/C][C]-0.4632[/C][C]0.646558[/C][C]0.323279[/C][/ROW]
[ROW][C]M9[/C][C]1.25633708049614[/C][C]2.385667[/C][C]0.5266[/C][C]0.602331[/C][C]0.301165[/C][/ROW]
[ROW][C]M10[/C][C]0.269097496660407[/C][C]2.362987[/C][C]0.1139[/C][C]0.910091[/C][C]0.455046[/C][/ROW]
[ROW][C]M11[/C][C]-0.08551092511179[/C][C]2.259958[/C][C]-0.0378[/C][C]0.970068[/C][C]0.485034[/C][/ROW]
[ROW][C]t[/C][C]-0.166442807258652[/C][C]0.077479[/C][C]-2.1482[/C][C]0.039892[/C][C]0.019946[/C][/ROW]
[/TABLE]
Source: https://freestatistics.org/blog/index.php?pk=57927&T=2

Globally Unique Identifier (entire table): ba.freestatistics.org/blog/index.php?pk=57927&T=2

As an alternative you can also use a QR Code:  

The GUIDs for individual cells are displayed in the table below:

Multiple Linear Regression - Ordinary Least Squares
VariableParameterS.D.T-STATH0: parameter = 02-tail p-value1-tail p-value
(Intercept)20.251318920166423.2680820.87030.3910220.195511
totid0.4253419014875420.2444991.73960.0921730.046086
ndzcg-0.04554496307434660.268582-0.16960.8664820.433241
indc0.04368029733092470.1045830.41770.679170.339585
y10.1883443730205510.1895510.99360.3283480.164174
y20.1635675151004770.168830.96880.3403780.170189
`y3 `-0.1309676204392910.163436-0.80130.4292370.214619
M10.2965141162021452.1271640.13940.890070.445035
M2-0.8358375794815572.415932-0.3460.7317810.36589
M3-3.767454890424132.405121-1.56640.1277370.063868
M4-2.080613564715062.526785-0.82340.4167650.208383
M5-1.120309864295592.680751-0.41790.678990.339495
M6-1.970318795927532.718052-0.72490.4741290.237065
M7-1.217673495894562.517465-0.48370.6321180.316059
M8-1.116207716596022.409731-0.46320.6465580.323279
M91.256337080496142.3856670.52660.6023310.301165
M100.2690974966604072.3629870.11390.9100910.455046
M11-0.085510925111792.259958-0.03780.9700680.485034
t-0.1664428072586520.077479-2.14820.0398920.019946


Multiple Linear Regression - Regression Statistics
Multiple R0.90975669067051
R-squared0.827657236219756
Adjusted R-squared0.72425157795161
F-TEST (value)8.00398401868412
F-TEST (DF numerator)18
F-TEST (DF denominator)30
p-value4.22611395878292e-07
Multiple Linear Regression - Residual Statistics
Residual Standard Deviation3.10793514765004
Sum Squared Residuals289.777826459955

\begin{tabular}{lllllllll}
\hline
Multiple Linear Regression - Regression Statistics \tabularnewline
Multiple R & 0.90975669067051 \tabularnewline
R-squared & 0.827657236219756 \tabularnewline
Adjusted R-squared & 0.72425157795161 \tabularnewline
F-TEST (value) & 8.00398401868412 \tabularnewline
F-TEST (DF numerator) & 18 \tabularnewline
F-TEST (DF denominator) & 30 \tabularnewline
p-value & 4.22611395878292e-07 \tabularnewline
Multiple Linear Regression - Residual Statistics \tabularnewline
Residual Standard Deviation & 3.10793514765004 \tabularnewline
Sum Squared Residuals & 289.777826459955 \tabularnewline
\hline
\end{tabular}
%Source: https://freestatistics.org/blog/index.php?pk=57927&T=3

[TABLE]
[ROW][C]Multiple Linear Regression - Regression Statistics[/C][/ROW]
[ROW][C]Multiple R[/C][C]0.90975669067051[/C][/ROW]
[ROW][C]R-squared[/C][C]0.827657236219756[/C][/ROW]
[ROW][C]Adjusted R-squared[/C][C]0.72425157795161[/C][/ROW]
[ROW][C]F-TEST (value)[/C][C]8.00398401868412[/C][/ROW]
[ROW][C]F-TEST (DF numerator)[/C][C]18[/C][/ROW]
[ROW][C]F-TEST (DF denominator)[/C][C]30[/C][/ROW]
[ROW][C]p-value[/C][C]4.22611395878292e-07[/C][/ROW]
[ROW][C]Multiple Linear Regression - Residual Statistics[/C][/ROW]
[ROW][C]Residual Standard Deviation[/C][C]3.10793514765004[/C][/ROW]
[ROW][C]Sum Squared Residuals[/C][C]289.777826459955[/C][/ROW]
[/TABLE]
Source: https://freestatistics.org/blog/index.php?pk=57927&T=3

Globally Unique Identifier (entire table): ba.freestatistics.org/blog/index.php?pk=57927&T=3

As an alternative you can also use a QR Code:  

The GUIDs for individual cells are displayed in the table below:

Multiple Linear Regression - Regression Statistics
Multiple R0.90975669067051
R-squared0.827657236219756
Adjusted R-squared0.72425157795161
F-TEST (value)8.00398401868412
F-TEST (DF numerator)18
F-TEST (DF denominator)30
p-value4.22611395878292e-07
Multiple Linear Regression - Residual Statistics
Residual Standard Deviation3.10793514765004
Sum Squared Residuals289.777826459955


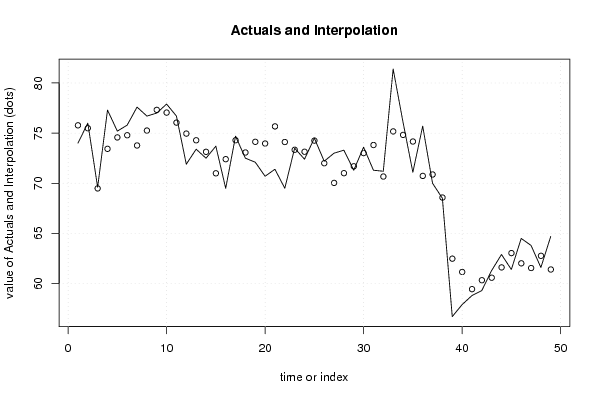
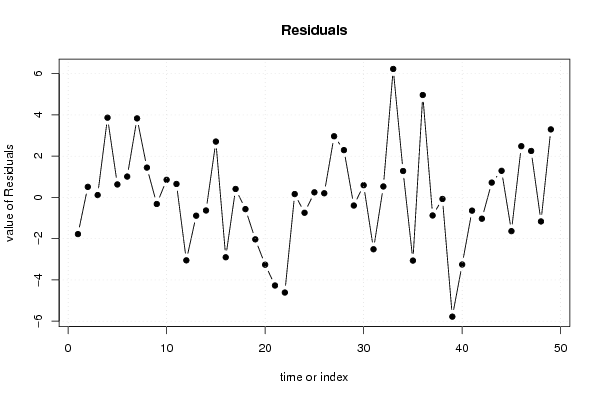
Multiple Linear Regression - Actuals, Interpolation, and Residuals
Time or IndexActualsInterpolationForecastResidualsPrediction Error
17475.7790253566907-1.7790253566907
27675.4896448753260.510355124674
369.669.48733130097970.112668699020267
477.373.43456612946443.8654338705356
575.274.57209718679430.627902813205723
675.874.78978795674081.01021204325918
777.673.76905649899963.83094350100039
876.775.25563112429331.44436887570675
97777.319662646084-0.319662646083947
1077.977.04723934636570.852760653634317
1176.776.04839133346320.651608666536769
1271.974.9530612412628-3.05306124126283
1373.474.287365418013-0.887365418013026
1472.573.1341707360195-0.634170736019501
1573.770.99312865218322.70687134781680
1669.572.403824300446-2.90382430044602
1774.774.29074973361540.409250266384581
1872.573.06852201431-0.568522014310007
1972.174.134010010568-2.03401001056808
2070.773.9630595953059-3.26305959530586
2171.475.6712787885589-4.27127878855884
2269.574.1135899882116-4.61358998821163
2373.573.33848103031270.161518969687286
2472.473.1451494319208-0.745149431920782
2574.574.25482869569750.245171304302463
2672.272.00010662800420.199893371995791
277370.0365462378762.96345376212398
2873.371.00707874010682.29292125989316
2971.371.6943946969648-0.394394696964843
3073.673.00880568033710.591194319662869
3171.373.8152074810518-2.51520748105184
3271.270.67003544802650.529964551973485
3381.475.17195424206526.22804575793478
3476.174.82111349341891.27888650658112
3571.174.1638782899017-3.0638782899017
3675.770.73563351699244.96436648300763
377070.876052990832-0.876052990831986
3868.568.5760777606503-0.0760777606502896
3956.762.482993808961-5.78299380896104
4057.961.1545308299827-3.25453082998274
4158.859.4427583826255-0.64275838262546
4259.360.332884348612-1.03288434861204
4361.360.58172600938050.718273990619535
4462.961.61127383237441.28872616762563
4561.463.037104323292-1.63710432329199
4664.562.01805717200382.48194282799619
4763.861.54924934632232.25075065367765
4861.662.766155809824-1.16615580982402
4964.761.40272753876683.29727246123325

\begin{tabular}{lllllllll}
\hline
Multiple Linear Regression - Actuals, Interpolation, and Residuals \tabularnewline
Time or Index & Actuals & InterpolationForecast & ResidualsPrediction Error \tabularnewline
1 & 74 & 75.7790253566907 & -1.7790253566907 \tabularnewline
2 & 76 & 75.489644875326 & 0.510355124674 \tabularnewline
3 & 69.6 & 69.4873313009797 & 0.112668699020267 \tabularnewline
4 & 77.3 & 73.4345661294644 & 3.8654338705356 \tabularnewline
5 & 75.2 & 74.5720971867943 & 0.627902813205723 \tabularnewline
6 & 75.8 & 74.7897879567408 & 1.01021204325918 \tabularnewline
7 & 77.6 & 73.7690564989996 & 3.83094350100039 \tabularnewline
8 & 76.7 & 75.2556311242933 & 1.44436887570675 \tabularnewline
9 & 77 & 77.319662646084 & -0.319662646083947 \tabularnewline
10 & 77.9 & 77.0472393463657 & 0.852760653634317 \tabularnewline
11 & 76.7 & 76.0483913334632 & 0.651608666536769 \tabularnewline
12 & 71.9 & 74.9530612412628 & -3.05306124126283 \tabularnewline
13 & 73.4 & 74.287365418013 & -0.887365418013026 \tabularnewline
14 & 72.5 & 73.1341707360195 & -0.634170736019501 \tabularnewline
15 & 73.7 & 70.9931286521832 & 2.70687134781680 \tabularnewline
16 & 69.5 & 72.403824300446 & -2.90382430044602 \tabularnewline
17 & 74.7 & 74.2907497336154 & 0.409250266384581 \tabularnewline
18 & 72.5 & 73.06852201431 & -0.568522014310007 \tabularnewline
19 & 72.1 & 74.134010010568 & -2.03401001056808 \tabularnewline
20 & 70.7 & 73.9630595953059 & -3.26305959530586 \tabularnewline
21 & 71.4 & 75.6712787885589 & -4.27127878855884 \tabularnewline
22 & 69.5 & 74.1135899882116 & -4.61358998821163 \tabularnewline
23 & 73.5 & 73.3384810303127 & 0.161518969687286 \tabularnewline
24 & 72.4 & 73.1451494319208 & -0.745149431920782 \tabularnewline
25 & 74.5 & 74.2548286956975 & 0.245171304302463 \tabularnewline
26 & 72.2 & 72.0001066280042 & 0.199893371995791 \tabularnewline
27 & 73 & 70.036546237876 & 2.96345376212398 \tabularnewline
28 & 73.3 & 71.0070787401068 & 2.29292125989316 \tabularnewline
29 & 71.3 & 71.6943946969648 & -0.394394696964843 \tabularnewline
30 & 73.6 & 73.0088056803371 & 0.591194319662869 \tabularnewline
31 & 71.3 & 73.8152074810518 & -2.51520748105184 \tabularnewline
32 & 71.2 & 70.6700354480265 & 0.529964551973485 \tabularnewline
33 & 81.4 & 75.1719542420652 & 6.22804575793478 \tabularnewline
34 & 76.1 & 74.8211134934189 & 1.27888650658112 \tabularnewline
35 & 71.1 & 74.1638782899017 & -3.0638782899017 \tabularnewline
36 & 75.7 & 70.7356335169924 & 4.96436648300763 \tabularnewline
37 & 70 & 70.876052990832 & -0.876052990831986 \tabularnewline
38 & 68.5 & 68.5760777606503 & -0.0760777606502896 \tabularnewline
39 & 56.7 & 62.482993808961 & -5.78299380896104 \tabularnewline
40 & 57.9 & 61.1545308299827 & -3.25453082998274 \tabularnewline
41 & 58.8 & 59.4427583826255 & -0.64275838262546 \tabularnewline
42 & 59.3 & 60.332884348612 & -1.03288434861204 \tabularnewline
43 & 61.3 & 60.5817260093805 & 0.718273990619535 \tabularnewline
44 & 62.9 & 61.6112738323744 & 1.28872616762563 \tabularnewline
45 & 61.4 & 63.037104323292 & -1.63710432329199 \tabularnewline
46 & 64.5 & 62.0180571720038 & 2.48194282799619 \tabularnewline
47 & 63.8 & 61.5492493463223 & 2.25075065367765 \tabularnewline
48 & 61.6 & 62.766155809824 & -1.16615580982402 \tabularnewline
49 & 64.7 & 61.4027275387668 & 3.29727246123325 \tabularnewline
\hline
\end{tabular}
%Source: https://freestatistics.org/blog/index.php?pk=57927&T=4

[TABLE]
[ROW][C]Multiple Linear Regression - Actuals, Interpolation, and Residuals[/C][/ROW]
[ROW][C]Time or Index[/C][C]Actuals[/C][C]InterpolationForecast[/C][C]ResidualsPrediction Error[/C][/ROW]
[ROW][C]1[/C][C]74[/C][C]75.7790253566907[/C][C]-1.7790253566907[/C][/ROW]
[ROW][C]2[/C][C]76[/C][C]75.489644875326[/C][C]0.510355124674[/C][/ROW]
[ROW][C]3[/C][C]69.6[/C][C]69.4873313009797[/C][C]0.112668699020267[/C][/ROW]
[ROW][C]4[/C][C]77.3[/C][C]73.4345661294644[/C][C]3.8654338705356[/C][/ROW]
[ROW][C]5[/C][C]75.2[/C][C]74.5720971867943[/C][C]0.627902813205723[/C][/ROW]
[ROW][C]6[/C][C]75.8[/C][C]74.7897879567408[/C][C]1.01021204325918[/C][/ROW]
[ROW][C]7[/C][C]77.6[/C][C]73.7690564989996[/C][C]3.83094350100039[/C][/ROW]
[ROW][C]8[/C][C]76.7[/C][C]75.2556311242933[/C][C]1.44436887570675[/C][/ROW]
[ROW][C]9[/C][C]77[/C][C]77.319662646084[/C][C]-0.319662646083947[/C][/ROW]
[ROW][C]10[/C][C]77.9[/C][C]77.0472393463657[/C][C]0.852760653634317[/C][/ROW]
[ROW][C]11[/C][C]76.7[/C][C]76.0483913334632[/C][C]0.651608666536769[/C][/ROW]
[ROW][C]12[/C][C]71.9[/C][C]74.9530612412628[/C][C]-3.05306124126283[/C][/ROW]
[ROW][C]13[/C][C]73.4[/C][C]74.287365418013[/C][C]-0.887365418013026[/C][/ROW]
[ROW][C]14[/C][C]72.5[/C][C]73.1341707360195[/C][C]-0.634170736019501[/C][/ROW]
[ROW][C]15[/C][C]73.7[/C][C]70.9931286521832[/C][C]2.70687134781680[/C][/ROW]
[ROW][C]16[/C][C]69.5[/C][C]72.403824300446[/C][C]-2.90382430044602[/C][/ROW]
[ROW][C]17[/C][C]74.7[/C][C]74.2907497336154[/C][C]0.409250266384581[/C][/ROW]
[ROW][C]18[/C][C]72.5[/C][C]73.06852201431[/C][C]-0.568522014310007[/C][/ROW]
[ROW][C]19[/C][C]72.1[/C][C]74.134010010568[/C][C]-2.03401001056808[/C][/ROW]
[ROW][C]20[/C][C]70.7[/C][C]73.9630595953059[/C][C]-3.26305959530586[/C][/ROW]
[ROW][C]21[/C][C]71.4[/C][C]75.6712787885589[/C][C]-4.27127878855884[/C][/ROW]
[ROW][C]22[/C][C]69.5[/C][C]74.1135899882116[/C][C]-4.61358998821163[/C][/ROW]
[ROW][C]23[/C][C]73.5[/C][C]73.3384810303127[/C][C]0.161518969687286[/C][/ROW]
[ROW][C]24[/C][C]72.4[/C][C]73.1451494319208[/C][C]-0.745149431920782[/C][/ROW]
[ROW][C]25[/C][C]74.5[/C][C]74.2548286956975[/C][C]0.245171304302463[/C][/ROW]
[ROW][C]26[/C][C]72.2[/C][C]72.0001066280042[/C][C]0.199893371995791[/C][/ROW]
[ROW][C]27[/C][C]73[/C][C]70.036546237876[/C][C]2.96345376212398[/C][/ROW]
[ROW][C]28[/C][C]73.3[/C][C]71.0070787401068[/C][C]2.29292125989316[/C][/ROW]
[ROW][C]29[/C][C]71.3[/C][C]71.6943946969648[/C][C]-0.394394696964843[/C][/ROW]
[ROW][C]30[/C][C]73.6[/C][C]73.0088056803371[/C][C]0.591194319662869[/C][/ROW]
[ROW][C]31[/C][C]71.3[/C][C]73.8152074810518[/C][C]-2.51520748105184[/C][/ROW]
[ROW][C]32[/C][C]71.2[/C][C]70.6700354480265[/C][C]0.529964551973485[/C][/ROW]
[ROW][C]33[/C][C]81.4[/C][C]75.1719542420652[/C][C]6.22804575793478[/C][/ROW]
[ROW][C]34[/C][C]76.1[/C][C]74.8211134934189[/C][C]1.27888650658112[/C][/ROW]
[ROW][C]35[/C][C]71.1[/C][C]74.1638782899017[/C][C]-3.0638782899017[/C][/ROW]
[ROW][C]36[/C][C]75.7[/C][C]70.7356335169924[/C][C]4.96436648300763[/C][/ROW]
[ROW][C]37[/C][C]70[/C][C]70.876052990832[/C][C]-0.876052990831986[/C][/ROW]
[ROW][C]38[/C][C]68.5[/C][C]68.5760777606503[/C][C]-0.0760777606502896[/C][/ROW]
[ROW][C]39[/C][C]56.7[/C][C]62.482993808961[/C][C]-5.78299380896104[/C][/ROW]
[ROW][C]40[/C][C]57.9[/C][C]61.1545308299827[/C][C]-3.25453082998274[/C][/ROW]
[ROW][C]41[/C][C]58.8[/C][C]59.4427583826255[/C][C]-0.64275838262546[/C][/ROW]
[ROW][C]42[/C][C]59.3[/C][C]60.332884348612[/C][C]-1.03288434861204[/C][/ROW]
[ROW][C]43[/C][C]61.3[/C][C]60.5817260093805[/C][C]0.718273990619535[/C][/ROW]
[ROW][C]44[/C][C]62.9[/C][C]61.6112738323744[/C][C]1.28872616762563[/C][/ROW]
[ROW][C]45[/C][C]61.4[/C][C]63.037104323292[/C][C]-1.63710432329199[/C][/ROW]
[ROW][C]46[/C][C]64.5[/C][C]62.0180571720038[/C][C]2.48194282799619[/C][/ROW]
[ROW][C]47[/C][C]63.8[/C][C]61.5492493463223[/C][C]2.25075065367765[/C][/ROW]
[ROW][C]48[/C][C]61.6[/C][C]62.766155809824[/C][C]-1.16615580982402[/C][/ROW]
[ROW][C]49[/C][C]64.7[/C][C]61.4027275387668[/C][C]3.29727246123325[/C][/ROW]
[/TABLE]
Source: https://freestatistics.org/blog/index.php?pk=57927&T=4

Globally Unique Identifier (entire table): ba.freestatistics.org/blog/index.php?pk=57927&T=4

As an alternative you can also use a QR Code:  

The GUIDs for individual cells are displayed in the table below:

Multiple Linear Regression - Actuals, Interpolation, and Residuals
Time or IndexActualsInterpolationForecastResidualsPrediction Error
17475.7790253566907-1.7790253566907
27675.4896448753260.510355124674
369.669.48733130097970.112668699020267
477.373.43456612946443.8654338705356
575.274.57209718679430.627902813205723
675.874.78978795674081.01021204325918
777.673.76905649899963.83094350100039
876.775.25563112429331.44436887570675
97777.319662646084-0.319662646083947
1077.977.04723934636570.852760653634317
1176.776.04839133346320.651608666536769
1271.974.9530612412628-3.05306124126283
1373.474.287365418013-0.887365418013026
1472.573.1341707360195-0.634170736019501
1573.770.99312865218322.70687134781680
1669.572.403824300446-2.90382430044602
1774.774.29074973361540.409250266384581
1872.573.06852201431-0.568522014310007
1972.174.134010010568-2.03401001056808
2070.773.9630595953059-3.26305959530586
2171.475.6712787885589-4.27127878855884
2269.574.1135899882116-4.61358998821163
2373.573.33848103031270.161518969687286
2472.473.1451494319208-0.745149431920782
2574.574.25482869569750.245171304302463
2672.272.00010662800420.199893371995791
277370.0365462378762.96345376212398
2873.371.00707874010682.29292125989316
2971.371.6943946969648-0.394394696964843
3073.673.00880568033710.591194319662869
3171.373.8152074810518-2.51520748105184
3271.270.67003544802650.529964551973485
3381.475.17195424206526.22804575793478
3476.174.82111349341891.27888650658112
3571.174.1638782899017-3.0638782899017
3675.770.73563351699244.96436648300763
377070.876052990832-0.876052990831986
3868.568.5760777606503-0.0760777606502896
3956.762.482993808961-5.78299380896104
4057.961.1545308299827-3.25453082998274
4158.859.4427583826255-0.64275838262546
4259.360.332884348612-1.03288434861204
4361.360.58172600938050.718273990619535
4462.961.61127383237441.28872616762563
4561.463.037104323292-1.63710432329199
4664.562.01805717200382.48194282799619
4763.861.54924934632232.25075065367765
4861.662.766155809824-1.16615580982402
4964.761.40272753876683.29727246123325


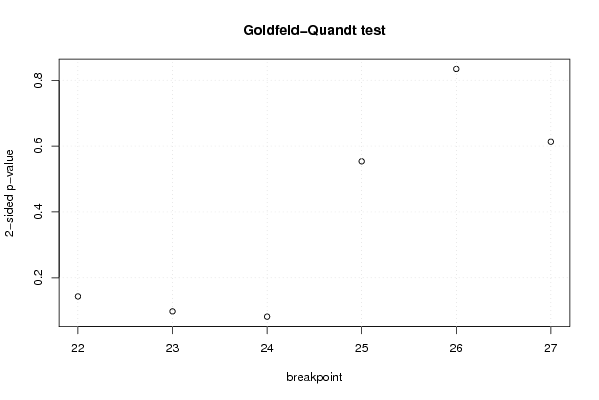
Goldfeld-Quandt test for Heteroskedasticity
p-valuesAlternative Hypothesis
breakpoint indexgreater2-sidedless
220.07163749514927260.1432749902985450.928362504850727
230.04892776504974740.09785553009949480.951072234950253
240.04091235419300880.08182470838601760.959087645806991
250.2768587837622070.5537175675244140.723141216237793
260.417176792785870.834353585571740.58282320721413
270.3066026478192160.6132052956384320.693397352180784

\begin{tabular}{lllllllll}
\hline
Goldfeld-Quandt test for Heteroskedasticity \tabularnewline
p-values & Alternative Hypothesis \tabularnewline
breakpoint index & greater & 2-sided & less \tabularnewline
22 & 0.0716374951492726 & 0.143274990298545 & 0.928362504850727 \tabularnewline
23 & 0.0489277650497474 & 0.0978555300994948 & 0.951072234950253 \tabularnewline
24 & 0.0409123541930088 & 0.0818247083860176 & 0.959087645806991 \tabularnewline
25 & 0.276858783762207 & 0.553717567524414 & 0.723141216237793 \tabularnewline
26 & 0.41717679278587 & 0.83435358557174 & 0.58282320721413 \tabularnewline
27 & 0.306602647819216 & 0.613205295638432 & 0.693397352180784 \tabularnewline
\hline
\end{tabular}
%Source: https://freestatistics.org/blog/index.php?pk=57927&T=5

[TABLE]
[ROW][C]Goldfeld-Quandt test for Heteroskedasticity[/C][/ROW]
[ROW][C]p-values[/C][C]Alternative Hypothesis[/C][/ROW]
[ROW][C]breakpoint index[/C][C]greater[/C][C]2-sided[/C][C]less[/C][/ROW]
[ROW][C]22[/C][C]0.0716374951492726[/C][C]0.143274990298545[/C][C]0.928362504850727[/C][/ROW]
[ROW][C]23[/C][C]0.0489277650497474[/C][C]0.0978555300994948[/C][C]0.951072234950253[/C][/ROW]
[ROW][C]24[/C][C]0.0409123541930088[/C][C]0.0818247083860176[/C][C]0.959087645806991[/C][/ROW]
[ROW][C]25[/C][C]0.276858783762207[/C][C]0.553717567524414[/C][C]0.723141216237793[/C][/ROW]
[ROW][C]26[/C][C]0.41717679278587[/C][C]0.83435358557174[/C][C]0.58282320721413[/C][/ROW]
[ROW][C]27[/C][C]0.306602647819216[/C][C]0.613205295638432[/C][C]0.693397352180784[/C][/ROW]
[/TABLE]
Source: https://freestatistics.org/blog/index.php?pk=57927&T=5

Globally Unique Identifier (entire table): ba.freestatistics.org/blog/index.php?pk=57927&T=5

As an alternative you can also use a QR Code:  

The GUIDs for individual cells are displayed in the table below:

Goldfeld-Quandt test for Heteroskedasticity
p-valuesAlternative Hypothesis
breakpoint indexgreater2-sidedless
220.07163749514927260.1432749902985450.928362504850727
230.04892776504974740.09785553009949480.951072234950253
240.04091235419300880.08182470838601760.959087645806991
250.2768587837622070.5537175675244140.723141216237793
260.417176792785870.834353585571740.58282320721413
270.3066026478192160.6132052956384320.693397352180784


Meta Analysis of Goldfeld-Quandt test for Heteroskedasticity
Description# significant tests% significant testsOK/NOK
1% type I error level00OK
5% type I error level00OK
10% type I error level20.333333333333333NOK

\begin{tabular}{lllllllll}
\hline
Meta Analysis of Goldfeld-Quandt test for Heteroskedasticity \tabularnewline
Description & # significant tests & % significant tests & OK/NOK \tabularnewline
1% type I error level & 0 & 0 & OK \tabularnewline
5% type I error level & 0 & 0 & OK \tabularnewline
10% type I error level & 2 & 0.333333333333333 & NOK \tabularnewline
\hline
\end{tabular}
%Source: https://freestatistics.org/blog/index.php?pk=57927&T=6

[TABLE]
[ROW][C]Meta Analysis of Goldfeld-Quandt test for Heteroskedasticity[/C][/ROW]
[ROW][C]Description[/C][C]# significant tests[/C][C]% significant tests[/C][C]OK/NOK[/C][/ROW]
[ROW][C]1% type I error level[/C][C]0[/C][C]0[/C][C]OK[/C][/ROW]
[ROW][C]5% type I error level[/C][C]0[/C][C]0[/C][C]OK[/C][/ROW]
[ROW][C]10% type I error level[/C][C]2[/C][C]0.333333333333333[/C][C]NOK[/C][/ROW]
[/TABLE]
Source: https://freestatistics.org/blog/index.php?pk=57927&T=6

Globally Unique Identifier (entire table): ba.freestatistics.org/blog/index.php?pk=57927&T=6

As an alternative you can also use a QR Code:  

The GUIDs for individual cells are displayed in the table below:

Meta Analysis of Goldfeld-Quandt test for Heteroskedasticity
Description# significant tests% significant testsOK/NOK
1% type I error level00OK
5% type I error level00OK
10% type I error level20.333333333333333NOK


Parameters (Session):
par1 = 4 ; par2 = Include Monthly Dummies ; par3 = Linear Trend ;
Parameters (R input):
par1 = 4 ; par2 = Include Monthly Dummies ; par3 = Linear Trend ;
R code (references can be found in the software module):
library(lattice)
library(lmtest)
n25 <- 25 #minimum number of obs. for Goldfeld-Quandt test
par1 <- as.numeric(par1)
x <- t(y)
k <- length(x[1,])
n <- length(x[,1])
x1 <- cbind(x[,par1], x[,1:k!=par1])
mycolnames <- c(colnames(x)[par1], colnames(x)[1:k!=par1])
colnames(x1) <- mycolnames #colnames(x)[par1]
x <- x1
if (par3 == 'First Differences'){
x2 <- array(0, dim=c(n-1,k), dimnames=list(1:(n-1), paste('(1-B)',colnames(x),sep='')))
for (i in 1:n-1) {
for (j in 1:k) {
x2[i,j] <- x[i+1,j] - x[i,j]
}
}
x <- x2
}
if (par2 == 'Include Monthly Dummies'){
x2 <- array(0, dim=c(n,11), dimnames=list(1:n, paste('M', seq(1:11), sep ='')))
for (i in 1:11){
x2[seq(i,n,12),i] <- 1
}
x <- cbind(x, x2)
}
if (par2 == 'Include Quarterly Dummies'){
x2 <- array(0, dim=c(n,3), dimnames=list(1:n, paste('Q', seq(1:3), sep ='')))
for (i in 1:3){
x2[seq(i,n,4),i] <- 1
}
x <- cbind(x, x2)
}
k <- length(x[1,])
if (par3 == 'Linear Trend'){
x <- cbind(x, c(1:n))
colnames(x)[k+1] <- 't'
}
x
k <- length(x[1,])
df <- as.data.frame(x)
(mylm <- lm(df))
(mysum <- summary(mylm))
if (n > n25) {
kp3 <- k + 3
nmkm3 <- n - k - 3
gqarr <- array(NA, dim=c(nmkm3-kp3+1,3))
numgqtests <- 0
numsignificant1 <- 0
numsignificant5 <- 0
numsignificant10 <- 0
for (mypoint in kp3:nmkm3) {
j <- 0
numgqtests <- numgqtests + 1
for (myalt in c('greater', 'two.sided', 'less')) {
j <- j + 1
gqarr[mypoint-kp3+1,j] <- gqtest(mylm, point=mypoint, alternative=myalt)$p.value
}
if (gqarr[mypoint-kp3+1,2] < 0.01) numsignificant1 <- numsignificant1 + 1
if (gqarr[mypoint-kp3+1,2] < 0.05) numsignificant5 <- numsignificant5 + 1
if (gqarr[mypoint-kp3+1,2] < 0.10) numsignificant10 <- numsignificant10 + 1
}
gqarr
}
bitmap(file='test0.png')
plot(x[,1], type='l', main='Actuals and Interpolation', ylab='value of Actuals and Interpolation (dots)', xlab='time or index')
points(x[,1]-mysum$resid)
grid()
dev.off()
bitmap(file='test1.png')
plot(mysum$resid, type='b', pch=19, main='Residuals', ylab='value of Residuals', xlab='time or index')
grid()
dev.off()
bitmap(file='test2.png')
hist(mysum$resid, main='Residual Histogram', xlab='values of Residuals')
grid()
dev.off()
bitmap(file='test3.png')
densityplot(~mysum$resid,col='black',main='Residual Density Plot', xlab='values of Residuals')
dev.off()
bitmap(file='test4.png')
qqnorm(mysum$resid, main='Residual Normal Q-Q Plot')
qqline(mysum$resid)
grid()
dev.off()
(myerror <- as.ts(mysum$resid))
bitmap(file='test5.png')
dum <- cbind(lag(myerror,k=1),myerror)
dum
dum1 <- dum[2:length(myerror),]
dum1
z <- as.data.frame(dum1)
z
plot(z,main=paste('Residual Lag plot, lowess, and regression line'), ylab='values of Residuals', xlab='lagged values of Residuals')
lines(lowess(z))
abline(lm(z))
grid()
dev.off()
bitmap(file='test6.png')
acf(mysum$resid, lag.max=length(mysum$resid)/2, main='Residual Autocorrelation Function')
grid()
dev.off()
bitmap(file='test7.png')
pacf(mysum$resid, lag.max=length(mysum$resid)/2, main='Residual Partial Autocorrelation Function')
grid()
dev.off()
bitmap(file='test8.png')
opar <- par(mfrow = c(2,2), oma = c(0, 0, 1.1, 0))
plot(mylm, las = 1, sub='Residual Diagnostics')
par(opar)
dev.off()
if (n > n25) {
bitmap(file='test9.png')
plot(kp3:nmkm3,gqarr[,2], main='Goldfeld-Quandt test',ylab='2-sided p-value',xlab='breakpoint')
grid()
dev.off()
}
load(file='createtable')
a<-table.start()
a<-table.row.start(a)
a<-table.element(a, 'Multiple Linear Regression - Estimated Regression Equation', 1, TRUE)
a<-table.row.end(a)
myeq <- colnames(x)[1]
myeq <- paste(myeq, '[t] = ', sep='')
for (i in 1:k){
if (mysum$coefficients[i,1] > 0) myeq <- paste(myeq, '+', '')
myeq <- paste(myeq, mysum$coefficients[i,1], sep=' ')
if (rownames(mysum$coefficients)[i] != '(Intercept)') {
myeq <- paste(myeq, rownames(mysum$coefficients)[i], sep='')
if (rownames(mysum$coefficients)[i] != 't') myeq <- paste(myeq, '[t]', sep='')
}
}
myeq <- paste(myeq, ' + e[t]')
a<-table.row.start(a)
a<-table.element(a, myeq)
a<-table.row.end(a)
a<-table.end(a)
table.save(a,file='mytable1.tab')
a<-table.start()
a<-table.row.start(a)
a<-table.element(a,hyperlink('ols1.htm','Multiple Linear Regression - Ordinary Least Squares',''), 6, TRUE)
a<-table.row.end(a)
a<-table.row.start(a)
a<-table.element(a,'Variable',header=TRUE)
a<-table.element(a,'Parameter',header=TRUE)
a<-table.element(a,'S.D.',header=TRUE)
a<-table.element(a,'T-STAT
H0: parameter = 0',header=TRUE)
a<-table.element(a,'2-tail p-value',header=TRUE)
a<-table.element(a,'1-tail p-value',header=TRUE)
a<-table.row.end(a)
for (i in 1:k){
a<-table.row.start(a)
a<-table.element(a,rownames(mysum$coefficients)[i],header=TRUE)
a<-table.element(a,mysum$coefficients[i,1])
a<-table.element(a, round(mysum$coefficients[i,2],6))
a<-table.element(a, round(mysum$coefficients[i,3],4))
a<-table.element(a, round(mysum$coefficients[i,4],6))
a<-table.element(a, round(mysum$coefficients[i,4]/2,6))
a<-table.row.end(a)
}
a<-table.end(a)
table.save(a,file='mytable2.tab')
a<-table.start()
a<-table.row.start(a)
a<-table.element(a, 'Multiple Linear Regression - Regression Statistics', 2, TRUE)
a<-table.row.end(a)
a<-table.row.start(a)
a<-table.element(a, 'Multiple R',1,TRUE)
a<-table.element(a, sqrt(mysum$r.squared))
a<-table.row.end(a)
a<-table.row.start(a)
a<-table.element(a, 'R-squared',1,TRUE)
a<-table.element(a, mysum$r.squared)
a<-table.row.end(a)
a<-table.row.start(a)
a<-table.element(a, 'Adjusted R-squared',1,TRUE)
a<-table.element(a, mysum$adj.r.squared)
a<-table.row.end(a)
a<-table.row.start(a)
a<-table.element(a, 'F-TEST (value)',1,TRUE)
a<-table.element(a, mysum$fstatistic[1])
a<-table.row.end(a)
a<-table.row.start(a)
a<-table.element(a, 'F-TEST (DF numerator)',1,TRUE)
a<-table.element(a, mysum$fstatistic[2])
a<-table.row.end(a)
a<-table.row.start(a)
a<-table.element(a, 'F-TEST (DF denominator)',1,TRUE)
a<-table.element(a, mysum$fstatistic[3])
a<-table.row.end(a)
a<-table.row.start(a)
a<-table.element(a, 'p-value',1,TRUE)
a<-table.element(a, 1-pf(mysum$fstatistic[1],mysum$fstatistic[2],mysum$fstatistic[3]))
a<-table.row.end(a)
a<-table.row.start(a)
a<-table.element(a, 'Multiple Linear Regression - Residual Statistics', 2, TRUE)
a<-table.row.end(a)
a<-table.row.start(a)
a<-table.element(a, 'Residual Standard Deviation',1,TRUE)
a<-table.element(a, mysum$sigma)
a<-table.row.end(a)
a<-table.row.start(a)
a<-table.element(a, 'Sum Squared Residuals',1,TRUE)
a<-table.element(a, sum(myerror*myerror))
a<-table.row.end(a)
a<-table.end(a)
table.save(a,file='mytable3.tab')
a<-table.start()
a<-table.row.start(a)
a<-table.element(a, 'Multiple Linear Regression - Actuals, Interpolation, and Residuals', 4, TRUE)
a<-table.row.end(a)
a<-table.row.start(a)
a<-table.element(a, 'Time or Index', 1, TRUE)
a<-table.element(a, 'Actuals', 1, TRUE)
a<-table.element(a, 'Interpolation
Forecast', 1, TRUE)
a<-table.element(a, 'Residuals
Prediction Error', 1, TRUE)
a<-table.row.end(a)
for (i in 1:n) {
a<-table.row.start(a)
a<-table.element(a,i, 1, TRUE)
a<-table.element(a,x[i])
a<-table.element(a,x[i]-mysum$resid[i])
a<-table.element(a,mysum$resid[i])
a<-table.row.end(a)
}
a<-table.end(a)
table.save(a,file='mytable4.tab')
if (n > n25) {
a<-table.start()
a<-table.row.start(a)
a<-table.element(a,'Goldfeld-Quandt test for Heteroskedasticity',4,TRUE)
a<-table.row.end(a)
a<-table.row.start(a)
a<-table.element(a,'p-values',header=TRUE)
a<-table.element(a,'Alternative Hypothesis',3,header=TRUE)
a<-table.row.end(a)
a<-table.row.start(a)
a<-table.element(a,'breakpoint index',header=TRUE)
a<-table.element(a,'greater',header=TRUE)
a<-table.element(a,'2-sided',header=TRUE)
a<-table.element(a,'less',header=TRUE)
a<-table.row.end(a)
for (mypoint in kp3:nmkm3) {
a<-table.row.start(a)
a<-table.element(a,mypoint,header=TRUE)
a<-table.element(a,gqarr[mypoint-kp3+1,1])
a<-table.element(a,gqarr[mypoint-kp3+1,2])
a<-table.element(a,gqarr[mypoint-kp3+1,3])
a<-table.row.end(a)
}
a<-table.end(a)
table.save(a,file='mytable5.tab')
a<-table.start()
a<-table.row.start(a)
a<-table.element(a,'Meta Analysis of Goldfeld-Quandt test for Heteroskedasticity',4,TRUE)
a<-table.row.end(a)
a<-table.row.start(a)
a<-table.element(a,'Description',header=TRUE)
a<-table.element(a,'# significant tests',header=TRUE)
a<-table.element(a,'% significant tests',header=TRUE)
a<-table.element(a,'OK/NOK',header=TRUE)
a<-table.row.end(a)
a<-table.row.start(a)
a<-table.element(a,'1% type I error level',header=TRUE)
a<-table.element(a,numsignificant1)
a<-table.element(a,numsignificant1/numgqtests)
if (numsignificant1/numgqtests < 0.01) dum <- 'OK' else dum <- 'NOK'
a<-table.element(a,dum)
a<-table.row.end(a)
a<-table.row.start(a)
a<-table.element(a,'5% type I error level',header=TRUE)
a<-table.element(a,numsignificant5)
a<-table.element(a,numsignificant5/numgqtests)
if (numsignificant5/numgqtests < 0.05) dum <- 'OK' else dum <- 'NOK'
a<-table.element(a,dum)
a<-table.row.end(a)
a<-table.row.start(a)
a<-table.element(a,'10% type I error level',header=TRUE)
a<-table.element(a,numsignificant10)
a<-table.element(a,numsignificant10/numgqtests)
if (numsignificant10/numgqtests < 0.1) dum <- 'OK' else dum <- 'NOK'
a<-table.element(a,dum)
a<-table.row.end(a)
a<-table.end(a)
table.save(a,file='mytable6.tab')
}