Free Statistics

of Irreproducible Research!

Author's title

Author*The author of this computation has been verified*
R Software Modulerwasp_multipleregression.wasp
Title produced by softwareMultiple Regression
Date of computationThu, 19 Nov 2009 12:59:08 -0700
Cite this page as followsStatistical Computations at FreeStatistics.org, Office for Research Development and Education, URL https://freestatistics.org/blog/index.php?v=date/2009/Nov/19/t1258660817tbv5dr3pj5ui4fz.htm/, Retrieved Sat, 20 Apr 2024 13:38:44 +0000
Statistical Computations at FreeStatistics.org, Office for Research Development and Education, URL https://freestatistics.org/blog/index.php?pk=57922, Retrieved Sat, 20 Apr 2024 13:38:44 +0000
QR Codes:

Original text written by user:
IsPrivate?No (this computation is public)
User-defined keywords
Estimated Impact160
Family? (F = Feedback message, R = changed R code, M = changed R Module, P = changed Parameters, D = changed Data)
-     [Multiple Regression] [Q1 The Seatbeltlaw] [2007-11-14 19:27:43] [8cd6641b921d30ebe00b648d1481bba0]
- RM D  [Multiple Regression] [Seatbelt] [2009-11-12 14:10:54] [b98453cac15ba1066b407e146608df68]
-    D      [Multiple Regression] [WS 7 Multiple reg...] [2009-11-19 19:59:08] [eba9f01697e64705b70041e6f338cb22] [Current]
Feedback Forum

Post a new message
Dataseries X:
95,26	96,8	94,76	119,93	101,21	108,01
117,96	114,1	95,26	94,76	119,93	101,21
115,86	110,3	117,96	95,26	94,76	119,93
111,44	103,9	115,86	117,96	95,26	94,76
108,16	101,6	111,44	115,86	117,96	95,26
108,77	94,6	108,16	111,44	115,86	117,96
109,45	95,9	108,77	108,16	111,44	115,86
124,83	104,7	109,45	108,77	108,16	111,44
115,31	102,8	124,83	109,45	108,77	108,16
109,49	98,1	115,31	124,83	109,45	108,77
124,24	113,9	109,49	115,31	124,83	109,45
92,85	80,9	124,24	109,49	115,31	124,83
98,42	95,7	92,85	124,24	109,49	115,31
120,88	113,2	98,42	92,85	124,24	109,49
111,72	105,9	120,88	98,42	92,85	124,24
116,1	108,8	111,72	120,88	98,42	92,85
109,37	102,3	116,1	111,72	120,88	98,42
111,65	99	109,37	116,1	111,72	120,88
114,29	100,7	111,65	109,37	116,1	111,72
133,68	115,5	114,29	111,65	109,37	116,1
114,27	100,7	133,68	114,29	111,65	109,37
126,49	109,9	114,27	133,68	114,29	111,65
131	114,6	126,49	114,27	133,68	114,29
104	85,4	131	126,49	114,27	133,68
108,88	100,5	104	131	126,49	114,27
128,48	114,8	108,88	104	131	126,49
132,44	116,5	128,48	108,88	104	131
128,04	112,9	132,44	128,48	108,88	104
116,35	102	128,04	132,44	128,48	108,88
120,93	106	116,35	128,04	132,44	128,48
118,59	105,3	120,93	116,35	128,04	132,44
133,1	118,8	118,59	120,93	116,35	128,04
121,05	106,1	133,1	118,59	120,93	116,35
127,62	109,3	121,05	133,1	118,59	120,93
135,44	117,2	127,62	121,05	133,1	118,59
114,88	92,5	135,44	127,62	121,05	133,1
114,34	104,2	114,88	135,44	127,62	121,05
128,85	112,5	114,34	114,88	135,44	127,62
138,9	122,4	128,85	114,34	114,88	135,44
129,44	113,3	138,9	128,85	114,34	114,88
114,96	100	129,44	138,9	128,85	114,34
127,98	110,7	114,96	129,44	138,9	128,85
127,03	112,8	127,98	114,96	129,44	138,9
128,75	109,8	127,03	127,98	114,96	129,44
137,91	117,3	128,75	127,03	127,98	114,96
128,37	109,1	137,91	128,75	127,03	127,98
135,9	115,9	128,37	137,91	128,75	127,03
122,19	96	135,9	128,37	137,91	128,75
113,08	99,8	122,19	135,9	128,37	137,91
136,2	116,8	113,08	122,19	135,9	128,37
138	115,7	136,2	113,08	122,19	135,9
115,24	99,4	138	136,2	113,08	122,19
110,95	94,3	115,24	138	136,2	113,08
99,23	91	110,95	115,24	138	136,2
102,39	93,2	99,23	110,95	115,24	138
112,67	103,1	102,39	99,23	110,95	115,24


Summary of computational transaction
Raw Inputview raw input (R code)
Raw Outputview raw output of R engine
Computing time3 seconds
R Server'Gwilym Jenkins' @ 72.249.127.135

\begin{tabular}{lllllllll}
\hline
Summary of computational transaction \tabularnewline
Raw Input & view raw input (R code)  \tabularnewline
Raw Output & view raw output of R engine  \tabularnewline
Computing time & 3 seconds \tabularnewline
R Server & 'Gwilym Jenkins' @ 72.249.127.135 \tabularnewline
\hline
\end{tabular}
%Source: https://freestatistics.org/blog/index.php?pk=57922&T=0

[TABLE]
[ROW][C]Summary of computational transaction[/C][/ROW]
[ROW][C]Raw Input[/C][C]view raw input (R code) [/C][/ROW]
[ROW][C]Raw Output[/C][C]view raw output of R engine [/C][/ROW]
[ROW][C]Computing time[/C][C]3 seconds[/C][/ROW]
[ROW][C]R Server[/C][C]'Gwilym Jenkins' @ 72.249.127.135[/C][/ROW]
[/TABLE]
Source: https://freestatistics.org/blog/index.php?pk=57922&T=0

Globally Unique Identifier (entire table): ba.freestatistics.org/blog/index.php?pk=57922&T=0

As an alternative you can also use a QR Code:  

The GUIDs for individual cells are displayed in the table below:

Summary of computational transaction
Raw Inputview raw input (R code)
Raw Outputview raw output of R engine
Computing time3 seconds
R Server'Gwilym Jenkins' @ 72.249.127.135


Multiple Linear Regression - Estimated Regression Equation
Y[t] = -40.0888737749896 + 0.965538000196312X[t] + 0.211997203187267Y1[t] + 0.314978135556808Y2[t] + 0.157411623308698Y3[t] -0.179123688240991Y4[t] -10.6311348674679M1[t] + 1.03583125266299M2[t] + 3.24681617767808M3[t] -8.72618456159211M4[t] -11.3837568394227M5[t] -2.30380200294361M6[t] + 0.542620183436238M7[t] + 3.56311254662019M8[t] -4.05010861645826M9[t] -4.49687150415468M10[t] -4.03469937535103M11[t] + 0.0118021665660321t + e[t]

\begin{tabular}{lllllllll}
\hline
Multiple Linear Regression - Estimated Regression Equation \tabularnewline
Y[t] =  -40.0888737749896 +  0.965538000196312X[t] +  0.211997203187267Y1[t] +  0.314978135556808Y2[t] +  0.157411623308698Y3[t] -0.179123688240991Y4[t] -10.6311348674679M1[t] +  1.03583125266299M2[t] +  3.24681617767808M3[t] -8.72618456159211M4[t] -11.3837568394227M5[t] -2.30380200294361M6[t] +  0.542620183436238M7[t] +  3.56311254662019M8[t] -4.05010861645826M9[t] -4.49687150415468M10[t] -4.03469937535103M11[t] +  0.0118021665660321t  + e[t] \tabularnewline
\hline
\end{tabular}
%Source: https://freestatistics.org/blog/index.php?pk=57922&T=1

[TABLE]
[ROW][C]Multiple Linear Regression - Estimated Regression Equation[/C][/ROW]
[ROW][C]Y[t] =  -40.0888737749896 +  0.965538000196312X[t] +  0.211997203187267Y1[t] +  0.314978135556808Y2[t] +  0.157411623308698Y3[t] -0.179123688240991Y4[t] -10.6311348674679M1[t] +  1.03583125266299M2[t] +  3.24681617767808M3[t] -8.72618456159211M4[t] -11.3837568394227M5[t] -2.30380200294361M6[t] +  0.542620183436238M7[t] +  3.56311254662019M8[t] -4.05010861645826M9[t] -4.49687150415468M10[t] -4.03469937535103M11[t] +  0.0118021665660321t  + e[t][/C][/ROW]
[/TABLE]
Source: https://freestatistics.org/blog/index.php?pk=57922&T=1

Globally Unique Identifier (entire table): ba.freestatistics.org/blog/index.php?pk=57922&T=1

As an alternative you can also use a QR Code:  

The GUIDs for individual cells are displayed in the table below:

Multiple Linear Regression - Estimated Regression Equation
Y[t] = -40.0888737749896 + 0.965538000196312X[t] + 0.211997203187267Y1[t] + 0.314978135556808Y2[t] + 0.157411623308698Y3[t] -0.179123688240991Y4[t] -10.6311348674679M1[t] + 1.03583125266299M2[t] + 3.24681617767808M3[t] -8.72618456159211M4[t] -11.3837568394227M5[t] -2.30380200294361M6[t] + 0.542620183436238M7[t] + 3.56311254662019M8[t] -4.05010861645826M9[t] -4.49687150415468M10[t] -4.03469937535103M11[t] + 0.0118021665660321t + e[t]


Multiple Linear Regression - Ordinary Least Squares
VariableParameterS.D.T-STATH0: parameter = 02-tail p-value1-tail p-value
(Intercept)-40.088873774989612.061746-3.32360.0019750.000987
X0.9655380001963120.08652111.159600
Y10.2119972031872670.0758672.79430.0081050.004053
Y20.3149781355568080.0689634.56735.1e-052.5e-05
Y30.1574116233086980.0908821.7320.0913770.045689
Y4-0.1791236882409910.09768-1.83380.0745290.037264
M1-10.63113486746792.617157-4.06210.0002350.000117
M21.035831252662993.5000920.29590.7688840.384442
M33.246816177678083.8687920.83920.4065880.203294
M4-8.726184561592113.687309-2.36650.0231550.011577
M5-11.38375683942272.665673-4.27050.0001266.3e-05
M6-2.303802002943612.500755-0.92120.3627360.181368
M70.5426201834362382.5830210.21010.8347340.417367
M83.563112546620193.1941551.11550.2716370.135818
M9-4.050108616458262.834299-1.4290.1611840.080592
M10-4.496871504154682.607262-1.72470.0926990.04635
M11-4.034699375351032.832042-1.42470.1624170.081208
t0.01180216656603210.0534850.22070.8265360.413268

\begin{tabular}{lllllllll}
\hline
Multiple Linear Regression - Ordinary Least Squares \tabularnewline
Variable & Parameter & S.D. & T-STATH0: parameter = 0 & 2-tail p-value & 1-tail p-value \tabularnewline
(Intercept) & -40.0888737749896 & 12.061746 & -3.3236 & 0.001975 & 0.000987 \tabularnewline
X & 0.965538000196312 & 0.086521 & 11.1596 & 0 & 0 \tabularnewline
Y1 & 0.211997203187267 & 0.075867 & 2.7943 & 0.008105 & 0.004053 \tabularnewline
Y2 & 0.314978135556808 & 0.068963 & 4.5673 & 5.1e-05 & 2.5e-05 \tabularnewline
Y3 & 0.157411623308698 & 0.090882 & 1.732 & 0.091377 & 0.045689 \tabularnewline
Y4 & -0.179123688240991 & 0.09768 & -1.8338 & 0.074529 & 0.037264 \tabularnewline
M1 & -10.6311348674679 & 2.617157 & -4.0621 & 0.000235 & 0.000117 \tabularnewline
M2 & 1.03583125266299 & 3.500092 & 0.2959 & 0.768884 & 0.384442 \tabularnewline
M3 & 3.24681617767808 & 3.868792 & 0.8392 & 0.406588 & 0.203294 \tabularnewline
M4 & -8.72618456159211 & 3.687309 & -2.3665 & 0.023155 & 0.011577 \tabularnewline
M5 & -11.3837568394227 & 2.665673 & -4.2705 & 0.000126 & 6.3e-05 \tabularnewline
M6 & -2.30380200294361 & 2.500755 & -0.9212 & 0.362736 & 0.181368 \tabularnewline
M7 & 0.542620183436238 & 2.583021 & 0.2101 & 0.834734 & 0.417367 \tabularnewline
M8 & 3.56311254662019 & 3.194155 & 1.1155 & 0.271637 & 0.135818 \tabularnewline
M9 & -4.05010861645826 & 2.834299 & -1.429 & 0.161184 & 0.080592 \tabularnewline
M10 & -4.49687150415468 & 2.607262 & -1.7247 & 0.092699 & 0.04635 \tabularnewline
M11 & -4.03469937535103 & 2.832042 & -1.4247 & 0.162417 & 0.081208 \tabularnewline
t & 0.0118021665660321 & 0.053485 & 0.2207 & 0.826536 & 0.413268 \tabularnewline
\hline
\end{tabular}
%Source: https://freestatistics.org/blog/index.php?pk=57922&T=2

[TABLE]
[ROW][C]Multiple Linear Regression - Ordinary Least Squares[/C][/ROW]
[ROW][C]Variable[/C][C]Parameter[/C][C]S.D.[/C][C]T-STATH0: parameter = 0[/C][C]2-tail p-value[/C][C]1-tail p-value[/C][/ROW]
[ROW][C](Intercept)[/C][C]-40.0888737749896[/C][C]12.061746[/C][C]-3.3236[/C][C]0.001975[/C][C]0.000987[/C][/ROW]
[ROW][C]X[/C][C]0.965538000196312[/C][C]0.086521[/C][C]11.1596[/C][C]0[/C][C]0[/C][/ROW]
[ROW][C]Y1[/C][C]0.211997203187267[/C][C]0.075867[/C][C]2.7943[/C][C]0.008105[/C][C]0.004053[/C][/ROW]
[ROW][C]Y2[/C][C]0.314978135556808[/C][C]0.068963[/C][C]4.5673[/C][C]5.1e-05[/C][C]2.5e-05[/C][/ROW]
[ROW][C]Y3[/C][C]0.157411623308698[/C][C]0.090882[/C][C]1.732[/C][C]0.091377[/C][C]0.045689[/C][/ROW]
[ROW][C]Y4[/C][C]-0.179123688240991[/C][C]0.09768[/C][C]-1.8338[/C][C]0.074529[/C][C]0.037264[/C][/ROW]
[ROW][C]M1[/C][C]-10.6311348674679[/C][C]2.617157[/C][C]-4.0621[/C][C]0.000235[/C][C]0.000117[/C][/ROW]
[ROW][C]M2[/C][C]1.03583125266299[/C][C]3.500092[/C][C]0.2959[/C][C]0.768884[/C][C]0.384442[/C][/ROW]
[ROW][C]M3[/C][C]3.24681617767808[/C][C]3.868792[/C][C]0.8392[/C][C]0.406588[/C][C]0.203294[/C][/ROW]
[ROW][C]M4[/C][C]-8.72618456159211[/C][C]3.687309[/C][C]-2.3665[/C][C]0.023155[/C][C]0.011577[/C][/ROW]
[ROW][C]M5[/C][C]-11.3837568394227[/C][C]2.665673[/C][C]-4.2705[/C][C]0.000126[/C][C]6.3e-05[/C][/ROW]
[ROW][C]M6[/C][C]-2.30380200294361[/C][C]2.500755[/C][C]-0.9212[/C][C]0.362736[/C][C]0.181368[/C][/ROW]
[ROW][C]M7[/C][C]0.542620183436238[/C][C]2.583021[/C][C]0.2101[/C][C]0.834734[/C][C]0.417367[/C][/ROW]
[ROW][C]M8[/C][C]3.56311254662019[/C][C]3.194155[/C][C]1.1155[/C][C]0.271637[/C][C]0.135818[/C][/ROW]
[ROW][C]M9[/C][C]-4.05010861645826[/C][C]2.834299[/C][C]-1.429[/C][C]0.161184[/C][C]0.080592[/C][/ROW]
[ROW][C]M10[/C][C]-4.49687150415468[/C][C]2.607262[/C][C]-1.7247[/C][C]0.092699[/C][C]0.04635[/C][/ROW]
[ROW][C]M11[/C][C]-4.03469937535103[/C][C]2.832042[/C][C]-1.4247[/C][C]0.162417[/C][C]0.081208[/C][/ROW]
[ROW][C]t[/C][C]0.0118021665660321[/C][C]0.053485[/C][C]0.2207[/C][C]0.826536[/C][C]0.413268[/C][/ROW]
[/TABLE]
Source: https://freestatistics.org/blog/index.php?pk=57922&T=2

Globally Unique Identifier (entire table): ba.freestatistics.org/blog/index.php?pk=57922&T=2

As an alternative you can also use a QR Code:  

The GUIDs for individual cells are displayed in the table below:

Multiple Linear Regression - Ordinary Least Squares
VariableParameterS.D.T-STATH0: parameter = 02-tail p-value1-tail p-value
(Intercept)-40.088873774989612.061746-3.32360.0019750.000987
X0.9655380001963120.08652111.159600
Y10.2119972031872670.0758672.79430.0081050.004053
Y20.3149781355568080.0689634.56735.1e-052.5e-05
Y30.1574116233086980.0908821.7320.0913770.045689
Y4-0.1791236882409910.09768-1.83380.0745290.037264
M1-10.63113486746792.617157-4.06210.0002350.000117
M21.035831252662993.5000920.29590.7688840.384442
M33.246816177678083.8687920.83920.4065880.203294
M4-8.726184561592113.687309-2.36650.0231550.011577
M5-11.38375683942272.665673-4.27050.0001266.3e-05
M6-2.303802002943612.500755-0.92120.3627360.181368
M70.5426201834362382.5830210.21010.8347340.417367
M83.563112546620193.1941551.11550.2716370.135818
M9-4.050108616458262.834299-1.4290.1611840.080592
M10-4.496871504154682.607262-1.72470.0926990.04635
M11-4.034699375351032.832042-1.42470.1624170.081208
t0.01180216656603210.0534850.22070.8265360.413268


Multiple Linear Regression - Regression Statistics
Multiple R0.98352786285997
R-squared0.9673270570219
Adjusted R-squared0.952710214110644
F-TEST (value)66.1789322697735
F-TEST (DF numerator)17
F-TEST (DF denominator)38
p-value0
Multiple Linear Regression - Residual Statistics
Residual Standard Deviation2.49539822501776
Sum Squared Residuals236.626467454028

\begin{tabular}{lllllllll}
\hline
Multiple Linear Regression - Regression Statistics \tabularnewline
Multiple R & 0.98352786285997 \tabularnewline
R-squared & 0.9673270570219 \tabularnewline
Adjusted R-squared & 0.952710214110644 \tabularnewline
F-TEST (value) & 66.1789322697735 \tabularnewline
F-TEST (DF numerator) & 17 \tabularnewline
F-TEST (DF denominator) & 38 \tabularnewline
p-value & 0 \tabularnewline
Multiple Linear Regression - Residual Statistics \tabularnewline
Residual Standard Deviation & 2.49539822501776 \tabularnewline
Sum Squared Residuals & 236.626467454028 \tabularnewline
\hline
\end{tabular}
%Source: https://freestatistics.org/blog/index.php?pk=57922&T=3

[TABLE]
[ROW][C]Multiple Linear Regression - Regression Statistics[/C][/ROW]
[ROW][C]Multiple R[/C][C]0.98352786285997[/C][/ROW]
[ROW][C]R-squared[/C][C]0.9673270570219[/C][/ROW]
[ROW][C]Adjusted R-squared[/C][C]0.952710214110644[/C][/ROW]
[ROW][C]F-TEST (value)[/C][C]66.1789322697735[/C][/ROW]
[ROW][C]F-TEST (DF numerator)[/C][C]17[/C][/ROW]
[ROW][C]F-TEST (DF denominator)[/C][C]38[/C][/ROW]
[ROW][C]p-value[/C][C]0[/C][/ROW]
[ROW][C]Multiple Linear Regression - Residual Statistics[/C][/ROW]
[ROW][C]Residual Standard Deviation[/C][C]2.49539822501776[/C][/ROW]
[ROW][C]Sum Squared Residuals[/C][C]236.626467454028[/C][/ROW]
[/TABLE]
Source: https://freestatistics.org/blog/index.php?pk=57922&T=3

Globally Unique Identifier (entire table): ba.freestatistics.org/blog/index.php?pk=57922&T=3

As an alternative you can also use a QR Code:  

The GUIDs for individual cells are displayed in the table below:

Multiple Linear Regression - Regression Statistics
Multiple R0.98352786285997
R-squared0.9673270570219
Adjusted R-squared0.952710214110644
F-TEST (value)66.1789322697735
F-TEST (DF numerator)17
F-TEST (DF denominator)38
p-value0
Multiple Linear Regression - Residual Statistics
Residual Standard Deviation2.49539822501776
Sum Squared Residuals236.626467454028


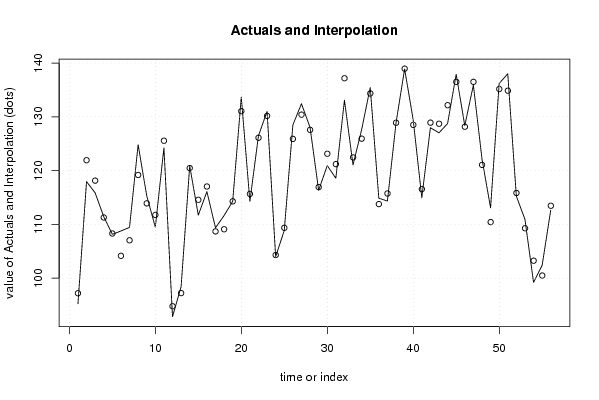
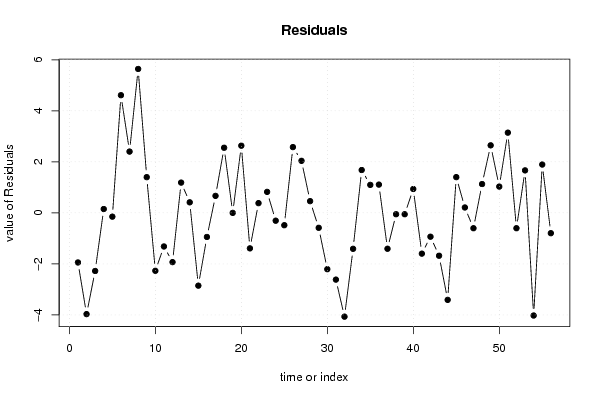
Multiple Linear Regression - Actuals, Interpolation, and Residuals
Time or IndexActualsInterpolationForecastResidualsPrediction Error
195.2697.2045355426287-1.94453554262867
2117.96121.929896830728-3.96989683072825
3115.86118.138219099141-2.27821909914148
4111.44111.2896359203070.150364079692696
5108.16108.308328690821-0.148328690821096
6108.77104.1570933748584.612906625142
7109.45107.0471075076592.40289249234138
8124.83119.1878477775665.6421522224342
9115.31113.9101554855281.39984451447206
10109.49111.761090968019-2.27109096801872
11124.24125.557336751923-1.31733675192334
1292.8594.7813893063884-1.93138930638843
1398.4297.23247616420421.18752383579579
14120.88120.4661415103270.41385848967269
15111.72114.573161341898-2.85316134189815
16116.1117.044012828888-0.944012828887981
17109.37108.7033398606180.666660139381755
18111.65109.0966760119042.55332398809623
19114.29114.290101630533-0.000101630532604924
20133.68131.0462393493092.63376065069116
21114.27115.661426920568-1.3914269205678
22126.49126.1091408121710.380859187829363
23131130.1773487592530.82265124074683
24104104.306712974902-0.306712974902057
25108.88109.363991807859-0.483991807859451
26128.48125.9011251397012.57887486029903
27132.44130.3996036523022.04039634769824
28128.04127.5800569646790.459943035320896
29116.35116.935592592290-0.585592592290121
30120.93123.137876233190-2.20787623319043
31118.59121.207135823945-2.6171358239449
32133.1137.168722113519-4.06872211351877
33121.05122.458902245849-1.40890224584852
34127.62125.9406998831831.67930011681706
35135.44134.3429515562771.09704844372256
36114.88113.7719941956321.10800580436833
37114.34115.746557427993-1.40655742799279
38128.85128.902978422081-0.0529784220806831
39138.9138.953452723380-0.0534527233804785
40129.44128.5045437414990.935456258500719
41114.96116.557924393677-1.59792439367745
42127.98128.914427432180-0.934427432179746
43127.03128.710294744851-1.68029474485127
44128.75132.160783041184-3.41078304118390
45137.91136.5095153480561.40048465194426
46128.37128.1590683366280.210931663372300
47135.9136.502362932546-0.602362932546049
48122.19121.0599035230781.13009647692215
49113.08110.4324390573152.64756094268512
50136.2135.1698580971631.03014190283722
51138134.8555631832783.14443681672186
52115.24115.841750544626-0.601750544626329
53110.95109.2848144625931.66518553740691
5499.23103.253926947868-4.02392694786806
55102.39100.4953602930131.8946397069874
56112.67113.466407718423-0.796407718422687

\begin{tabular}{lllllllll}
\hline
Multiple Linear Regression - Actuals, Interpolation, and Residuals \tabularnewline
Time or Index & Actuals & InterpolationForecast & ResidualsPrediction Error \tabularnewline
1 & 95.26 & 97.2045355426287 & -1.94453554262867 \tabularnewline
2 & 117.96 & 121.929896830728 & -3.96989683072825 \tabularnewline
3 & 115.86 & 118.138219099141 & -2.27821909914148 \tabularnewline
4 & 111.44 & 111.289635920307 & 0.150364079692696 \tabularnewline
5 & 108.16 & 108.308328690821 & -0.148328690821096 \tabularnewline
6 & 108.77 & 104.157093374858 & 4.612906625142 \tabularnewline
7 & 109.45 & 107.047107507659 & 2.40289249234138 \tabularnewline
8 & 124.83 & 119.187847777566 & 5.6421522224342 \tabularnewline
9 & 115.31 & 113.910155485528 & 1.39984451447206 \tabularnewline
10 & 109.49 & 111.761090968019 & -2.27109096801872 \tabularnewline
11 & 124.24 & 125.557336751923 & -1.31733675192334 \tabularnewline
12 & 92.85 & 94.7813893063884 & -1.93138930638843 \tabularnewline
13 & 98.42 & 97.2324761642042 & 1.18752383579579 \tabularnewline
14 & 120.88 & 120.466141510327 & 0.41385848967269 \tabularnewline
15 & 111.72 & 114.573161341898 & -2.85316134189815 \tabularnewline
16 & 116.1 & 117.044012828888 & -0.944012828887981 \tabularnewline
17 & 109.37 & 108.703339860618 & 0.666660139381755 \tabularnewline
18 & 111.65 & 109.096676011904 & 2.55332398809623 \tabularnewline
19 & 114.29 & 114.290101630533 & -0.000101630532604924 \tabularnewline
20 & 133.68 & 131.046239349309 & 2.63376065069116 \tabularnewline
21 & 114.27 & 115.661426920568 & -1.3914269205678 \tabularnewline
22 & 126.49 & 126.109140812171 & 0.380859187829363 \tabularnewline
23 & 131 & 130.177348759253 & 0.82265124074683 \tabularnewline
24 & 104 & 104.306712974902 & -0.306712974902057 \tabularnewline
25 & 108.88 & 109.363991807859 & -0.483991807859451 \tabularnewline
26 & 128.48 & 125.901125139701 & 2.57887486029903 \tabularnewline
27 & 132.44 & 130.399603652302 & 2.04039634769824 \tabularnewline
28 & 128.04 & 127.580056964679 & 0.459943035320896 \tabularnewline
29 & 116.35 & 116.935592592290 & -0.585592592290121 \tabularnewline
30 & 120.93 & 123.137876233190 & -2.20787623319043 \tabularnewline
31 & 118.59 & 121.207135823945 & -2.6171358239449 \tabularnewline
32 & 133.1 & 137.168722113519 & -4.06872211351877 \tabularnewline
33 & 121.05 & 122.458902245849 & -1.40890224584852 \tabularnewline
34 & 127.62 & 125.940699883183 & 1.67930011681706 \tabularnewline
35 & 135.44 & 134.342951556277 & 1.09704844372256 \tabularnewline
36 & 114.88 & 113.771994195632 & 1.10800580436833 \tabularnewline
37 & 114.34 & 115.746557427993 & -1.40655742799279 \tabularnewline
38 & 128.85 & 128.902978422081 & -0.0529784220806831 \tabularnewline
39 & 138.9 & 138.953452723380 & -0.0534527233804785 \tabularnewline
40 & 129.44 & 128.504543741499 & 0.935456258500719 \tabularnewline
41 & 114.96 & 116.557924393677 & -1.59792439367745 \tabularnewline
42 & 127.98 & 128.914427432180 & -0.934427432179746 \tabularnewline
43 & 127.03 & 128.710294744851 & -1.68029474485127 \tabularnewline
44 & 128.75 & 132.160783041184 & -3.41078304118390 \tabularnewline
45 & 137.91 & 136.509515348056 & 1.40048465194426 \tabularnewline
46 & 128.37 & 128.159068336628 & 0.210931663372300 \tabularnewline
47 & 135.9 & 136.502362932546 & -0.602362932546049 \tabularnewline
48 & 122.19 & 121.059903523078 & 1.13009647692215 \tabularnewline
49 & 113.08 & 110.432439057315 & 2.64756094268512 \tabularnewline
50 & 136.2 & 135.169858097163 & 1.03014190283722 \tabularnewline
51 & 138 & 134.855563183278 & 3.14443681672186 \tabularnewline
52 & 115.24 & 115.841750544626 & -0.601750544626329 \tabularnewline
53 & 110.95 & 109.284814462593 & 1.66518553740691 \tabularnewline
54 & 99.23 & 103.253926947868 & -4.02392694786806 \tabularnewline
55 & 102.39 & 100.495360293013 & 1.8946397069874 \tabularnewline
56 & 112.67 & 113.466407718423 & -0.796407718422687 \tabularnewline
\hline
\end{tabular}
%Source: https://freestatistics.org/blog/index.php?pk=57922&T=4

[TABLE]
[ROW][C]Multiple Linear Regression - Actuals, Interpolation, and Residuals[/C][/ROW]
[ROW][C]Time or Index[/C][C]Actuals[/C][C]InterpolationForecast[/C][C]ResidualsPrediction Error[/C][/ROW]
[ROW][C]1[/C][C]95.26[/C][C]97.2045355426287[/C][C]-1.94453554262867[/C][/ROW]
[ROW][C]2[/C][C]117.96[/C][C]121.929896830728[/C][C]-3.96989683072825[/C][/ROW]
[ROW][C]3[/C][C]115.86[/C][C]118.138219099141[/C][C]-2.27821909914148[/C][/ROW]
[ROW][C]4[/C][C]111.44[/C][C]111.289635920307[/C][C]0.150364079692696[/C][/ROW]
[ROW][C]5[/C][C]108.16[/C][C]108.308328690821[/C][C]-0.148328690821096[/C][/ROW]
[ROW][C]6[/C][C]108.77[/C][C]104.157093374858[/C][C]4.612906625142[/C][/ROW]
[ROW][C]7[/C][C]109.45[/C][C]107.047107507659[/C][C]2.40289249234138[/C][/ROW]
[ROW][C]8[/C][C]124.83[/C][C]119.187847777566[/C][C]5.6421522224342[/C][/ROW]
[ROW][C]9[/C][C]115.31[/C][C]113.910155485528[/C][C]1.39984451447206[/C][/ROW]
[ROW][C]10[/C][C]109.49[/C][C]111.761090968019[/C][C]-2.27109096801872[/C][/ROW]
[ROW][C]11[/C][C]124.24[/C][C]125.557336751923[/C][C]-1.31733675192334[/C][/ROW]
[ROW][C]12[/C][C]92.85[/C][C]94.7813893063884[/C][C]-1.93138930638843[/C][/ROW]
[ROW][C]13[/C][C]98.42[/C][C]97.2324761642042[/C][C]1.18752383579579[/C][/ROW]
[ROW][C]14[/C][C]120.88[/C][C]120.466141510327[/C][C]0.41385848967269[/C][/ROW]
[ROW][C]15[/C][C]111.72[/C][C]114.573161341898[/C][C]-2.85316134189815[/C][/ROW]
[ROW][C]16[/C][C]116.1[/C][C]117.044012828888[/C][C]-0.944012828887981[/C][/ROW]
[ROW][C]17[/C][C]109.37[/C][C]108.703339860618[/C][C]0.666660139381755[/C][/ROW]
[ROW][C]18[/C][C]111.65[/C][C]109.096676011904[/C][C]2.55332398809623[/C][/ROW]
[ROW][C]19[/C][C]114.29[/C][C]114.290101630533[/C][C]-0.000101630532604924[/C][/ROW]
[ROW][C]20[/C][C]133.68[/C][C]131.046239349309[/C][C]2.63376065069116[/C][/ROW]
[ROW][C]21[/C][C]114.27[/C][C]115.661426920568[/C][C]-1.3914269205678[/C][/ROW]
[ROW][C]22[/C][C]126.49[/C][C]126.109140812171[/C][C]0.380859187829363[/C][/ROW]
[ROW][C]23[/C][C]131[/C][C]130.177348759253[/C][C]0.82265124074683[/C][/ROW]
[ROW][C]24[/C][C]104[/C][C]104.306712974902[/C][C]-0.306712974902057[/C][/ROW]
[ROW][C]25[/C][C]108.88[/C][C]109.363991807859[/C][C]-0.483991807859451[/C][/ROW]
[ROW][C]26[/C][C]128.48[/C][C]125.901125139701[/C][C]2.57887486029903[/C][/ROW]
[ROW][C]27[/C][C]132.44[/C][C]130.399603652302[/C][C]2.04039634769824[/C][/ROW]
[ROW][C]28[/C][C]128.04[/C][C]127.580056964679[/C][C]0.459943035320896[/C][/ROW]
[ROW][C]29[/C][C]116.35[/C][C]116.935592592290[/C][C]-0.585592592290121[/C][/ROW]
[ROW][C]30[/C][C]120.93[/C][C]123.137876233190[/C][C]-2.20787623319043[/C][/ROW]
[ROW][C]31[/C][C]118.59[/C][C]121.207135823945[/C][C]-2.6171358239449[/C][/ROW]
[ROW][C]32[/C][C]133.1[/C][C]137.168722113519[/C][C]-4.06872211351877[/C][/ROW]
[ROW][C]33[/C][C]121.05[/C][C]122.458902245849[/C][C]-1.40890224584852[/C][/ROW]
[ROW][C]34[/C][C]127.62[/C][C]125.940699883183[/C][C]1.67930011681706[/C][/ROW]
[ROW][C]35[/C][C]135.44[/C][C]134.342951556277[/C][C]1.09704844372256[/C][/ROW]
[ROW][C]36[/C][C]114.88[/C][C]113.771994195632[/C][C]1.10800580436833[/C][/ROW]
[ROW][C]37[/C][C]114.34[/C][C]115.746557427993[/C][C]-1.40655742799279[/C][/ROW]
[ROW][C]38[/C][C]128.85[/C][C]128.902978422081[/C][C]-0.0529784220806831[/C][/ROW]
[ROW][C]39[/C][C]138.9[/C][C]138.953452723380[/C][C]-0.0534527233804785[/C][/ROW]
[ROW][C]40[/C][C]129.44[/C][C]128.504543741499[/C][C]0.935456258500719[/C][/ROW]
[ROW][C]41[/C][C]114.96[/C][C]116.557924393677[/C][C]-1.59792439367745[/C][/ROW]
[ROW][C]42[/C][C]127.98[/C][C]128.914427432180[/C][C]-0.934427432179746[/C][/ROW]
[ROW][C]43[/C][C]127.03[/C][C]128.710294744851[/C][C]-1.68029474485127[/C][/ROW]
[ROW][C]44[/C][C]128.75[/C][C]132.160783041184[/C][C]-3.41078304118390[/C][/ROW]
[ROW][C]45[/C][C]137.91[/C][C]136.509515348056[/C][C]1.40048465194426[/C][/ROW]
[ROW][C]46[/C][C]128.37[/C][C]128.159068336628[/C][C]0.210931663372300[/C][/ROW]
[ROW][C]47[/C][C]135.9[/C][C]136.502362932546[/C][C]-0.602362932546049[/C][/ROW]
[ROW][C]48[/C][C]122.19[/C][C]121.059903523078[/C][C]1.13009647692215[/C][/ROW]
[ROW][C]49[/C][C]113.08[/C][C]110.432439057315[/C][C]2.64756094268512[/C][/ROW]
[ROW][C]50[/C][C]136.2[/C][C]135.169858097163[/C][C]1.03014190283722[/C][/ROW]
[ROW][C]51[/C][C]138[/C][C]134.855563183278[/C][C]3.14443681672186[/C][/ROW]
[ROW][C]52[/C][C]115.24[/C][C]115.841750544626[/C][C]-0.601750544626329[/C][/ROW]
[ROW][C]53[/C][C]110.95[/C][C]109.284814462593[/C][C]1.66518553740691[/C][/ROW]
[ROW][C]54[/C][C]99.23[/C][C]103.253926947868[/C][C]-4.02392694786806[/C][/ROW]
[ROW][C]55[/C][C]102.39[/C][C]100.495360293013[/C][C]1.8946397069874[/C][/ROW]
[ROW][C]56[/C][C]112.67[/C][C]113.466407718423[/C][C]-0.796407718422687[/C][/ROW]
[/TABLE]
Source: https://freestatistics.org/blog/index.php?pk=57922&T=4

Globally Unique Identifier (entire table): ba.freestatistics.org/blog/index.php?pk=57922&T=4

As an alternative you can also use a QR Code:  

The GUIDs for individual cells are displayed in the table below:

Multiple Linear Regression - Actuals, Interpolation, and Residuals
Time or IndexActualsInterpolationForecastResidualsPrediction Error
195.2697.2045355426287-1.94453554262867
2117.96121.929896830728-3.96989683072825
3115.86118.138219099141-2.27821909914148
4111.44111.2896359203070.150364079692696
5108.16108.308328690821-0.148328690821096
6108.77104.1570933748584.612906625142
7109.45107.0471075076592.40289249234138
8124.83119.1878477775665.6421522224342
9115.31113.9101554855281.39984451447206
10109.49111.761090968019-2.27109096801872
11124.24125.557336751923-1.31733675192334
1292.8594.7813893063884-1.93138930638843
1398.4297.23247616420421.18752383579579
14120.88120.4661415103270.41385848967269
15111.72114.573161341898-2.85316134189815
16116.1117.044012828888-0.944012828887981
17109.37108.7033398606180.666660139381755
18111.65109.0966760119042.55332398809623
19114.29114.290101630533-0.000101630532604924
20133.68131.0462393493092.63376065069116
21114.27115.661426920568-1.3914269205678
22126.49126.1091408121710.380859187829363
23131130.1773487592530.82265124074683
24104104.306712974902-0.306712974902057
25108.88109.363991807859-0.483991807859451
26128.48125.9011251397012.57887486029903
27132.44130.3996036523022.04039634769824
28128.04127.5800569646790.459943035320896
29116.35116.935592592290-0.585592592290121
30120.93123.137876233190-2.20787623319043
31118.59121.207135823945-2.6171358239449
32133.1137.168722113519-4.06872211351877
33121.05122.458902245849-1.40890224584852
34127.62125.9406998831831.67930011681706
35135.44134.3429515562771.09704844372256
36114.88113.7719941956321.10800580436833
37114.34115.746557427993-1.40655742799279
38128.85128.902978422081-0.0529784220806831
39138.9138.953452723380-0.0534527233804785
40129.44128.5045437414990.935456258500719
41114.96116.557924393677-1.59792439367745
42127.98128.914427432180-0.934427432179746
43127.03128.710294744851-1.68029474485127
44128.75132.160783041184-3.41078304118390
45137.91136.5095153480561.40048465194426
46128.37128.1590683366280.210931663372300
47135.9136.502362932546-0.602362932546049
48122.19121.0599035230781.13009647692215
49113.08110.4324390573152.64756094268512
50136.2135.1698580971631.03014190283722
51138134.8555631832783.14443681672186
52115.24115.841750544626-0.601750544626329
53110.95109.2848144625931.66518553740691
5499.23103.253926947868-4.02392694786806
55102.39100.4953602930131.8946397069874
56112.67113.466407718423-0.796407718422687


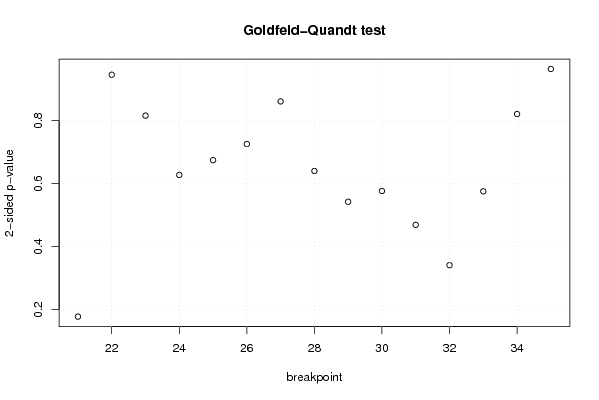
Goldfeld-Quandt test for Heteroskedasticity
p-valuesAlternative Hypothesis
breakpoint indexgreater2-sidedless
210.08865739842287380.1773147968457480.911342601577126
220.4730560233916120.9461120467832240.526943976608388
230.408028950755940.816057901511880.59197104924406
240.3138279546400740.6276559092801470.686172045359926
250.3373428930365470.6746857860730940.662657106963453
260.3629823196720240.7259646393440480.637017680327976
270.4306655558252490.8613311116504980.569334444174751
280.3200595229039590.6401190458079180.679940477096041
290.2711752881939830.5423505763879650.728824711806017
300.7116316220496530.5767367559006940.288368377950347
310.7654771873322510.4690456253354990.234522812667749
320.8295407497182750.340918500563450.170459250281725
330.7122160006438090.5755679987123820.287783999356191
340.5894220726878870.8211558546242260.410577927312113
350.5177773709326390.9644452581347210.482222629067361

\begin{tabular}{lllllllll}
\hline
Goldfeld-Quandt test for Heteroskedasticity \tabularnewline
p-values & Alternative Hypothesis \tabularnewline
breakpoint index & greater & 2-sided & less \tabularnewline
21 & 0.0886573984228738 & 0.177314796845748 & 0.911342601577126 \tabularnewline
22 & 0.473056023391612 & 0.946112046783224 & 0.526943976608388 \tabularnewline
23 & 0.40802895075594 & 0.81605790151188 & 0.59197104924406 \tabularnewline
24 & 0.313827954640074 & 0.627655909280147 & 0.686172045359926 \tabularnewline
25 & 0.337342893036547 & 0.674685786073094 & 0.662657106963453 \tabularnewline
26 & 0.362982319672024 & 0.725964639344048 & 0.637017680327976 \tabularnewline
27 & 0.430665555825249 & 0.861331111650498 & 0.569334444174751 \tabularnewline
28 & 0.320059522903959 & 0.640119045807918 & 0.679940477096041 \tabularnewline
29 & 0.271175288193983 & 0.542350576387965 & 0.728824711806017 \tabularnewline
30 & 0.711631622049653 & 0.576736755900694 & 0.288368377950347 \tabularnewline
31 & 0.765477187332251 & 0.469045625335499 & 0.234522812667749 \tabularnewline
32 & 0.829540749718275 & 0.34091850056345 & 0.170459250281725 \tabularnewline
33 & 0.712216000643809 & 0.575567998712382 & 0.287783999356191 \tabularnewline
34 & 0.589422072687887 & 0.821155854624226 & 0.410577927312113 \tabularnewline
35 & 0.517777370932639 & 0.964445258134721 & 0.482222629067361 \tabularnewline
\hline
\end{tabular}
%Source: https://freestatistics.org/blog/index.php?pk=57922&T=5

[TABLE]
[ROW][C]Goldfeld-Quandt test for Heteroskedasticity[/C][/ROW]
[ROW][C]p-values[/C][C]Alternative Hypothesis[/C][/ROW]
[ROW][C]breakpoint index[/C][C]greater[/C][C]2-sided[/C][C]less[/C][/ROW]
[ROW][C]21[/C][C]0.0886573984228738[/C][C]0.177314796845748[/C][C]0.911342601577126[/C][/ROW]
[ROW][C]22[/C][C]0.473056023391612[/C][C]0.946112046783224[/C][C]0.526943976608388[/C][/ROW]
[ROW][C]23[/C][C]0.40802895075594[/C][C]0.81605790151188[/C][C]0.59197104924406[/C][/ROW]
[ROW][C]24[/C][C]0.313827954640074[/C][C]0.627655909280147[/C][C]0.686172045359926[/C][/ROW]
[ROW][C]25[/C][C]0.337342893036547[/C][C]0.674685786073094[/C][C]0.662657106963453[/C][/ROW]
[ROW][C]26[/C][C]0.362982319672024[/C][C]0.725964639344048[/C][C]0.637017680327976[/C][/ROW]
[ROW][C]27[/C][C]0.430665555825249[/C][C]0.861331111650498[/C][C]0.569334444174751[/C][/ROW]
[ROW][C]28[/C][C]0.320059522903959[/C][C]0.640119045807918[/C][C]0.679940477096041[/C][/ROW]
[ROW][C]29[/C][C]0.271175288193983[/C][C]0.542350576387965[/C][C]0.728824711806017[/C][/ROW]
[ROW][C]30[/C][C]0.711631622049653[/C][C]0.576736755900694[/C][C]0.288368377950347[/C][/ROW]
[ROW][C]31[/C][C]0.765477187332251[/C][C]0.469045625335499[/C][C]0.234522812667749[/C][/ROW]
[ROW][C]32[/C][C]0.829540749718275[/C][C]0.34091850056345[/C][C]0.170459250281725[/C][/ROW]
[ROW][C]33[/C][C]0.712216000643809[/C][C]0.575567998712382[/C][C]0.287783999356191[/C][/ROW]
[ROW][C]34[/C][C]0.589422072687887[/C][C]0.821155854624226[/C][C]0.410577927312113[/C][/ROW]
[ROW][C]35[/C][C]0.517777370932639[/C][C]0.964445258134721[/C][C]0.482222629067361[/C][/ROW]
[/TABLE]
Source: https://freestatistics.org/blog/index.php?pk=57922&T=5

Globally Unique Identifier (entire table): ba.freestatistics.org/blog/index.php?pk=57922&T=5

As an alternative you can also use a QR Code:  

The GUIDs for individual cells are displayed in the table below:

Goldfeld-Quandt test for Heteroskedasticity
p-valuesAlternative Hypothesis
breakpoint indexgreater2-sidedless
210.08865739842287380.1773147968457480.911342601577126
220.4730560233916120.9461120467832240.526943976608388
230.408028950755940.816057901511880.59197104924406
240.3138279546400740.6276559092801470.686172045359926
250.3373428930365470.6746857860730940.662657106963453
260.3629823196720240.7259646393440480.637017680327976
270.4306655558252490.8613311116504980.569334444174751
280.3200595229039590.6401190458079180.679940477096041
290.2711752881939830.5423505763879650.728824711806017
300.7116316220496530.5767367559006940.288368377950347
310.7654771873322510.4690456253354990.234522812667749
320.8295407497182750.340918500563450.170459250281725
330.7122160006438090.5755679987123820.287783999356191
340.5894220726878870.8211558546242260.410577927312113
350.5177773709326390.9644452581347210.482222629067361


Meta Analysis of Goldfeld-Quandt test for Heteroskedasticity
Description# significant tests% significant testsOK/NOK
1% type I error level00OK
5% type I error level00OK
10% type I error level00OK

\begin{tabular}{lllllllll}
\hline
Meta Analysis of Goldfeld-Quandt test for Heteroskedasticity \tabularnewline
Description & # significant tests & % significant tests & OK/NOK \tabularnewline
1% type I error level & 0 & 0 & OK \tabularnewline
5% type I error level & 0 & 0 & OK \tabularnewline
10% type I error level & 0 & 0 & OK \tabularnewline
\hline
\end{tabular}
%Source: https://freestatistics.org/blog/index.php?pk=57922&T=6

[TABLE]
[ROW][C]Meta Analysis of Goldfeld-Quandt test for Heteroskedasticity[/C][/ROW]
[ROW][C]Description[/C][C]# significant tests[/C][C]% significant tests[/C][C]OK/NOK[/C][/ROW]
[ROW][C]1% type I error level[/C][C]0[/C][C]0[/C][C]OK[/C][/ROW]
[ROW][C]5% type I error level[/C][C]0[/C][C]0[/C][C]OK[/C][/ROW]
[ROW][C]10% type I error level[/C][C]0[/C][C]0[/C][C]OK[/C][/ROW]
[/TABLE]
Source: https://freestatistics.org/blog/index.php?pk=57922&T=6

Globally Unique Identifier (entire table): ba.freestatistics.org/blog/index.php?pk=57922&T=6

As an alternative you can also use a QR Code:  

The GUIDs for individual cells are displayed in the table below:

Meta Analysis of Goldfeld-Quandt test for Heteroskedasticity
Description# significant tests% significant testsOK/NOK
1% type I error level00OK
5% type I error level00OK
10% type I error level00OK


Parameters (Session):
par1 = 1 ; par2 = Include Monthly Dummies ; par3 = Linear Trend ;
Parameters (R input):
par1 = 1 ; par2 = Include Monthly Dummies ; par3 = Linear Trend ;
R code (references can be found in the software module):
library(lattice)
library(lmtest)
n25 <- 25 #minimum number of obs. for Goldfeld-Quandt test
par1 <- as.numeric(par1)
x <- t(y)
k <- length(x[1,])
n <- length(x[,1])
x1 <- cbind(x[,par1], x[,1:k!=par1])
mycolnames <- c(colnames(x)[par1], colnames(x)[1:k!=par1])
colnames(x1) <- mycolnames #colnames(x)[par1]
x <- x1
if (par3 == 'First Differences'){
x2 <- array(0, dim=c(n-1,k), dimnames=list(1:(n-1), paste('(1-B)',colnames(x),sep='')))
for (i in 1:n-1) {
for (j in 1:k) {
x2[i,j] <- x[i+1,j] - x[i,j]
}
}
x <- x2
}
if (par2 == 'Include Monthly Dummies'){
x2 <- array(0, dim=c(n,11), dimnames=list(1:n, paste('M', seq(1:11), sep ='')))
for (i in 1:11){
x2[seq(i,n,12),i] <- 1
}
x <- cbind(x, x2)
}
if (par2 == 'Include Quarterly Dummies'){
x2 <- array(0, dim=c(n,3), dimnames=list(1:n, paste('Q', seq(1:3), sep ='')))
for (i in 1:3){
x2[seq(i,n,4),i] <- 1
}
x <- cbind(x, x2)
}
k <- length(x[1,])
if (par3 == 'Linear Trend'){
x <- cbind(x, c(1:n))
colnames(x)[k+1] <- 't'
}
x
k <- length(x[1,])
df <- as.data.frame(x)
(mylm <- lm(df))
(mysum <- summary(mylm))
if (n > n25) {
kp3 <- k + 3
nmkm3 <- n - k - 3
gqarr <- array(NA, dim=c(nmkm3-kp3+1,3))
numgqtests <- 0
numsignificant1 <- 0
numsignificant5 <- 0
numsignificant10 <- 0
for (mypoint in kp3:nmkm3) {
j <- 0
numgqtests <- numgqtests + 1
for (myalt in c('greater', 'two.sided', 'less')) {
j <- j + 1
gqarr[mypoint-kp3+1,j] <- gqtest(mylm, point=mypoint, alternative=myalt)$p.value
}
if (gqarr[mypoint-kp3+1,2] < 0.01) numsignificant1 <- numsignificant1 + 1
if (gqarr[mypoint-kp3+1,2] < 0.05) numsignificant5 <- numsignificant5 + 1
if (gqarr[mypoint-kp3+1,2] < 0.10) numsignificant10 <- numsignificant10 + 1
}
gqarr
}
bitmap(file='test0.png')
plot(x[,1], type='l', main='Actuals and Interpolation', ylab='value of Actuals and Interpolation (dots)', xlab='time or index')
points(x[,1]-mysum$resid)
grid()
dev.off()
bitmap(file='test1.png')
plot(mysum$resid, type='b', pch=19, main='Residuals', ylab='value of Residuals', xlab='time or index')
grid()
dev.off()
bitmap(file='test2.png')
hist(mysum$resid, main='Residual Histogram', xlab='values of Residuals')
grid()
dev.off()
bitmap(file='test3.png')
densityplot(~mysum$resid,col='black',main='Residual Density Plot', xlab='values of Residuals')
dev.off()
bitmap(file='test4.png')
qqnorm(mysum$resid, main='Residual Normal Q-Q Plot')
qqline(mysum$resid)
grid()
dev.off()
(myerror <- as.ts(mysum$resid))
bitmap(file='test5.png')
dum <- cbind(lag(myerror,k=1),myerror)
dum
dum1 <- dum[2:length(myerror),]
dum1
z <- as.data.frame(dum1)
z
plot(z,main=paste('Residual Lag plot, lowess, and regression line'), ylab='values of Residuals', xlab='lagged values of Residuals')
lines(lowess(z))
abline(lm(z))
grid()
dev.off()
bitmap(file='test6.png')
acf(mysum$resid, lag.max=length(mysum$resid)/2, main='Residual Autocorrelation Function')
grid()
dev.off()
bitmap(file='test7.png')
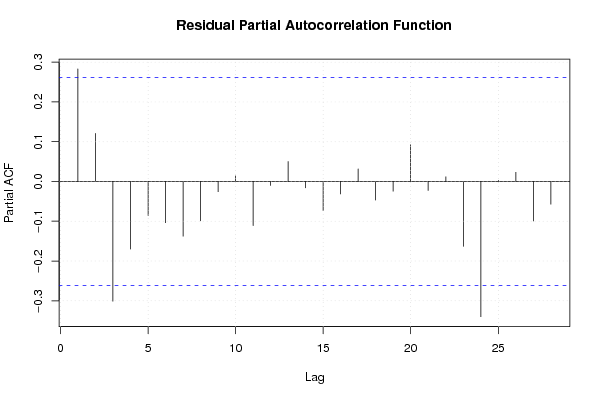
pacf(mysum$resid, lag.max=length(mysum$resid)/2, main='Residual Partial Autocorrelation Function')
grid()
dev.off()
bitmap(file='test8.png')
opar <- par(mfrow = c(2,2), oma = c(0, 0, 1.1, 0))
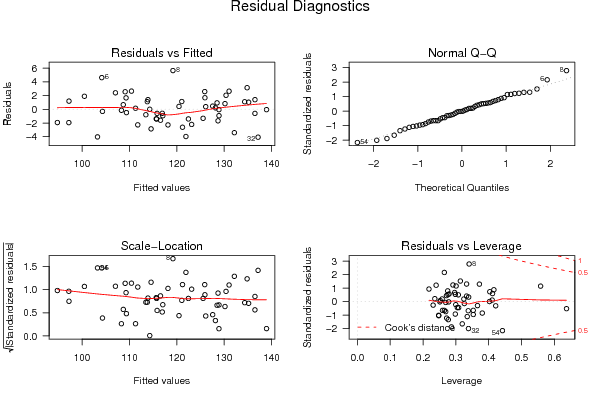
plot(mylm, las = 1, sub='Residual Diagnostics')
par(opar)
dev.off()
if (n > n25) {
bitmap(file='test9.png')
plot(kp3:nmkm3,gqarr[,2], main='Goldfeld-Quandt test',ylab='2-sided p-value',xlab='breakpoint')
grid()
dev.off()
}
load(file='createtable')
a<-table.start()
a<-table.row.start(a)
a<-table.element(a, 'Multiple Linear Regression - Estimated Regression Equation', 1, TRUE)
a<-table.row.end(a)
myeq <- colnames(x)[1]
myeq <- paste(myeq, '[t] = ', sep='')
for (i in 1:k){
if (mysum$coefficients[i,1] > 0) myeq <- paste(myeq, '+', '')
myeq <- paste(myeq, mysum$coefficients[i,1], sep=' ')
if (rownames(mysum$coefficients)[i] != '(Intercept)') {
myeq <- paste(myeq, rownames(mysum$coefficients)[i], sep='')
if (rownames(mysum$coefficients)[i] != 't') myeq <- paste(myeq, '[t]', sep='')
}
}
myeq <- paste(myeq, ' + e[t]')
a<-table.row.start(a)
a<-table.element(a, myeq)
a<-table.row.end(a)
a<-table.end(a)
table.save(a,file='mytable1.tab')
a<-table.start()
a<-table.row.start(a)
a<-table.element(a,hyperlink('ols1.htm','Multiple Linear Regression - Ordinary Least Squares',''), 6, TRUE)
a<-table.row.end(a)
a<-table.row.start(a)
a<-table.element(a,'Variable',header=TRUE)
a<-table.element(a,'Parameter',header=TRUE)
a<-table.element(a,'S.D.',header=TRUE)
a<-table.element(a,'T-STAT
H0: parameter = 0',header=TRUE)
a<-table.element(a,'2-tail p-value',header=TRUE)
a<-table.element(a,'1-tail p-value',header=TRUE)
a<-table.row.end(a)
for (i in 1:k){
a<-table.row.start(a)
a<-table.element(a,rownames(mysum$coefficients)[i],header=TRUE)
a<-table.element(a,mysum$coefficients[i,1])
a<-table.element(a, round(mysum$coefficients[i,2],6))
a<-table.element(a, round(mysum$coefficients[i,3],4))
a<-table.element(a, round(mysum$coefficients[i,4],6))
a<-table.element(a, round(mysum$coefficients[i,4]/2,6))
a<-table.row.end(a)
}
a<-table.end(a)
table.save(a,file='mytable2.tab')
a<-table.start()
a<-table.row.start(a)
a<-table.element(a, 'Multiple Linear Regression - Regression Statistics', 2, TRUE)
a<-table.row.end(a)
a<-table.row.start(a)
a<-table.element(a, 'Multiple R',1,TRUE)
a<-table.element(a, sqrt(mysum$r.squared))
a<-table.row.end(a)
a<-table.row.start(a)
a<-table.element(a, 'R-squared',1,TRUE)
a<-table.element(a, mysum$r.squared)
a<-table.row.end(a)
a<-table.row.start(a)
a<-table.element(a, 'Adjusted R-squared',1,TRUE)
a<-table.element(a, mysum$adj.r.squared)
a<-table.row.end(a)
a<-table.row.start(a)
a<-table.element(a, 'F-TEST (value)',1,TRUE)
a<-table.element(a, mysum$fstatistic[1])
a<-table.row.end(a)
a<-table.row.start(a)
a<-table.element(a, 'F-TEST (DF numerator)',1,TRUE)
a<-table.element(a, mysum$fstatistic[2])
a<-table.row.end(a)
a<-table.row.start(a)
a<-table.element(a, 'F-TEST (DF denominator)',1,TRUE)
a<-table.element(a, mysum$fstatistic[3])
a<-table.row.end(a)
a<-table.row.start(a)
a<-table.element(a, 'p-value',1,TRUE)
a<-table.element(a, 1-pf(mysum$fstatistic[1],mysum$fstatistic[2],mysum$fstatistic[3]))
a<-table.row.end(a)
a<-table.row.start(a)
a<-table.element(a, 'Multiple Linear Regression - Residual Statistics', 2, TRUE)
a<-table.row.end(a)
a<-table.row.start(a)
a<-table.element(a, 'Residual Standard Deviation',1,TRUE)
a<-table.element(a, mysum$sigma)
a<-table.row.end(a)
a<-table.row.start(a)
a<-table.element(a, 'Sum Squared Residuals',1,TRUE)
a<-table.element(a, sum(myerror*myerror))
a<-table.row.end(a)
a<-table.end(a)
table.save(a,file='mytable3.tab')
a<-table.start()
a<-table.row.start(a)
a<-table.element(a, 'Multiple Linear Regression - Actuals, Interpolation, and Residuals', 4, TRUE)
a<-table.row.end(a)
a<-table.row.start(a)
a<-table.element(a, 'Time or Index', 1, TRUE)
a<-table.element(a, 'Actuals', 1, TRUE)
a<-table.element(a, 'Interpolation
Forecast', 1, TRUE)
a<-table.element(a, 'Residuals
Prediction Error', 1, TRUE)
a<-table.row.end(a)
for (i in 1:n) {
a<-table.row.start(a)
a<-table.element(a,i, 1, TRUE)
a<-table.element(a,x[i])
a<-table.element(a,x[i]-mysum$resid[i])
a<-table.element(a,mysum$resid[i])
a<-table.row.end(a)
}
a<-table.end(a)
table.save(a,file='mytable4.tab')
if (n > n25) {
a<-table.start()
a<-table.row.start(a)
a<-table.element(a,'Goldfeld-Quandt test for Heteroskedasticity',4,TRUE)
a<-table.row.end(a)
a<-table.row.start(a)
a<-table.element(a,'p-values',header=TRUE)
a<-table.element(a,'Alternative Hypothesis',3,header=TRUE)
a<-table.row.end(a)
a<-table.row.start(a)
a<-table.element(a,'breakpoint index',header=TRUE)
a<-table.element(a,'greater',header=TRUE)
a<-table.element(a,'2-sided',header=TRUE)
a<-table.element(a,'less',header=TRUE)
a<-table.row.end(a)
for (mypoint in kp3:nmkm3) {
a<-table.row.start(a)
a<-table.element(a,mypoint,header=TRUE)
a<-table.element(a,gqarr[mypoint-kp3+1,1])
a<-table.element(a,gqarr[mypoint-kp3+1,2])
a<-table.element(a,gqarr[mypoint-kp3+1,3])
a<-table.row.end(a)
}
a<-table.end(a)
table.save(a,file='mytable5.tab')
a<-table.start()
a<-table.row.start(a)
a<-table.element(a,'Meta Analysis of Goldfeld-Quandt test for Heteroskedasticity',4,TRUE)
a<-table.row.end(a)
a<-table.row.start(a)
a<-table.element(a,'Description',header=TRUE)
a<-table.element(a,'# significant tests',header=TRUE)
a<-table.element(a,'% significant tests',header=TRUE)
a<-table.element(a,'OK/NOK',header=TRUE)
a<-table.row.end(a)
a<-table.row.start(a)
a<-table.element(a,'1% type I error level',header=TRUE)
a<-table.element(a,numsignificant1)
a<-table.element(a,numsignificant1/numgqtests)
if (numsignificant1/numgqtests < 0.01) dum <- 'OK' else dum <- 'NOK'
a<-table.element(a,dum)
a<-table.row.end(a)
a<-table.row.start(a)
a<-table.element(a,'5% type I error level',header=TRUE)
a<-table.element(a,numsignificant5)
a<-table.element(a,numsignificant5/numgqtests)
if (numsignificant5/numgqtests < 0.05) dum <- 'OK' else dum <- 'NOK'
a<-table.element(a,dum)
a<-table.row.end(a)
a<-table.row.start(a)
a<-table.element(a,'10% type I error level',header=TRUE)
a<-table.element(a,numsignificant10)
a<-table.element(a,numsignificant10/numgqtests)
if (numsignificant10/numgqtests < 0.1) dum <- 'OK' else dum <- 'NOK'
a<-table.element(a,dum)
a<-table.row.end(a)
a<-table.end(a)
table.save(a,file='mytable6.tab')
}