| Multiple Linear Regression - Estimated Regression Equation |
| Y[t] = + 19.5447097642314 + 0.474153907672798totid[t] -0.087206661204238ndzcg[t] + 0.0461297131404523indc[t] + 0.163565208603853y1[t] + 0.115836079954216y2[t] -0.0837072924607436`y3 `[t] + 1.37117081963841M1[t] + 1.77995473905426M2[t] + 2.41301826429556M3[t] + 2.28548228718490M4[t] + 2.58505687122945M5[t] + 4.83378346325529M6[t] + 3.70223862569186M7[t] + 3.24366895236396M8[t] + 4.85075294798024M9[t] + 4.14558329093348M10[t] + 3.09304594699270M11[t] -0.158704064647780t + e[t] |
| Multiple Linear Regression - Ordinary Least Squares | |||||
| Variable | Parameter | S.D. | T-STAT H0: parameter = 0 | 2-tail p-value | 1-tail p-value |
| (Intercept) | 19.5447097642314 | 18.446578 | 1.0595 | 0.295876 | 0.147938 |
| totid | 0.474153907672798 | 0.184449 | 2.5707 | 0.014082 | 0.007041 |
| ndzcg | -0.087206661204238 | 0.2114 | -0.4125 | 0.682218 | 0.341109 |
| indc | 0.0461297131404523 | 0.079521 | 0.5801 | 0.565188 | 0.282594 |
| y1 | 0.163565208603853 | 0.158225 | 1.0338 | 0.307619 | 0.15381 |
| y2 | 0.115836079954216 | 0.148703 | 0.779 | 0.440696 | 0.220348 |
| `y3 ` | -0.0837072924607436 | 0.144047 | -0.5811 | 0.564509 | 0.282254 |
| M1 | 1.37117081963841 | 2.058699 | 0.666 | 0.509308 | 0.254654 |
| M2 | 1.77995473905426 | 2.13776 | 0.8326 | 0.410126 | 0.205063 |
| M3 | 2.41301826429556 | 2.175475 | 1.1092 | 0.274141 | 0.13707 |
| M4 | 2.28548228718490 | 2.145102 | 1.0654 | 0.293228 | 0.146614 |
| M5 | 2.58505687122945 | 2.081456 | 1.2419 | 0.221673 | 0.110837 |
| M6 | 4.83378346325529 | 2.072542 | 2.3323 | 0.02494 | 0.01247 |
| M7 | 3.70223862569186 | 2.094088 | 1.7679 | 0.084892 | 0.042446 |
| M8 | 3.24366895236396 | 2.091477 | 1.5509 | 0.129004 | 0.064502 |
| M9 | 4.85075294798024 | 2.0226 | 2.3983 | 0.021355 | 0.010677 |
| M10 | 4.14558329093348 | 2.060549 | 2.0119 | 0.051177 | 0.025589 |
| M11 | 3.09304594699270 | 2.13337 | 1.4498 | 0.155098 | 0.077549 |
| t | -0.158704064647780 | 0.052286 | -3.0353 | 0.004265 | 0.002133 |
| Multiple Linear Regression - Regression Statistics | |
| Multiple R | 0.900418032880322 |
| R-squared | 0.810752633936068 |
| Adjusted R-squared | 0.723407695752715 |
| F-TEST (value) | 9.28219368859303 |
| F-TEST (DF numerator) | 18 |
| F-TEST (DF denominator) | 39 |
| p-value | 4.30708124721235e-09 |
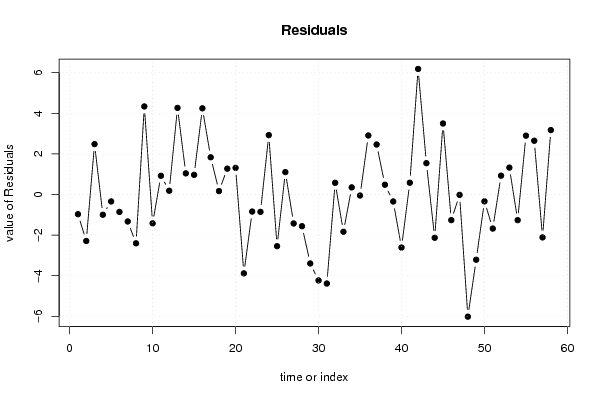
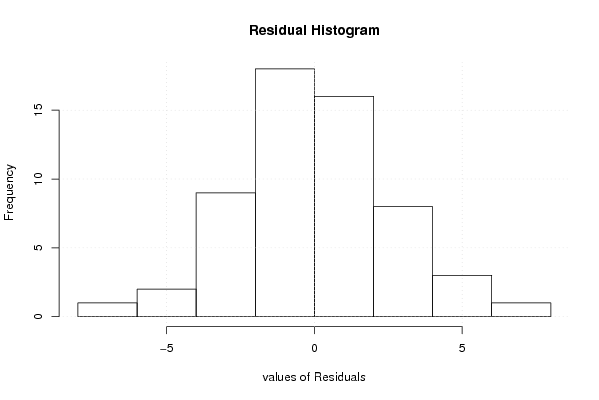
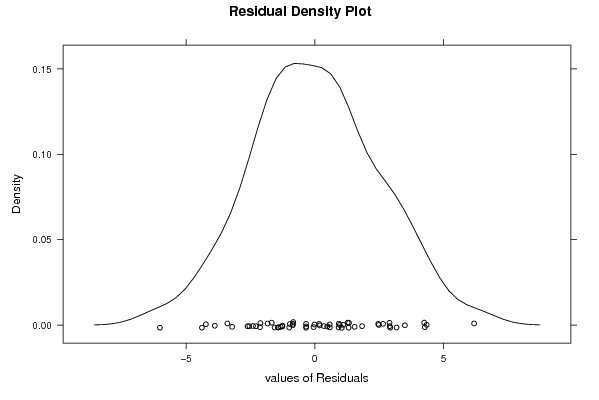
| Multiple Linear Regression - Residual Statistics | |
| Residual Standard Deviation | 2.9653736316565 |
| Sum Squared Residuals | 342.944190237623 |
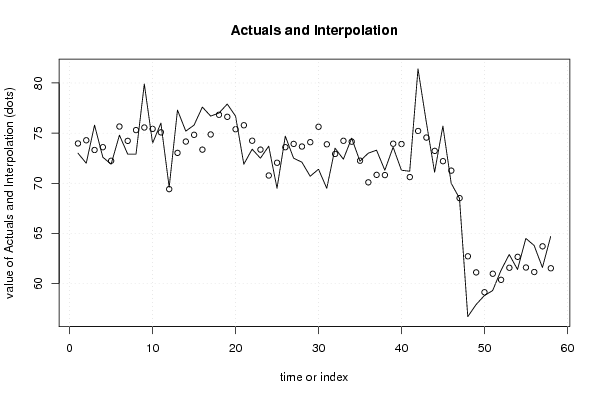
| Multiple Linear Regression - Actuals, Interpolation, and Residuals | |||
| Time or Index | Actuals | Interpolation Forecast | Residuals Prediction Error |
| 1 | 73 | 73.9698574161942 | -0.969857416194245 |
| 2 | 72 | 74.2893464271969 | -2.28934642719692 |
| 3 | 75.8 | 73.3186625785146 | 2.48133742148541 |
| 4 | 72.6 | 73.5972044331523 | -0.99720443315227 |
| 5 | 71.9 | 72.241504968797 | -0.341504968797058 |
| 6 | 74.8 | 75.6575750843153 | -0.857575084315297 |
| 7 | 72.9 | 74.2289092984581 | -1.32890929845814 |
| 8 | 72.9 | 75.3046000406006 | -2.40460004060062 |
| 9 | 79.9 | 75.561702182322 | 4.33829781767805 |
| 10 | 74 | 75.4213179613963 | -1.42131796139633 |
| 11 | 76 | 75.0768721722453 | 0.923127827754687 |
| 12 | 69.6 | 69.4149505321 | 0.185049467900048 |
| 13 | 77.3 | 73.0314606676266 | 4.26853933237341 |
| 14 | 75.2 | 74.1589458684483 | 1.04105413155168 |
| 15 | 75.8 | 74.8318319669672 | 0.968168033032772 |
| 16 | 77.6 | 73.3540669343484 | 4.24593306565155 |
| 17 | 76.7 | 74.8661471506606 | 1.83385284933938 |
| 18 | 77 | 76.8307664336278 | 0.169233566372159 |
| 19 | 77.9 | 76.6263132268217 | 1.27368677317832 |
| 20 | 76.7 | 75.3877930774082 | 1.31220692259180 |
| 21 | 71.9 | 75.7854530447928 | -3.88545304479284 |
| 22 | 73.4 | 74.2406932441782 | -0.840693244178151 |
| 23 | 72.5 | 73.3546229180205 | -0.854622918020528 |
| 24 | 73.7 | 70.773856243112 | 2.92614375688805 |
| 25 | 69.5 | 72.0457205734595 | -2.54572057345952 |
| 26 | 74.7 | 73.597314452583 | 1.10268554741705 |
| 27 | 72.5 | 73.9274303359548 | -1.42743033595479 |
| 28 | 72.1 | 73.6624233572771 | -1.56242335727708 |
| 29 | 70.7 | 74.0974166679575 | -3.39741666795754 |
| 30 | 71.4 | 75.6332184965867 | -4.2332184965867 |
| 31 | 69.5 | 73.8860726057638 | -4.38607260576378 |
| 32 | 73.5 | 72.9243212208094 | 0.575678779190643 |
| 33 | 72.4 | 74.2354296972381 | -1.83542969723809 |
| 34 | 74.5 | 74.149553085271 | 0.350446914729022 |
| 35 | 72.2 | 72.250321722223 | -0.0503217222230579 |
| 36 | 73 | 70.0932477026869 | 2.90675229731315 |
| 37 | 73.3 | 70.8388611457942 | 2.46113885420577 |
| 38 | 71.3 | 70.8176749047772 | 0.482325095222791 |
| 39 | 73.6 | 73.9438274633004 | -0.343827463300385 |
| 40 | 71.3 | 73.9145747245828 | -2.61457472458277 |
| 41 | 71.2 | 70.6200221207626 | 0.579977879237361 |
| 42 | 81.4 | 75.2146104322073 | 6.18538956779272 |
| 43 | 76.1 | 74.5571219900001 | 1.54287800999987 |
| 44 | 71.1 | 73.2312931339398 | -2.13129313393983 |
| 45 | 75.7 | 72.2029650424995 | 3.49703495750055 |
| 46 | 70 | 71.2621157876944 | -1.26211578769439 |
| 47 | 68.5 | 68.5181831875111 | -0.0181831875111015 |
| 48 | 56.7 | 62.7179455221013 | -6.01794552210127 |
| 49 | 57.9 | 61.1141001969254 | -3.21410019692541 |
| 50 | 58.8 | 59.1367183469946 | -0.336718346994596 |
| 51 | 59.3 | 60.978247655263 | -1.67824765526301 |
| 52 | 61.3 | 60.3717305506394 | 0.92826944936056 |
| 53 | 62.9 | 61.5749090918221 | 1.32509090817785 |
| 54 | 61.4 | 62.6638295532629 | -1.26382955326288 |
| 55 | 64.5 | 61.6015828789563 | 2.89841712104373 |
| 56 | 63.8 | 61.151992527242 | 2.64800747275801 |
| 57 | 61.6 | 63.7144500331477 | -2.11445003314766 |
| 58 | 64.7 | 61.5263199214601 | 3.17368007853985 |
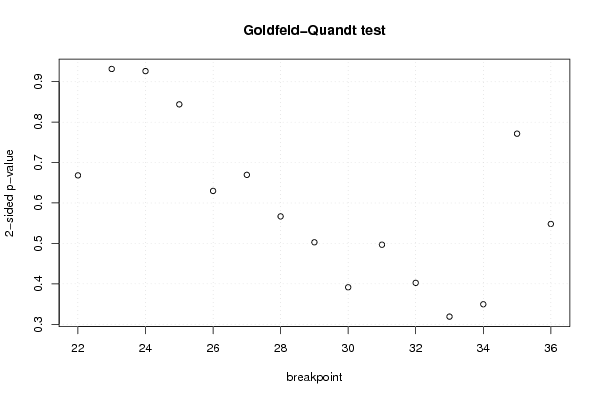
| Goldfeld-Quandt test for Heteroskedasticity | |||
| p-values | Alternative Hypothesis | ||
| breakpoint index | greater | 2-sided | less |
| 22 | 0.665854023285714 | 0.668291953428572 | 0.334145976714286 |
| 23 | 0.534210096213425 | 0.93157980757315 | 0.465789903786575 |
| 24 | 0.463126610737488 | 0.926253221474975 | 0.536873389262512 |
| 25 | 0.422005942714747 | 0.844011885429494 | 0.577994057285253 |
| 26 | 0.314905449707632 | 0.629810899415263 | 0.685094550292368 |
| 27 | 0.334823666270497 | 0.669647332540993 | 0.665176333729503 |
| 28 | 0.283442596682463 | 0.566885193364925 | 0.716557403317537 |
| 29 | 0.251386965553277 | 0.502773931106555 | 0.748613034446723 |
| 30 | 0.195758530524326 | 0.391517061048653 | 0.804241469475674 |
| 31 | 0.248388918640582 | 0.496777837281165 | 0.751611081359418 |
| 32 | 0.201234190110752 | 0.402468380221503 | 0.798765809889249 |
| 33 | 0.159425690536585 | 0.318851381073171 | 0.840574309463414 |
| 34 | 0.174751971165059 | 0.349503942330118 | 0.825248028834941 |
| 35 | 0.385718076499658 | 0.771436152999317 | 0.614281923500342 |
| 36 | 0.274070415002665 | 0.548140830005331 | 0.725929584997335 |
| Meta Analysis of Goldfeld-Quandt test for Heteroskedasticity | |||
| Description | # significant tests | % significant tests | OK/NOK |
| 1% type I error level | 0 | 0 | OK |
| 5% type I error level | 0 | 0 | OK |
| 10% type I error level | 0 | 0 | OK |