| Multiple Linear Regression - Estimated Regression Equation |
| Y[t] = + 464.210309278351 -36.5257731958763X[t] -1.53505154639171M1[t] -14.3051546391753M2[t] -19.1051546391753M3[t] -25.3051546391753M4[t] -19.7051546391753M5[t] -8.80000000000004M6[t] -10.0000000000000M7[t] -14.0000000000000M8[t] -16.2000000000000M9[t] -21.2000000000000M10[t] -20.4000000000000M11[t] + e[t] |
| Multiple Linear Regression - Ordinary Least Squares | |||||
| Variable | Parameter | S.D. | T-STAT H0: parameter = 0 | 2-tail p-value | 1-tail p-value |
| (Intercept) | 464.210309278351 | 9.70414 | 47.8363 | 0 | 0 |
| X | -36.5257731958763 | 5.855367 | -6.238 | 0 | 0 |
| M1 | -1.53505154639171 | 12.756997 | -0.1203 | 0.904724 | 0.452362 |
| M2 | -14.3051546391753 | 13.369397 | -1.07 | 0.289974 | 0.144987 |
| M3 | -19.1051546391753 | 13.369397 | -1.429 | 0.159474 | 0.079737 |
| M4 | -25.3051546391753 | 13.369397 | -1.8928 | 0.064427 | 0.032214 |
| M5 | -19.7051546391753 | 13.369397 | -1.4739 | 0.147037 | 0.073519 |
| M6 | -8.80000000000004 | 13.318009 | -0.6608 | 0.511926 | 0.255963 |
| M7 | -10.0000000000000 | 13.318009 | -0.7509 | 0.456401 | 0.2282 |
| M8 | -14.0000000000000 | 13.318009 | -1.0512 | 0.298427 | 0.149213 |
| M9 | -16.2000000000000 | 13.318009 | -1.2164 | 0.229781 | 0.114891 |
| M10 | -21.2000000000000 | 13.318009 | -1.5918 | 0.117988 | 0.058994 |
| M11 | -20.4000000000000 | 13.318009 | -1.5318 | 0.132146 | 0.066073 |
| Multiple Linear Regression - Regression Statistics | |
| Multiple R | 0.697897034627074 |
| R-squared | 0.487060270941264 |
| Adjusted R-squared | 0.35882533867658 |
| F-TEST (value) | 3.79818714245463 |
| F-TEST (DF numerator) | 12 |
| F-TEST (DF denominator) | 48 |
| p-value | 0.000447445226957166 |
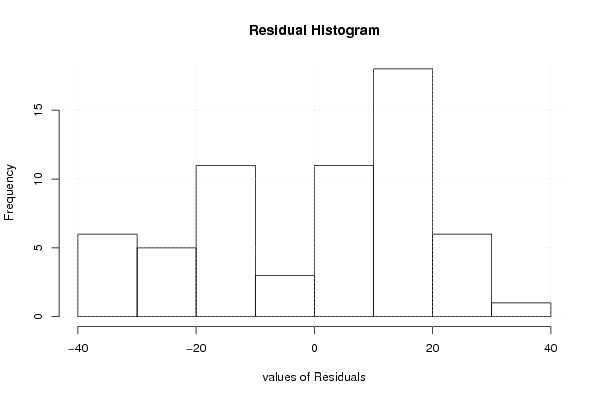
| Multiple Linear Regression - Residual Statistics | |
| Residual Standard Deviation | 21.0576217111663 |
| Sum Squared Residuals | 21284.3247422680 |
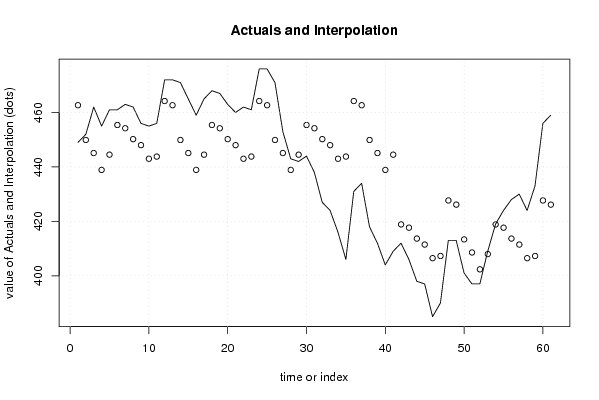
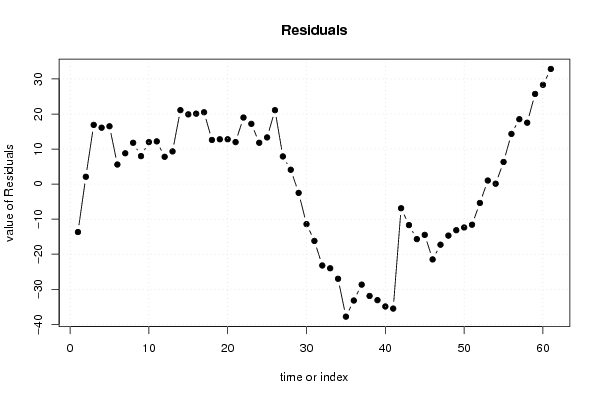
| Multiple Linear Regression - Actuals, Interpolation, and Residuals | |||
| Time or Index | Actuals | Interpolation Forecast | Residuals Prediction Error |
| 1 | 449 | 462.675257731958 | -13.6752577319584 |
| 2 | 452 | 449.905154639175 | 2.09484536082474 |
| 3 | 462 | 445.105154639175 | 16.8948453608247 |
| 4 | 455 | 438.905154639175 | 16.0948453608247 |
| 5 | 461 | 444.505154639175 | 16.4948453608247 |
| 6 | 461 | 455.410309278350 | 5.58969072164948 |
| 7 | 463 | 454.210309278351 | 8.78969072164944 |
| 8 | 462 | 450.210309278351 | 11.7896907216495 |
| 9 | 456 | 448.010309278351 | 7.98969072164949 |
| 10 | 455 | 443.010309278351 | 11.9896907216495 |
| 11 | 456 | 443.810309278351 | 12.1896907216495 |
| 12 | 472 | 464.210309278351 | 7.78969072164946 |
| 13 | 472 | 462.675257731959 | 9.32474226804115 |
| 14 | 471 | 449.905154639175 | 21.0948453608248 |
| 15 | 465 | 445.105154639175 | 19.8948453608247 |
| 16 | 459 | 438.905154639175 | 20.0948453608248 |
| 17 | 465 | 444.505154639175 | 20.4948453608247 |
| 18 | 468 | 455.410309278350 | 12.5896907216495 |
| 19 | 467 | 454.210309278351 | 12.7896907216495 |
| 20 | 463 | 450.210309278351 | 12.7896907216495 |
| 21 | 460 | 448.010309278351 | 11.9896907216495 |
| 22 | 462 | 443.010309278351 | 18.9896907216495 |
| 23 | 461 | 443.810309278351 | 17.1896907216495 |
| 24 | 476 | 464.210309278351 | 11.7896907216495 |
| 25 | 476 | 462.675257731959 | 13.3247422680412 |
| 26 | 471 | 449.905154639175 | 21.0948453608248 |
| 27 | 453 | 445.105154639175 | 7.89484536082474 |
| 28 | 443 | 438.905154639175 | 4.09484536082476 |
| 29 | 442 | 444.505154639175 | -2.50515463917525 |
| 30 | 444 | 455.410309278350 | -11.4103092783505 |
| 31 | 438 | 454.210309278351 | -16.2103092783505 |
| 32 | 427 | 450.210309278351 | -23.2103092783505 |
| 33 | 424 | 448.010309278351 | -24.0103092783505 |
| 34 | 416 | 443.010309278351 | -27.0103092783505 |
| 35 | 406 | 443.810309278351 | -37.8103092783505 |
| 36 | 431 | 464.210309278351 | -33.2103092783505 |
| 37 | 434 | 462.675257731959 | -28.6752577319588 |
| 38 | 418 | 449.905154639175 | -31.9051546391752 |
| 39 | 412 | 445.105154639175 | -33.1051546391753 |
| 40 | 404 | 438.905154639175 | -34.9051546391753 |
| 41 | 409 | 444.505154639175 | -35.5051546391753 |
| 42 | 412 | 418.884536082474 | -6.88453608247421 |
| 43 | 406 | 417.684536082474 | -11.6845360824742 |
| 44 | 398 | 413.684536082474 | -15.6845360824742 |
| 45 | 397 | 411.484536082474 | -14.4845360824742 |
| 46 | 385 | 406.484536082474 | -21.4845360824742 |
| 47 | 390 | 407.284536082474 | -17.2845360824742 |
| 48 | 413 | 427.684536082474 | -14.6845360824742 |
| 49 | 413 | 426.149484536083 | -13.1494845360825 |
| 50 | 401 | 413.379381443299 | -12.3793814432990 |
| 51 | 397 | 408.579381443299 | -11.5793814432990 |
| 52 | 397 | 402.379381443299 | -5.37938144329894 |
| 53 | 409 | 407.979381443299 | 1.02061855670105 |
| 54 | 419 | 418.884536082474 | 0.115463917525785 |
| 55 | 424 | 417.684536082474 | 6.31546391752579 |
| 56 | 428 | 413.684536082474 | 14.3154639175258 |
| 57 | 430 | 411.484536082474 | 18.5154639175258 |
| 58 | 424 | 406.484536082474 | 17.5154639175258 |
| 59 | 433 | 407.284536082474 | 25.7154639175258 |
| 60 | 456 | 427.684536082474 | 28.3154639175258 |
| 61 | 459 | 426.149484536083 | 32.8505154639175 |
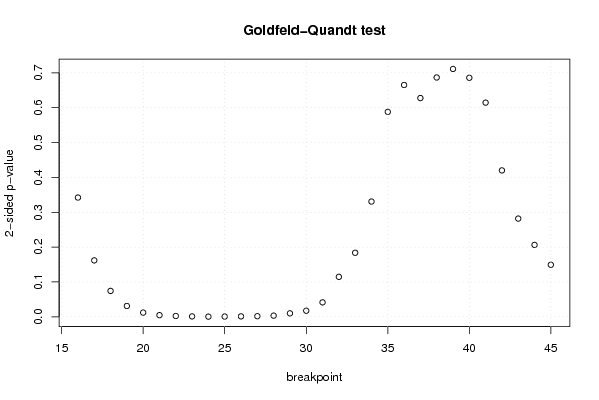
| Goldfeld-Quandt test for Heteroskedasticity | |||
| p-values | Alternative Hypothesis | ||
| breakpoint index | greater | 2-sided | less |
| 16 | 0.171119689225042 | 0.342239378450084 | 0.828880310774958 |
| 17 | 0.0809937872773374 | 0.161987574554675 | 0.919006212722663 |
| 18 | 0.0372396524716644 | 0.0744793049433289 | 0.962760347528336 |
| 19 | 0.0155662925136809 | 0.0311325850273618 | 0.984433707486319 |
| 20 | 0.00610497850661368 | 0.0122099570132274 | 0.993895021493386 |
| 21 | 0.00240693510760585 | 0.0048138702152117 | 0.997593064892394 |
| 22 | 0.00126118051161665 | 0.0025223610232333 | 0.998738819488383 |
| 23 | 0.000634685930299165 | 0.00126937186059833 | 0.9993653140697 |
| 24 | 0.000279545119564017 | 0.000559090239128033 | 0.999720454880436 |
| 25 | 0.000426639864159739 | 0.000853279728319478 | 0.99957336013584 |
| 26 | 0.000673345278685245 | 0.00134669055737049 | 0.999326654721315 |
| 27 | 0.000932206404180965 | 0.00186441280836193 | 0.999067793595819 |
| 28 | 0.00172456218898512 | 0.00344912437797023 | 0.998275437811015 |
| 29 | 0.00503253462350133 | 0.0100650692470027 | 0.994967465376499 |
| 30 | 0.00879340747973921 | 0.0175868149594784 | 0.99120659252026 |
| 31 | 0.0207874743458941 | 0.0415749486917883 | 0.979212525654106 |
| 32 | 0.057413879623699 | 0.114827759247398 | 0.9425861203763 |
| 33 | 0.0918919017417304 | 0.183783803483461 | 0.90810809825827 |
| 34 | 0.165376083083269 | 0.330752166166539 | 0.83462391691673 |
| 35 | 0.294010424901188 | 0.588020849802375 | 0.705989575098812 |
| 36 | 0.332576511405207 | 0.665153022810414 | 0.667423488594793 |
| 37 | 0.313818405133949 | 0.627636810267898 | 0.686181594866051 |
| 38 | 0.343357146095348 | 0.686714292190697 | 0.656642853904652 |
| 39 | 0.355586611322099 | 0.711173222644197 | 0.644413388677901 |
| 40 | 0.342928847491742 | 0.685857694983484 | 0.657071152508258 |
| 41 | 0.307275919099733 | 0.614551838199467 | 0.692724080900267 |
| 42 | 0.210059602105094 | 0.420119204210189 | 0.789940397894906 |
| 43 | 0.140936355948545 | 0.281872711897091 | 0.859063644051455 |
| 44 | 0.103187398181657 | 0.206374796363315 | 0.896812601818343 |
| 45 | 0.0746860518364164 | 0.149372103672833 | 0.925313948163584 |
| Meta Analysis of Goldfeld-Quandt test for Heteroskedasticity | |||
| Description | # significant tests | % significant tests | OK/NOK |
| 1% type I error level | 8 | 0.266666666666667 | NOK |
| 5% type I error level | 13 | 0.433333333333333 | NOK |
| 10% type I error level | 14 | 0.466666666666667 | NOK |