| Multiple Linear Regression - Estimated Regression Equation |
| Y[t] = + 7.63677077903145 -0.186016840579967X[t] + e[t] |
| Multiple Linear Regression - Ordinary Least Squares | |||||
| Variable | Parameter | S.D. | T-STAT H0: parameter = 0 | 2-tail p-value | 1-tail p-value |
| (Intercept) | 7.63677077903145 | 0.186913 | 40.8574 | 0 | 0 |
| X | -0.186016840579967 | 0.06694 | -2.7789 | 0.00721 | 0.003605 |
| Multiple Linear Regression - Regression Statistics | |
| Multiple R | 0.332800503518977 |
| R-squared | 0.110756175142485 |
| Adjusted R-squared | 0.0964135328060733 |
| F-TEST (value) | 7.72215973491224 |
| F-TEST (DF numerator) | 1 |
| F-TEST (DF denominator) | 62 |
| p-value | 0.00720990438056168 |
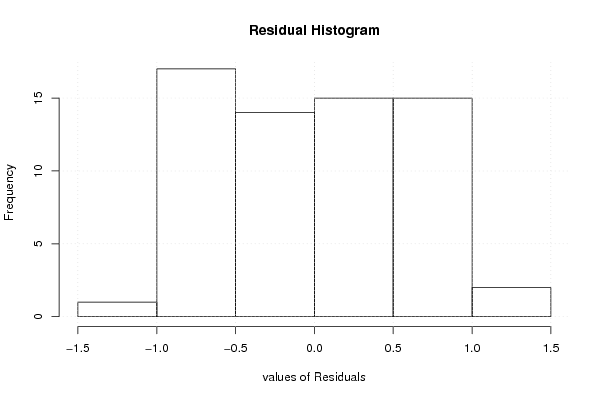
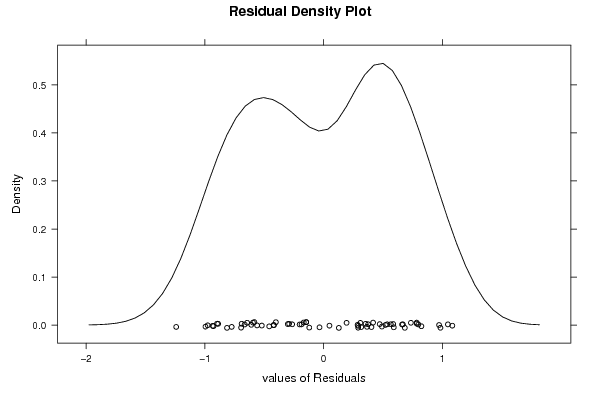
| Multiple Linear Regression - Residual Statistics | |
| Residual Standard Deviation | 0.629449386680064 |
| Sum Squared Residuals | 24.5648048842983 |
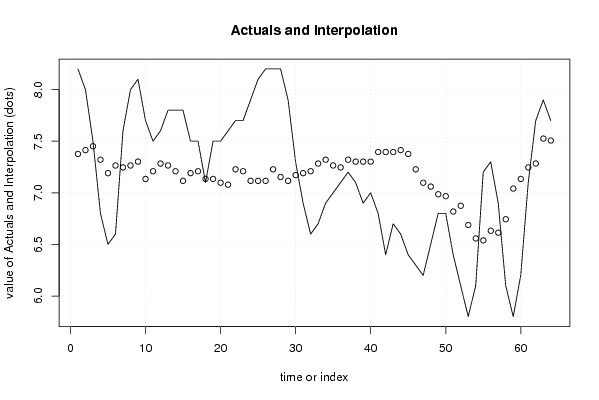
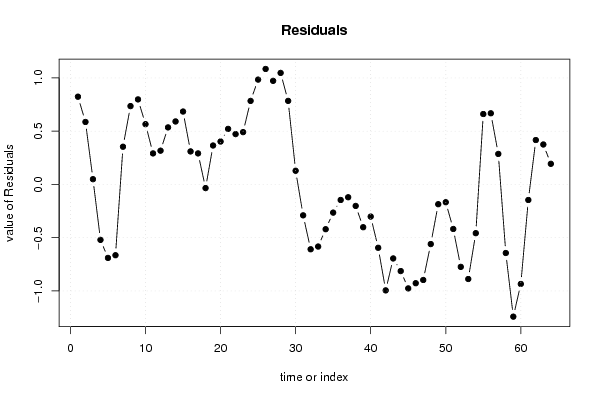
| Multiple Linear Regression - Actuals, Interpolation, and Residuals | |||
| Time or Index | Actuals | Interpolation Forecast | Residuals Prediction Error |
| 1 | 8.2 | 7.37634720221949 | 0.82365279778051 |
| 2 | 8 | 7.41355057033548 | 0.586449429664515 |
| 3 | 7.5 | 7.45075393845148 | 0.0492460615485204 |
| 4 | 6.8 | 7.3205421500455 | -0.520542150045503 |
| 5 | 6.5 | 7.19033036163953 | -0.690330361639527 |
| 6 | 6.6 | 7.26473709787151 | -0.664737097871514 |
| 7 | 7.6 | 7.24613541381352 | 0.353864586186483 |
| 8 | 8 | 7.26473709787151 | 0.735262902128487 |
| 9 | 8.1 | 7.3019404659875 | 0.798059534012493 |
| 10 | 7.7 | 7.13452530946554 | 0.565474690534463 |
| 11 | 7.5 | 7.20893204569752 | 0.291067954302477 |
| 12 | 7.6 | 7.28333878192951 | 0.316661218070490 |
| 13 | 7.8 | 7.26473709787151 | 0.535262902128486 |
| 14 | 7.8 | 7.20893204569752 | 0.591067954302476 |
| 15 | 7.8 | 7.11592362540754 | 0.68407637459246 |
| 16 | 7.5 | 7.19033036163953 | 0.309669638360473 |
| 17 | 7.5 | 7.20893204569752 | 0.291067954302477 |
| 18 | 7.1 | 7.13452530946554 | -0.0345253094655372 |
| 19 | 7.5 | 7.13452530946554 | 0.365474690534463 |
| 20 | 7.5 | 7.09732194134954 | 0.402678058650456 |
| 21 | 7.6 | 7.07872025729155 | 0.521279742708453 |
| 22 | 7.7 | 7.22753372975552 | 0.47246627024448 |
| 23 | 7.7 | 7.20893204569752 | 0.491067954302477 |
| 24 | 7.9 | 7.11592362540754 | 0.78407637459246 |
| 25 | 8.1 | 7.11592362540754 | 0.98407637459246 |
| 26 | 8.2 | 7.11592362540754 | 1.08407637459246 |
| 27 | 8.2 | 7.22753372975552 | 0.97246627024448 |
| 28 | 8.2 | 7.15312699352353 | 1.04687300647647 |
| 29 | 7.9 | 7.11592362540754 | 0.78407637459246 |
| 30 | 7.3 | 7.17172867758153 | 0.128271322418470 |
| 31 | 6.9 | 7.19033036163953 | -0.290330361639526 |
| 32 | 6.6 | 7.20893204569752 | -0.608932045697524 |
| 33 | 6.7 | 7.28333878192951 | -0.58333878192951 |
| 34 | 6.9 | 7.3205421500455 | -0.420542150045503 |
| 35 | 7 | 7.26473709787151 | -0.264737097871513 |
| 36 | 7.1 | 7.24613541381352 | -0.146135413813517 |
| 37 | 7.2 | 7.3205421500455 | -0.120542150045503 |
| 38 | 7.1 | 7.3019404659875 | -0.201940465987507 |
| 39 | 6.9 | 7.3019404659875 | -0.401940465987506 |
| 40 | 7 | 7.3019404659875 | -0.301940465987507 |
| 41 | 6.8 | 7.39494888627749 | -0.59494888627749 |
| 42 | 6.4 | 7.39494888627749 | -0.99494888627749 |
| 43 | 6.7 | 7.39494888627749 | -0.69494888627749 |
| 44 | 6.6 | 7.41355057033549 | -0.813550570335487 |
| 45 | 6.4 | 7.3763472022195 | -0.976347202219493 |
| 46 | 6.3 | 7.22753372975552 | -0.92753372975552 |
| 47 | 6.2 | 7.09732194134954 | -0.897321941349543 |
| 48 | 6.5 | 7.06011857323355 | -0.56011857323355 |
| 49 | 6.8 | 6.98571183700156 | -0.185711837001564 |
| 50 | 6.8 | 6.96711015294357 | -0.167110152943567 |
| 51 | 6.4 | 6.81829668047959 | -0.418296680479594 |
| 52 | 6.1 | 6.87410173265358 | -0.774101732653584 |
| 53 | 5.8 | 6.68808489207362 | -0.888084892073618 |
| 54 | 6.1 | 6.55787310366764 | -0.457873103667642 |
| 55 | 7.2 | 6.53927141960964 | 0.660728580390356 |
| 56 | 7.3 | 6.63227983989963 | 0.667720160100372 |
| 57 | 6.9 | 6.61367815584163 | 0.286321844158369 |
| 58 | 6.1 | 6.74388994424761 | -0.643889944247608 |
| 59 | 5.8 | 7.04151688917555 | -1.24151688917555 |
| 60 | 6.2 | 7.13452530946554 | -0.934525309465537 |
| 61 | 7.1 | 7.24613541381352 | -0.146135413813517 |
| 62 | 7.7 | 7.28333878192951 | 0.41666121807049 |
| 63 | 7.9 | 7.52516067468347 | 0.374839325316534 |
| 64 | 7.7 | 7.50655899062547 | 0.193441009374531 |
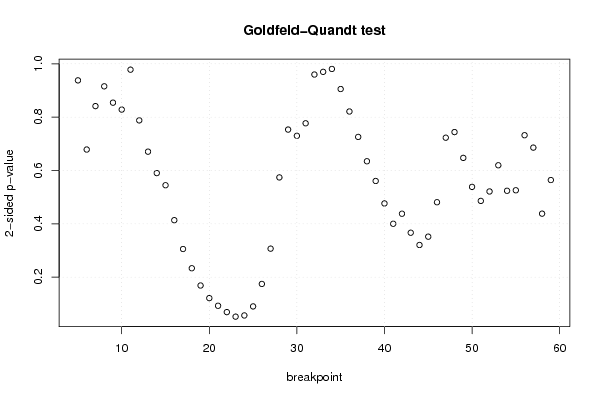
| Goldfeld-Quandt test for Heteroskedasticity | |||
| p-values | Alternative Hypothesis | ||
| breakpoint index | greater | 2-sided | less |
| 5 | 0.4689381981809 | 0.9378763963618 | 0.5310618018191 |
| 6 | 0.339243787537495 | 0.67848757507499 | 0.660756212462505 |
| 7 | 0.420654309854167 | 0.841308619708334 | 0.579345690145833 |
| 8 | 0.542221092862914 | 0.915557814274171 | 0.457778907137086 |
| 9 | 0.572877606084968 | 0.854244787830064 | 0.427122393915032 |
| 10 | 0.58584900460216 | 0.82830199079568 | 0.41415099539784 |
| 11 | 0.488956807361089 | 0.977913614722178 | 0.511043192638911 |
| 12 | 0.393937457881563 | 0.787874915763126 | 0.606062542118437 |
| 13 | 0.335256114131071 | 0.670512228262141 | 0.664743885868929 |
| 14 | 0.295101929023741 | 0.590203858047481 | 0.70489807097626 |
| 15 | 0.272330625197159 | 0.544661250394318 | 0.727669374802841 |
| 16 | 0.206810357989231 | 0.413620715978463 | 0.793189642010769 |
| 17 | 0.152748455442848 | 0.305496910885696 | 0.847251544557152 |
| 18 | 0.116697685865686 | 0.233395371731371 | 0.883302314134314 |
| 19 | 0.084330458084889 | 0.168660916169778 | 0.915669541915111 |
| 20 | 0.0606621253991418 | 0.121324250798284 | 0.939337874600858 |
| 21 | 0.0463490944084701 | 0.0926981888169401 | 0.95365090559153 |
| 22 | 0.0344640428272853 | 0.0689280856545707 | 0.965535957172715 |
| 23 | 0.0259398523606496 | 0.0518797047212992 | 0.97406014763935 |
| 24 | 0.0282085706568464 | 0.0564171413136928 | 0.971791429343154 |
| 25 | 0.0451292648498360 | 0.0902585296996719 | 0.954870735150164 |
| 26 | 0.08727143623386 | 0.17454287246772 | 0.91272856376614 |
| 27 | 0.153425396678556 | 0.306850793357111 | 0.846574603321444 |
| 28 | 0.286992247133877 | 0.573984494267753 | 0.713007752866123 |
| 29 | 0.376678344205801 | 0.753356688411603 | 0.623321655794199 |
| 30 | 0.364996058087260 | 0.729992116174519 | 0.63500394191274 |
| 31 | 0.388459882494148 | 0.776919764988296 | 0.611540117505852 |
| 32 | 0.479865100939269 | 0.959730201878539 | 0.520134899060731 |
| 33 | 0.515132674316887 | 0.969734651366226 | 0.484867325683113 |
| 34 | 0.490331726982327 | 0.980663453964653 | 0.509668273017673 |
| 35 | 0.452662901472848 | 0.905325802945695 | 0.547337098527152 |
| 36 | 0.410574608869014 | 0.821149217738028 | 0.589425391130986 |
| 37 | 0.362885137362518 | 0.725770274725037 | 0.637114862637482 |
| 38 | 0.317293570151581 | 0.634587140303162 | 0.68270642984842 |
| 39 | 0.280288033838616 | 0.560576067677233 | 0.719711966161384 |
| 40 | 0.238192732094316 | 0.476385464188632 | 0.761807267905684 |
| 41 | 0.200072030149485 | 0.40014406029897 | 0.799927969850515 |
| 42 | 0.218891298001656 | 0.437782596003313 | 0.781108701998344 |
| 43 | 0.183300215836041 | 0.366600431672083 | 0.816699784163958 |
| 44 | 0.160299612919949 | 0.320599225839898 | 0.839700387080051 |
| 45 | 0.175872143349204 | 0.351744286698408 | 0.824127856650796 |
| 46 | 0.240496190851651 | 0.480992381703302 | 0.759503809148349 |
| 47 | 0.361441070263678 | 0.722882140527356 | 0.638558929736322 |
| 48 | 0.371968436504433 | 0.743936873008865 | 0.628031563495568 |
| 49 | 0.323584552584648 | 0.647169105169297 | 0.676415447415352 |
| 50 | 0.269196777784206 | 0.538393555568413 | 0.730803222215794 |
| 51 | 0.242939823087395 | 0.48587964617479 | 0.757060176912605 |
| 52 | 0.260651059802287 | 0.521302119604573 | 0.739348940197713 |
| 53 | 0.30974663840482 | 0.61949327680964 | 0.69025336159518 |
| 54 | 0.261926803721463 | 0.523853607442927 | 0.738073196278537 |
| 55 | 0.262883977036113 | 0.525767954072226 | 0.737116022963887 |
| 56 | 0.36608077656958 | 0.73216155313916 | 0.63391922343042 |
| 57 | 0.65714779804981 | 0.685704403900382 | 0.342852201950191 |
| 58 | 0.780945212101863 | 0.438109575796275 | 0.219054787898137 |
| 59 | 0.717944145647239 | 0.564111708705522 | 0.282055854352761 |
| Meta Analysis of Goldfeld-Quandt test for Heteroskedasticity | |||
| Description | # significant tests | % significant tests | OK/NOK |
| 1% type I error level | 0 | 0 | OK |
| 5% type I error level | 0 | 0 | OK |
| 10% type I error level | 5 | 0.090909090909091 | OK |