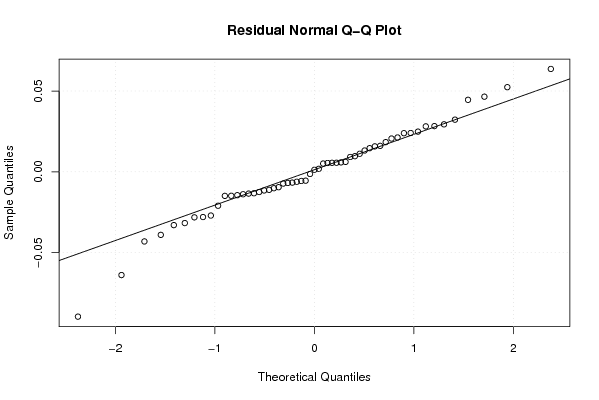
| Multiple Linear Regression - Estimated Regression Equation |
| Y[t] = + 0.0933902629630105 + 0.0131973758026373X[t] + 1.12898049003522Y1[t] -0.261041337127442Y2[t] + 0.00904104327854089M1[t] -0.0127712637042683M2[t] + 0.0157127599307248M3[t] -0.00646660452244727M4[t] + 0.0238195808627235M5[t] + 0.00955915069397892M6[t] + 0.00539507651379937M7[t] + 0.0051366371530282M8[t] -0.0216543225624553M9[t] + 0.0078438959252224M10[t] -0.0141773306869561M11[t] + 0.000257008712972165t + e[t] |
| Multiple Linear Regression - Ordinary Least Squares | |||||
| Variable | Parameter | S.D. | T-STAT H0: parameter = 0 | 2-tail p-value | 1-tail p-value |
| (Intercept) | 0.0933902629630105 | 0.050427 | 1.852 | 0.071238 | 0.035619 |
| X | 0.0131973758026373 | 0.013289 | 0.9931 | 0.326499 | 0.163249 |
| Y1 | 1.12898049003522 | 0.181057 | 6.2355 | 0 | 0 |
| Y2 | -0.261041337127442 | 0.169251 | -1.5423 | 0.130676 | 0.065338 |
| M1 | 0.00904104327854089 | 0.021523 | 0.4201 | 0.676638 | 0.338319 |
| M2 | -0.0127712637042683 | 0.02203 | -0.5797 | 0.565272 | 0.282636 |
| M3 | 0.0157127599307248 | 0.022069 | 0.712 | 0.480516 | 0.240258 |
| M4 | -0.00646660452244727 | 0.022106 | -0.2925 | 0.771359 | 0.385679 |
| M5 | 0.0238195808627235 | 0.02191 | 1.0872 | 0.283312 | 0.141656 |
| M6 | 0.00955915069397892 | 0.022279 | 0.4291 | 0.670116 | 0.335058 |
| M7 | 0.00539507651379937 | 0.022383 | 0.241 | 0.810732 | 0.405366 |
| M8 | 0.0051366371530282 | 0.022278 | 0.2306 | 0.818798 | 0.409399 |
| M9 | -0.0216543225624553 | 0.02212 | -0.979 | 0.333342 | 0.166671 |
| M10 | 0.0078438959252224 | 0.024009 | 0.3267 | 0.74555 | 0.372775 |
| M11 | -0.0141773306869561 | 0.022671 | -0.6254 | 0.535198 | 0.267599 |
| t | 0.000257008712972165 | 0.000272 | 0.9443 | 0.350542 | 0.175271 |
| Multiple Linear Regression - Regression Statistics | |
| Multiple R | 0.938532903991567 |
| R-squared | 0.880844011874843 |
| Adjusted R-squared | 0.837250357682712 |
| F-TEST (value) | 20.2057851813177 |
| F-TEST (DF numerator) | 15 |
| F-TEST (DF denominator) | 41 |
| p-value | 2.75335310107039e-14 |
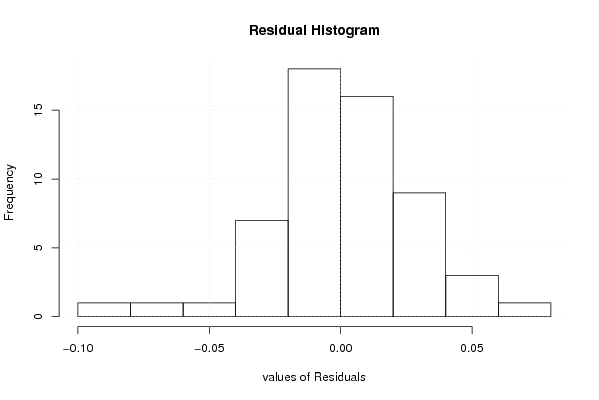
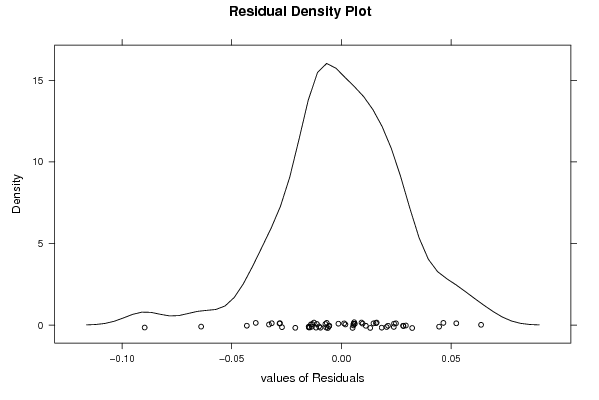
| Multiple Linear Regression - Residual Statistics | |
| Residual Standard Deviation | 0.0317207095155677 |
| Sum Squared Residuals | 0.041254339899012 |
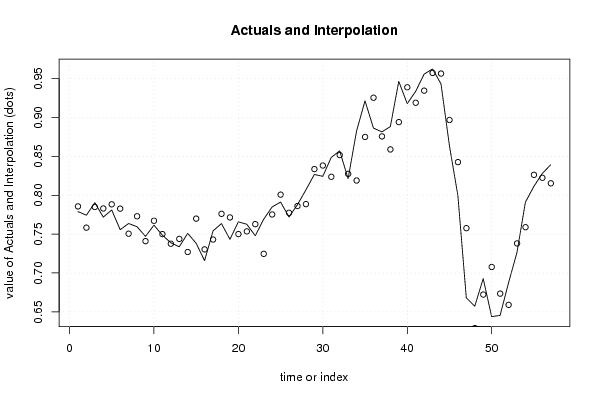
| Multiple Linear Regression - Actuals, Interpolation, and Residuals | |||
| Time or Index | Actuals | Interpolation Forecast | Residuals Prediction Error |
| 1 | 0.779 | 0.785707704326124 | -0.00670770432612371 |
| 2 | 0.7744 | 0.758335442347275 | 0.0160645576527254 |
| 3 | 0.7905 | 0.784936117519875 | 0.00556388248012521 |
| 4 | 0.7719 | 0.783064203985963 | -0.0111642039859629 |
| 5 | 0.7811 | 0.788392398065896 | -0.00729239806589634 |
| 6 | 0.7557 | 0.782794725323252 | -0.0270947253232522 |
| 7 | 0.7637 | 0.750541831898724 | 0.0131581681012764 |
| 8 | 0.7595 | 0.773012541048404 | -0.0135125410484043 |
| 9 | 0.7471 | 0.740968278870989 | 0.00613172112901088 |
| 10 | 0.7615 | 0.76719065843101 | -0.00569065843101006 |
| 11 | 0.7487 | 0.750060427014922 | -0.00136042701492153 |
| 12 | 0.7389 | 0.737653737112839 | 0.00124626288716086 |
| 13 | 0.7337 | 0.743874585699766 | -0.0101745856997665 |
| 14 | 0.751 | 0.72699120634619 | 0.0240087936538091 |
| 15 | 0.7382 | 0.769956341344496 | -0.0317563413444964 |
| 16 | 0.7159 | 0.730386757779805 | -0.0144867577798046 |
| 17 | 0.7542 | 0.743054228806185 | 0.0111457711938155 |
| 18 | 0.7636 | 0.776119178190505 | -0.0125191781905048 |
| 19 | 0.7433 | 0.771506908537384 | -0.0282069085373837 |
| 20 | 0.7658 | 0.750053005986255 | 0.015746994013745 |
| 21 | 0.7627 | 0.753533991611486 | 0.00916600838851389 |
| 22 | 0.748 | 0.762869745660852 | -0.014869745660852 |
| 23 | 0.7692 | 0.724645676537289 | 0.0445543234627115 |
| 24 | 0.785 | 0.77532442524703 | 0.00967557475297011 |
| 25 | 0.7913 | 0.800832715871578 | -0.00953271587157835 |
| 26 | 0.772 | 0.777501288897598 | -0.00550128889759753 |
| 27 | 0.788 | 0.786173768193653 | 0.00182623180634735 |
| 28 | 0.807 | 0.788620146177629 | 0.0183798538223709 |
| 29 | 0.8268 | 0.83371864877706 | -0.00691864877705902 |
| 30 | 0.8244 | 0.838310216816602 | -0.0139102168166024 |
| 31 | 0.8487 | 0.82383271503445 | 0.0248672849655508 |
| 32 | 0.8572 | 0.851760035745586 | 0.0054399642544144 |
| 33 | 0.8214 | 0.827581692861597 | -0.00618169286159735 |
| 34 | 0.8827 | 0.819016109040866 | 0.0636838909591345 |
| 35 | 0.9216 | 0.875091016756638 | 0.0465089832433617 |
| 36 | 0.8865 | 0.925557249371646 | -0.0390572493716464 |
| 37 | 0.8816 | 0.875769428207806 | 0.00583057179219378 |
| 38 | 0.8884 | 0.859019242916405 | 0.0293807570835953 |
| 39 | 0.9466 | 0.894208943746033 | 0.0523910562539672 |
| 40 | 0.918 | 0.939016015103575 | -0.0210160151035753 |
| 41 | 0.9337 | 0.919081957058695 | 0.0146180429413048 |
| 42 | 0.9559 | 0.934650840304796 | 0.0212491596952039 |
| 43 | 0.9626 | 0.957502440700828 | 0.00509755929917249 |
| 44 | 0.9434 | 0.956670178618916 | -0.0132701786189158 |
| 45 | 0.8639 | 0.896918372403417 | -0.0330183724034174 |
| 46 | 0.7996 | 0.842723486867272 | -0.0431234868672724 |
| 47 | 0.668 | 0.757702879691152 | -0.0897028796911517 |
| 48 | 0.6572 | 0.629064588268485 | 0.0281354117315154 |
| 49 | 0.6928 | 0.672215565894725 | 0.0205844341052748 |
| 50 | 0.6438 | 0.707752819492532 | -0.0639528194925323 |
| 51 | 0.6454 | 0.673424829195943 | -0.0280248291959435 |
| 52 | 0.6873 | 0.659012876953028 | 0.0282871230469718 |
| 53 | 0.7265 | 0.738052767292165 | -0.0115527672921649 |
| 54 | 0.7912 | 0.758925039364845 | 0.0322749606351555 |
| 55 | 0.8114 | 0.826316103828616 | -0.0149161038286159 |
| 56 | 0.8281 | 0.822504238600839 | 0.00559576139916069 |
| 57 | 0.8393 | 0.81539766425251 | 0.0239023357474900 |
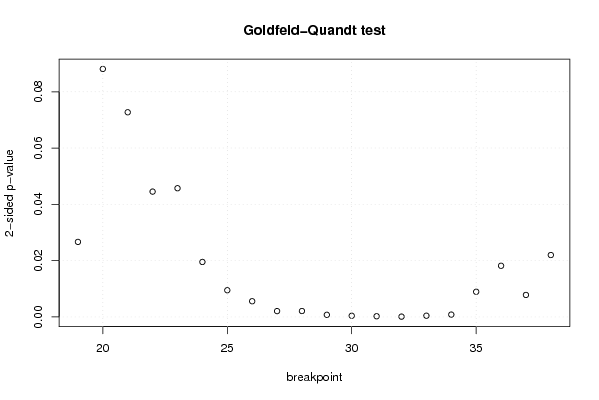
| Goldfeld-Quandt test for Heteroskedasticity | |||
| p-values | Alternative Hypothesis | ||
| breakpoint index | greater | 2-sided | less |
| 19 | 0.0133254148988905 | 0.0266508297977811 | 0.98667458510111 |
| 20 | 0.0440524468220035 | 0.088104893644007 | 0.955947553177997 |
| 21 | 0.0363568363064338 | 0.0727136726128676 | 0.963643163693566 |
| 22 | 0.0222619275019989 | 0.0445238550039978 | 0.977738072498001 |
| 23 | 0.0228613644138852 | 0.0457227288277703 | 0.977138635586115 |
| 24 | 0.0097697645828615 | 0.019539529165723 | 0.990230235417139 |
| 25 | 0.00474255482362691 | 0.00948510964725382 | 0.995257445176373 |
| 26 | 0.00278865897052858 | 0.00557731794105716 | 0.997211341029471 |
| 27 | 0.00103794481912466 | 0.00207588963824932 | 0.998962055180875 |
| 28 | 0.00104983794224418 | 0.00209967588448836 | 0.998950162057756 |
| 29 | 0.000377056607265409 | 0.000754113214530818 | 0.999622943392735 |
| 30 | 0.000204126334836595 | 0.000408252669673191 | 0.999795873665163 |
| 31 | 0.000119984878958914 | 0.000239969757917829 | 0.999880015121041 |
| 32 | 5.00010965545076e-05 | 0.000100002193109015 | 0.999949998903445 |
| 33 | 0.000216739244078787 | 0.000433478488157575 | 0.999783260755921 |
| 34 | 0.000414566901048388 | 0.000829133802096777 | 0.999585433098952 |
| 35 | 0.00446777809872259 | 0.00893555619744518 | 0.995532221901277 |
| 36 | 0.00908663666485146 | 0.0181732733297029 | 0.990913363335149 |
| 37 | 0.00390498513129657 | 0.00780997026259313 | 0.996095014868703 |
| 38 | 0.0109966311728245 | 0.021993262345649 | 0.989003368827176 |
| Meta Analysis of Goldfeld-Quandt test for Heteroskedasticity | |||
| Description | # significant tests | % significant tests | OK/NOK |
| 1% type I error level | 12 | 0.6 | NOK |
| 5% type I error level | 18 | 0.9 | NOK |
| 10% type I error level | 20 | 1 | NOK |