Free Statistics

of Irreproducible Research!

Author's title

Author*The author of this computation has been verified*
R Software Modulerwasp_multipleregression.wasp
Title produced by softwareMultiple Regression
Date of computationThu, 19 Nov 2009 12:11:43 -0700
Cite this page as followsStatistical Computations at FreeStatistics.org, Office for Research Development and Education, URL https://freestatistics.org/blog/index.php?v=date/2009/Nov/19/t1258657992rj50h65cpcdxeid.htm/, Retrieved Fri, 26 Apr 2024 14:51:08 +0000
Statistical Computations at FreeStatistics.org, Office for Research Development and Education, URL https://freestatistics.org/blog/index.php?pk=57903, Retrieved Fri, 26 Apr 2024 14:51:08 +0000
QR Codes:

Original text written by user:
IsPrivate?No (this computation is public)
User-defined keywords
Estimated Impact203
Family? (F = Feedback message, R = changed R code, M = changed R Module, P = changed Parameters, D = changed Data)
-     [Multiple Regression] [Q1 The Seatbeltlaw] [2007-11-14 19:27:43] [8cd6641b921d30ebe00b648d1481bba0]
- RM D  [Multiple Regression] [Seatbelt] [2009-11-12 14:14:11] [b98453cac15ba1066b407e146608df68]
-    D      [Multiple Regression] [Workshop 7: Multi...] [2009-11-19 19:11:43] [a5c6be3c0aa55fdb2a703a08e16947ef] [Current]
Feedback Forum

Post a new message
Dataseries X:
0,7790	0,0000	0,7775	0,7461
0,7744	0,0520	0,7790	0,7775
0,7905	0,3130	0,7744	0,7790
0,7719	0,3640	0,7905	0,7744
0,7811	0,3630	0,7719	0,7905
0,7557	-0,1550	0,7811	0,7719
0,7637	0,0520	0,7557	0,7811
0,7595	0,5680	0,7637	0,7557
0,7471	0,6680	0,7595	0,7637
0,7615	1,3780	0,7471	0,7595
0,7487	0,2520	0,7615	0,7471
0,7389	-0,4020	0,7487	0,7615
0,7337	-0,0500	0,7389	0,7487
0,7510	0,5550	0,7337	0,7389
0,7382	0,0500	0,7510	0,7337
0,7159	0,1500	0,7382	0,7510
0,7542	0,4500	0,7159	0,7382
0,7636	0,2990	0,7542	0,7159
0,7433	0,1990	0,7636	0,7542
0,7658	0,4960	0,7433	0,7636
0,7627	0,4440	0,7658	0,7433
0,7480	-0,3930	0,7627	0,7658
0,7692	-0,4440	0,7480	0,7627
0,7850	0,1980	0,7692	0,7480
0,7913	0,4940	0,7850	0,7692
0,7720	0,1330	0,7913	0,7850
0,7880	0,3880	0,7720	0,7913
0,8070	0,4840	0,7880	0,7720
0,8268	0,2780	0,8070	0,7880
0,8244	0,3690	0,8268	0,8070
0,8487	0,1650	0,8244	0,8268
0,8572	0,1550	0,8487	0,8244
0,8214	0,0870	0,8572	0,8487
0,8827	0,4140	0,8214	0,8572
0,9216	0,3600	0,8827	0,8214
0,8865	0,9750	0,9216	0,8827
0,8816	0,2700	0,8865	0,9216
0,8884	0,3590	0,8816	0,8865
0,9466	0,1690	0,8884	0,8816
0,9180	0,3810	0,9466	0,8884
0,9337	0,1540	0,9180	0,9466
0,9559	0,4860	0,9337	0,9180
0,9626	0,9250	0,9559	0,9337
0,9434	0,7280	0,9626	0,9559
0,8639	-0,0140	0,9434	0,9626
0,7996	0,0460	0,8639	0,9434
0,6680	-0,8190	0,7996	0,8639
0,6572	-1,6740	0,6680	0,7996
0,6928	-0,7880	0,6572	0,6680
0,6438	0,2790	0,6928	0,6572
0,6454	0,3960	0,6438	0,6928
0,6873	-0,1410	0,6454	0,6438
0,7265	-0,0190	0,6873	0,6454
0,7912	0,0990	0,7265	0,6873
0,8114	0,7420	0,7912	0,7265
0,8281	0,0050	0,8114	0,7912
0,8393	0,4480	0,8281	0,8114


Summary of computational transaction
Raw Inputview raw input (R code)
Raw Outputview raw output of R engine
Computing time3 seconds
R Server'Gwilym Jenkins' @ 72.249.127.135

\begin{tabular}{lllllllll}
\hline
Summary of computational transaction \tabularnewline
Raw Input & view raw input (R code)  \tabularnewline
Raw Output & view raw output of R engine  \tabularnewline
Computing time & 3 seconds \tabularnewline
R Server & 'Gwilym Jenkins' @ 72.249.127.135 \tabularnewline
\hline
\end{tabular}
%Source: https://freestatistics.org/blog/index.php?pk=57903&T=0

[TABLE]
[ROW][C]Summary of computational transaction[/C][/ROW]
[ROW][C]Raw Input[/C][C]view raw input (R code) [/C][/ROW]
[ROW][C]Raw Output[/C][C]view raw output of R engine [/C][/ROW]
[ROW][C]Computing time[/C][C]3 seconds[/C][/ROW]
[ROW][C]R Server[/C][C]'Gwilym Jenkins' @ 72.249.127.135[/C][/ROW]
[/TABLE]
Source: https://freestatistics.org/blog/index.php?pk=57903&T=0

Globally Unique Identifier (entire table): ba.freestatistics.org/blog/index.php?pk=57903&T=0

As an alternative you can also use a QR Code:  

The GUIDs for individual cells are displayed in the table below:

Summary of computational transaction
Raw Inputview raw input (R code)
Raw Outputview raw output of R engine
Computing time3 seconds
R Server'Gwilym Jenkins' @ 72.249.127.135


Multiple Linear Regression - Estimated Regression Equation
Y[t] = + 0.0933902629630105 + 0.0131973758026373X[t] + 1.12898049003522Y1[t] -0.261041337127442Y2[t] + 0.00904104327854089M1[t] -0.0127712637042683M2[t] + 0.0157127599307248M3[t] -0.00646660452244727M4[t] + 0.0238195808627235M5[t] + 0.00955915069397892M6[t] + 0.00539507651379937M7[t] + 0.0051366371530282M8[t] -0.0216543225624553M9[t] + 0.0078438959252224M10[t] -0.0141773306869561M11[t] + 0.000257008712972165t + e[t]

\begin{tabular}{lllllllll}
\hline
Multiple Linear Regression - Estimated Regression Equation \tabularnewline
Y[t] =  +  0.0933902629630105 +  0.0131973758026373X[t] +  1.12898049003522Y1[t] -0.261041337127442Y2[t] +  0.00904104327854089M1[t] -0.0127712637042683M2[t] +  0.0157127599307248M3[t] -0.00646660452244727M4[t] +  0.0238195808627235M5[t] +  0.00955915069397892M6[t] +  0.00539507651379937M7[t] +  0.0051366371530282M8[t] -0.0216543225624553M9[t] +  0.0078438959252224M10[t] -0.0141773306869561M11[t] +  0.000257008712972165t  + e[t] \tabularnewline
\hline
\end{tabular}
%Source: https://freestatistics.org/blog/index.php?pk=57903&T=1

[TABLE]
[ROW][C]Multiple Linear Regression - Estimated Regression Equation[/C][/ROW]
[ROW][C]Y[t] =  +  0.0933902629630105 +  0.0131973758026373X[t] +  1.12898049003522Y1[t] -0.261041337127442Y2[t] +  0.00904104327854089M1[t] -0.0127712637042683M2[t] +  0.0157127599307248M3[t] -0.00646660452244727M4[t] +  0.0238195808627235M5[t] +  0.00955915069397892M6[t] +  0.00539507651379937M7[t] +  0.0051366371530282M8[t] -0.0216543225624553M9[t] +  0.0078438959252224M10[t] -0.0141773306869561M11[t] +  0.000257008712972165t  + e[t][/C][/ROW]
[/TABLE]
Source: https://freestatistics.org/blog/index.php?pk=57903&T=1

Globally Unique Identifier (entire table): ba.freestatistics.org/blog/index.php?pk=57903&T=1

As an alternative you can also use a QR Code:  

The GUIDs for individual cells are displayed in the table below:

Multiple Linear Regression - Estimated Regression Equation
Y[t] = + 0.0933902629630105 + 0.0131973758026373X[t] + 1.12898049003522Y1[t] -0.261041337127442Y2[t] + 0.00904104327854089M1[t] -0.0127712637042683M2[t] + 0.0157127599307248M3[t] -0.00646660452244727M4[t] + 0.0238195808627235M5[t] + 0.00955915069397892M6[t] + 0.00539507651379937M7[t] + 0.0051366371530282M8[t] -0.0216543225624553M9[t] + 0.0078438959252224M10[t] -0.0141773306869561M11[t] + 0.000257008712972165t + e[t]


Multiple Linear Regression - Ordinary Least Squares
VariableParameterS.D.T-STATH0: parameter = 02-tail p-value1-tail p-value
(Intercept)0.09339026296301050.0504271.8520.0712380.035619
X0.01319737580263730.0132890.99310.3264990.163249
Y11.128980490035220.1810576.235500
Y2-0.2610413371274420.169251-1.54230.1306760.065338
M10.009041043278540890.0215230.42010.6766380.338319
M2-0.01277126370426830.02203-0.57970.5652720.282636
M30.01571275993072480.0220690.7120.4805160.240258
M4-0.006466604522447270.022106-0.29250.7713590.385679
M50.02381958086272350.021911.08720.2833120.141656
M60.009559150693978920.0222790.42910.6701160.335058
M70.005395076513799370.0223830.2410.8107320.405366
M80.00513663715302820.0222780.23060.8187980.409399
M9-0.02165432256245530.02212-0.9790.3333420.166671
M100.00784389592522240.0240090.32670.745550.372775
M11-0.01417733068695610.022671-0.62540.5351980.267599
t0.0002570087129721650.0002720.94430.3505420.175271

\begin{tabular}{lllllllll}
\hline
Multiple Linear Regression - Ordinary Least Squares \tabularnewline
Variable & Parameter & S.D. & T-STATH0: parameter = 0 & 2-tail p-value & 1-tail p-value \tabularnewline
(Intercept) & 0.0933902629630105 & 0.050427 & 1.852 & 0.071238 & 0.035619 \tabularnewline
X & 0.0131973758026373 & 0.013289 & 0.9931 & 0.326499 & 0.163249 \tabularnewline
Y1 & 1.12898049003522 & 0.181057 & 6.2355 & 0 & 0 \tabularnewline
Y2 & -0.261041337127442 & 0.169251 & -1.5423 & 0.130676 & 0.065338 \tabularnewline
M1 & 0.00904104327854089 & 0.021523 & 0.4201 & 0.676638 & 0.338319 \tabularnewline
M2 & -0.0127712637042683 & 0.02203 & -0.5797 & 0.565272 & 0.282636 \tabularnewline
M3 & 0.0157127599307248 & 0.022069 & 0.712 & 0.480516 & 0.240258 \tabularnewline
M4 & -0.00646660452244727 & 0.022106 & -0.2925 & 0.771359 & 0.385679 \tabularnewline
M5 & 0.0238195808627235 & 0.02191 & 1.0872 & 0.283312 & 0.141656 \tabularnewline
M6 & 0.00955915069397892 & 0.022279 & 0.4291 & 0.670116 & 0.335058 \tabularnewline
M7 & 0.00539507651379937 & 0.022383 & 0.241 & 0.810732 & 0.405366 \tabularnewline
M8 & 0.0051366371530282 & 0.022278 & 0.2306 & 0.818798 & 0.409399 \tabularnewline
M9 & -0.0216543225624553 & 0.02212 & -0.979 & 0.333342 & 0.166671 \tabularnewline
M10 & 0.0078438959252224 & 0.024009 & 0.3267 & 0.74555 & 0.372775 \tabularnewline
M11 & -0.0141773306869561 & 0.022671 & -0.6254 & 0.535198 & 0.267599 \tabularnewline
t & 0.000257008712972165 & 0.000272 & 0.9443 & 0.350542 & 0.175271 \tabularnewline
\hline
\end{tabular}
%Source: https://freestatistics.org/blog/index.php?pk=57903&T=2

[TABLE]
[ROW][C]Multiple Linear Regression - Ordinary Least Squares[/C][/ROW]
[ROW][C]Variable[/C][C]Parameter[/C][C]S.D.[/C][C]T-STATH0: parameter = 0[/C][C]2-tail p-value[/C][C]1-tail p-value[/C][/ROW]
[ROW][C](Intercept)[/C][C]0.0933902629630105[/C][C]0.050427[/C][C]1.852[/C][C]0.071238[/C][C]0.035619[/C][/ROW]
[ROW][C]X[/C][C]0.0131973758026373[/C][C]0.013289[/C][C]0.9931[/C][C]0.326499[/C][C]0.163249[/C][/ROW]
[ROW][C]Y1[/C][C]1.12898049003522[/C][C]0.181057[/C][C]6.2355[/C][C]0[/C][C]0[/C][/ROW]
[ROW][C]Y2[/C][C]-0.261041337127442[/C][C]0.169251[/C][C]-1.5423[/C][C]0.130676[/C][C]0.065338[/C][/ROW]
[ROW][C]M1[/C][C]0.00904104327854089[/C][C]0.021523[/C][C]0.4201[/C][C]0.676638[/C][C]0.338319[/C][/ROW]
[ROW][C]M2[/C][C]-0.0127712637042683[/C][C]0.02203[/C][C]-0.5797[/C][C]0.565272[/C][C]0.282636[/C][/ROW]
[ROW][C]M3[/C][C]0.0157127599307248[/C][C]0.022069[/C][C]0.712[/C][C]0.480516[/C][C]0.240258[/C][/ROW]
[ROW][C]M4[/C][C]-0.00646660452244727[/C][C]0.022106[/C][C]-0.2925[/C][C]0.771359[/C][C]0.385679[/C][/ROW]
[ROW][C]M5[/C][C]0.0238195808627235[/C][C]0.02191[/C][C]1.0872[/C][C]0.283312[/C][C]0.141656[/C][/ROW]
[ROW][C]M6[/C][C]0.00955915069397892[/C][C]0.022279[/C][C]0.4291[/C][C]0.670116[/C][C]0.335058[/C][/ROW]
[ROW][C]M7[/C][C]0.00539507651379937[/C][C]0.022383[/C][C]0.241[/C][C]0.810732[/C][C]0.405366[/C][/ROW]
[ROW][C]M8[/C][C]0.0051366371530282[/C][C]0.022278[/C][C]0.2306[/C][C]0.818798[/C][C]0.409399[/C][/ROW]
[ROW][C]M9[/C][C]-0.0216543225624553[/C][C]0.02212[/C][C]-0.979[/C][C]0.333342[/C][C]0.166671[/C][/ROW]
[ROW][C]M10[/C][C]0.0078438959252224[/C][C]0.024009[/C][C]0.3267[/C][C]0.74555[/C][C]0.372775[/C][/ROW]
[ROW][C]M11[/C][C]-0.0141773306869561[/C][C]0.022671[/C][C]-0.6254[/C][C]0.535198[/C][C]0.267599[/C][/ROW]
[ROW][C]t[/C][C]0.000257008712972165[/C][C]0.000272[/C][C]0.9443[/C][C]0.350542[/C][C]0.175271[/C][/ROW]
[/TABLE]
Source: https://freestatistics.org/blog/index.php?pk=57903&T=2

Globally Unique Identifier (entire table): ba.freestatistics.org/blog/index.php?pk=57903&T=2

As an alternative you can also use a QR Code:  

The GUIDs for individual cells are displayed in the table below:

Multiple Linear Regression - Ordinary Least Squares
VariableParameterS.D.T-STATH0: parameter = 02-tail p-value1-tail p-value
(Intercept)0.09339026296301050.0504271.8520.0712380.035619
X0.01319737580263730.0132890.99310.3264990.163249
Y11.128980490035220.1810576.235500
Y2-0.2610413371274420.169251-1.54230.1306760.065338
M10.009041043278540890.0215230.42010.6766380.338319
M2-0.01277126370426830.02203-0.57970.5652720.282636
M30.01571275993072480.0220690.7120.4805160.240258
M4-0.006466604522447270.022106-0.29250.7713590.385679
M50.02381958086272350.021911.08720.2833120.141656
M60.009559150693978920.0222790.42910.6701160.335058
M70.005395076513799370.0223830.2410.8107320.405366
M80.00513663715302820.0222780.23060.8187980.409399
M9-0.02165432256245530.02212-0.9790.3333420.166671
M100.00784389592522240.0240090.32670.745550.372775
M11-0.01417733068695610.022671-0.62540.5351980.267599
t0.0002570087129721650.0002720.94430.3505420.175271


Multiple Linear Regression - Regression Statistics
Multiple R0.938532903991567
R-squared0.880844011874843
Adjusted R-squared0.837250357682712
F-TEST (value)20.2057851813177
F-TEST (DF numerator)15
F-TEST (DF denominator)41
p-value2.75335310107039e-14
Multiple Linear Regression - Residual Statistics
Residual Standard Deviation0.0317207095155677
Sum Squared Residuals0.041254339899012

\begin{tabular}{lllllllll}
\hline
Multiple Linear Regression - Regression Statistics \tabularnewline
Multiple R & 0.938532903991567 \tabularnewline
R-squared & 0.880844011874843 \tabularnewline
Adjusted R-squared & 0.837250357682712 \tabularnewline
F-TEST (value) & 20.2057851813177 \tabularnewline
F-TEST (DF numerator) & 15 \tabularnewline
F-TEST (DF denominator) & 41 \tabularnewline
p-value & 2.75335310107039e-14 \tabularnewline
Multiple Linear Regression - Residual Statistics \tabularnewline
Residual Standard Deviation & 0.0317207095155677 \tabularnewline
Sum Squared Residuals & 0.041254339899012 \tabularnewline
\hline
\end{tabular}
%Source: https://freestatistics.org/blog/index.php?pk=57903&T=3

[TABLE]
[ROW][C]Multiple Linear Regression - Regression Statistics[/C][/ROW]
[ROW][C]Multiple R[/C][C]0.938532903991567[/C][/ROW]
[ROW][C]R-squared[/C][C]0.880844011874843[/C][/ROW]
[ROW][C]Adjusted R-squared[/C][C]0.837250357682712[/C][/ROW]
[ROW][C]F-TEST (value)[/C][C]20.2057851813177[/C][/ROW]
[ROW][C]F-TEST (DF numerator)[/C][C]15[/C][/ROW]
[ROW][C]F-TEST (DF denominator)[/C][C]41[/C][/ROW]
[ROW][C]p-value[/C][C]2.75335310107039e-14[/C][/ROW]
[ROW][C]Multiple Linear Regression - Residual Statistics[/C][/ROW]
[ROW][C]Residual Standard Deviation[/C][C]0.0317207095155677[/C][/ROW]
[ROW][C]Sum Squared Residuals[/C][C]0.041254339899012[/C][/ROW]
[/TABLE]
Source: https://freestatistics.org/blog/index.php?pk=57903&T=3

Globally Unique Identifier (entire table): ba.freestatistics.org/blog/index.php?pk=57903&T=3

As an alternative you can also use a QR Code:  

The GUIDs for individual cells are displayed in the table below:

Multiple Linear Regression - Regression Statistics
Multiple R0.938532903991567
R-squared0.880844011874843
Adjusted R-squared0.837250357682712
F-TEST (value)20.2057851813177
F-TEST (DF numerator)15
F-TEST (DF denominator)41
p-value2.75335310107039e-14
Multiple Linear Regression - Residual Statistics
Residual Standard Deviation0.0317207095155677
Sum Squared Residuals0.041254339899012


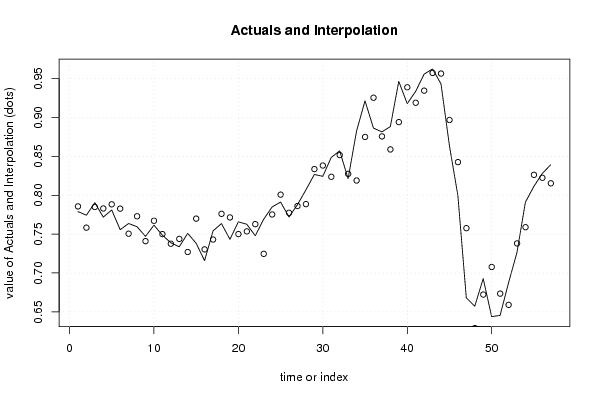
Multiple Linear Regression - Actuals, Interpolation, and Residuals
Time or IndexActualsInterpolationForecastResidualsPrediction Error
10.7790.785707704326124-0.00670770432612371
20.77440.7583354423472750.0160645576527254
30.79050.7849361175198750.00556388248012521
40.77190.783064203985963-0.0111642039859629
50.78110.788392398065896-0.00729239806589634
60.75570.782794725323252-0.0270947253232522
70.76370.7505418318987240.0131581681012764
80.75950.773012541048404-0.0135125410484043
90.74710.7409682788709890.00613172112901088
100.76150.76719065843101-0.00569065843101006
110.74870.750060427014922-0.00136042701492153
120.73890.7376537371128390.00124626288716086
130.73370.743874585699766-0.0101745856997665
140.7510.726991206346190.0240087936538091
150.73820.769956341344496-0.0317563413444964
160.71590.730386757779805-0.0144867577798046
170.75420.7430542288061850.0111457711938155
180.76360.776119178190505-0.0125191781905048
190.74330.771506908537384-0.0282069085373837
200.76580.7500530059862550.015746994013745
210.76270.7535339916114860.00916600838851389
220.7480.762869745660852-0.014869745660852
230.76920.7246456765372890.0445543234627115
240.7850.775324425247030.00967557475297011
250.79130.800832715871578-0.00953271587157835
260.7720.777501288897598-0.00550128889759753
270.7880.7861737681936530.00182623180634735
280.8070.7886201461776290.0183798538223709
290.82680.83371864877706-0.00691864877705902
300.82440.838310216816602-0.0139102168166024
310.84870.823832715034450.0248672849655508
320.85720.8517600357455860.0054399642544144
330.82140.827581692861597-0.00618169286159735
340.88270.8190161090408660.0636838909591345
350.92160.8750910167566380.0465089832433617
360.88650.925557249371646-0.0390572493716464
370.88160.8757694282078060.00583057179219378
380.88840.8590192429164050.0293807570835953
390.94660.8942089437460330.0523910562539672
400.9180.939016015103575-0.0210160151035753
410.93370.9190819570586950.0146180429413048
420.95590.9346508403047960.0212491596952039
430.96260.9575024407008280.00509755929917249
440.94340.956670178618916-0.0132701786189158
450.86390.896918372403417-0.0330183724034174
460.79960.842723486867272-0.0431234868672724
470.6680.757702879691152-0.0897028796911517
480.65720.6290645882684850.0281354117315154
490.69280.6722155658947250.0205844341052748
500.64380.707752819492532-0.0639528194925323
510.64540.673424829195943-0.0280248291959435
520.68730.6590128769530280.0282871230469718
530.72650.738052767292165-0.0115527672921649
540.79120.7589250393648450.0322749606351555
550.81140.826316103828616-0.0149161038286159
560.82810.8225042386008390.00559576139916069
570.83930.815397664252510.0239023357474900

\begin{tabular}{lllllllll}
\hline
Multiple Linear Regression - Actuals, Interpolation, and Residuals \tabularnewline
Time or Index & Actuals & InterpolationForecast & ResidualsPrediction Error \tabularnewline
1 & 0.779 & 0.785707704326124 & -0.00670770432612371 \tabularnewline
2 & 0.7744 & 0.758335442347275 & 0.0160645576527254 \tabularnewline
3 & 0.7905 & 0.784936117519875 & 0.00556388248012521 \tabularnewline
4 & 0.7719 & 0.783064203985963 & -0.0111642039859629 \tabularnewline
5 & 0.7811 & 0.788392398065896 & -0.00729239806589634 \tabularnewline
6 & 0.7557 & 0.782794725323252 & -0.0270947253232522 \tabularnewline
7 & 0.7637 & 0.750541831898724 & 0.0131581681012764 \tabularnewline
8 & 0.7595 & 0.773012541048404 & -0.0135125410484043 \tabularnewline
9 & 0.7471 & 0.740968278870989 & 0.00613172112901088 \tabularnewline
10 & 0.7615 & 0.76719065843101 & -0.00569065843101006 \tabularnewline
11 & 0.7487 & 0.750060427014922 & -0.00136042701492153 \tabularnewline
12 & 0.7389 & 0.737653737112839 & 0.00124626288716086 \tabularnewline
13 & 0.7337 & 0.743874585699766 & -0.0101745856997665 \tabularnewline
14 & 0.751 & 0.72699120634619 & 0.0240087936538091 \tabularnewline
15 & 0.7382 & 0.769956341344496 & -0.0317563413444964 \tabularnewline
16 & 0.7159 & 0.730386757779805 & -0.0144867577798046 \tabularnewline
17 & 0.7542 & 0.743054228806185 & 0.0111457711938155 \tabularnewline
18 & 0.7636 & 0.776119178190505 & -0.0125191781905048 \tabularnewline
19 & 0.7433 & 0.771506908537384 & -0.0282069085373837 \tabularnewline
20 & 0.7658 & 0.750053005986255 & 0.015746994013745 \tabularnewline
21 & 0.7627 & 0.753533991611486 & 0.00916600838851389 \tabularnewline
22 & 0.748 & 0.762869745660852 & -0.014869745660852 \tabularnewline
23 & 0.7692 & 0.724645676537289 & 0.0445543234627115 \tabularnewline
24 & 0.785 & 0.77532442524703 & 0.00967557475297011 \tabularnewline
25 & 0.7913 & 0.800832715871578 & -0.00953271587157835 \tabularnewline
26 & 0.772 & 0.777501288897598 & -0.00550128889759753 \tabularnewline
27 & 0.788 & 0.786173768193653 & 0.00182623180634735 \tabularnewline
28 & 0.807 & 0.788620146177629 & 0.0183798538223709 \tabularnewline
29 & 0.8268 & 0.83371864877706 & -0.00691864877705902 \tabularnewline
30 & 0.8244 & 0.838310216816602 & -0.0139102168166024 \tabularnewline
31 & 0.8487 & 0.82383271503445 & 0.0248672849655508 \tabularnewline
32 & 0.8572 & 0.851760035745586 & 0.0054399642544144 \tabularnewline
33 & 0.8214 & 0.827581692861597 & -0.00618169286159735 \tabularnewline
34 & 0.8827 & 0.819016109040866 & 0.0636838909591345 \tabularnewline
35 & 0.9216 & 0.875091016756638 & 0.0465089832433617 \tabularnewline
36 & 0.8865 & 0.925557249371646 & -0.0390572493716464 \tabularnewline
37 & 0.8816 & 0.875769428207806 & 0.00583057179219378 \tabularnewline
38 & 0.8884 & 0.859019242916405 & 0.0293807570835953 \tabularnewline
39 & 0.9466 & 0.894208943746033 & 0.0523910562539672 \tabularnewline
40 & 0.918 & 0.939016015103575 & -0.0210160151035753 \tabularnewline
41 & 0.9337 & 0.919081957058695 & 0.0146180429413048 \tabularnewline
42 & 0.9559 & 0.934650840304796 & 0.0212491596952039 \tabularnewline
43 & 0.9626 & 0.957502440700828 & 0.00509755929917249 \tabularnewline
44 & 0.9434 & 0.956670178618916 & -0.0132701786189158 \tabularnewline
45 & 0.8639 & 0.896918372403417 & -0.0330183724034174 \tabularnewline
46 & 0.7996 & 0.842723486867272 & -0.0431234868672724 \tabularnewline
47 & 0.668 & 0.757702879691152 & -0.0897028796911517 \tabularnewline
48 & 0.6572 & 0.629064588268485 & 0.0281354117315154 \tabularnewline
49 & 0.6928 & 0.672215565894725 & 0.0205844341052748 \tabularnewline
50 & 0.6438 & 0.707752819492532 & -0.0639528194925323 \tabularnewline
51 & 0.6454 & 0.673424829195943 & -0.0280248291959435 \tabularnewline
52 & 0.6873 & 0.659012876953028 & 0.0282871230469718 \tabularnewline
53 & 0.7265 & 0.738052767292165 & -0.0115527672921649 \tabularnewline
54 & 0.7912 & 0.758925039364845 & 0.0322749606351555 \tabularnewline
55 & 0.8114 & 0.826316103828616 & -0.0149161038286159 \tabularnewline
56 & 0.8281 & 0.822504238600839 & 0.00559576139916069 \tabularnewline
57 & 0.8393 & 0.81539766425251 & 0.0239023357474900 \tabularnewline
\hline
\end{tabular}
%Source: https://freestatistics.org/blog/index.php?pk=57903&T=4

[TABLE]
[ROW][C]Multiple Linear Regression - Actuals, Interpolation, and Residuals[/C][/ROW]
[ROW][C]Time or Index[/C][C]Actuals[/C][C]InterpolationForecast[/C][C]ResidualsPrediction Error[/C][/ROW]
[ROW][C]1[/C][C]0.779[/C][C]0.785707704326124[/C][C]-0.00670770432612371[/C][/ROW]
[ROW][C]2[/C][C]0.7744[/C][C]0.758335442347275[/C][C]0.0160645576527254[/C][/ROW]
[ROW][C]3[/C][C]0.7905[/C][C]0.784936117519875[/C][C]0.00556388248012521[/C][/ROW]
[ROW][C]4[/C][C]0.7719[/C][C]0.783064203985963[/C][C]-0.0111642039859629[/C][/ROW]
[ROW][C]5[/C][C]0.7811[/C][C]0.788392398065896[/C][C]-0.00729239806589634[/C][/ROW]
[ROW][C]6[/C][C]0.7557[/C][C]0.782794725323252[/C][C]-0.0270947253232522[/C][/ROW]
[ROW][C]7[/C][C]0.7637[/C][C]0.750541831898724[/C][C]0.0131581681012764[/C][/ROW]
[ROW][C]8[/C][C]0.7595[/C][C]0.773012541048404[/C][C]-0.0135125410484043[/C][/ROW]
[ROW][C]9[/C][C]0.7471[/C][C]0.740968278870989[/C][C]0.00613172112901088[/C][/ROW]
[ROW][C]10[/C][C]0.7615[/C][C]0.76719065843101[/C][C]-0.00569065843101006[/C][/ROW]
[ROW][C]11[/C][C]0.7487[/C][C]0.750060427014922[/C][C]-0.00136042701492153[/C][/ROW]
[ROW][C]12[/C][C]0.7389[/C][C]0.737653737112839[/C][C]0.00124626288716086[/C][/ROW]
[ROW][C]13[/C][C]0.7337[/C][C]0.743874585699766[/C][C]-0.0101745856997665[/C][/ROW]
[ROW][C]14[/C][C]0.751[/C][C]0.72699120634619[/C][C]0.0240087936538091[/C][/ROW]
[ROW][C]15[/C][C]0.7382[/C][C]0.769956341344496[/C][C]-0.0317563413444964[/C][/ROW]
[ROW][C]16[/C][C]0.7159[/C][C]0.730386757779805[/C][C]-0.0144867577798046[/C][/ROW]
[ROW][C]17[/C][C]0.7542[/C][C]0.743054228806185[/C][C]0.0111457711938155[/C][/ROW]
[ROW][C]18[/C][C]0.7636[/C][C]0.776119178190505[/C][C]-0.0125191781905048[/C][/ROW]
[ROW][C]19[/C][C]0.7433[/C][C]0.771506908537384[/C][C]-0.0282069085373837[/C][/ROW]
[ROW][C]20[/C][C]0.7658[/C][C]0.750053005986255[/C][C]0.015746994013745[/C][/ROW]
[ROW][C]21[/C][C]0.7627[/C][C]0.753533991611486[/C][C]0.00916600838851389[/C][/ROW]
[ROW][C]22[/C][C]0.748[/C][C]0.762869745660852[/C][C]-0.014869745660852[/C][/ROW]
[ROW][C]23[/C][C]0.7692[/C][C]0.724645676537289[/C][C]0.0445543234627115[/C][/ROW]
[ROW][C]24[/C][C]0.785[/C][C]0.77532442524703[/C][C]0.00967557475297011[/C][/ROW]
[ROW][C]25[/C][C]0.7913[/C][C]0.800832715871578[/C][C]-0.00953271587157835[/C][/ROW]
[ROW][C]26[/C][C]0.772[/C][C]0.777501288897598[/C][C]-0.00550128889759753[/C][/ROW]
[ROW][C]27[/C][C]0.788[/C][C]0.786173768193653[/C][C]0.00182623180634735[/C][/ROW]
[ROW][C]28[/C][C]0.807[/C][C]0.788620146177629[/C][C]0.0183798538223709[/C][/ROW]
[ROW][C]29[/C][C]0.8268[/C][C]0.83371864877706[/C][C]-0.00691864877705902[/C][/ROW]
[ROW][C]30[/C][C]0.8244[/C][C]0.838310216816602[/C][C]-0.0139102168166024[/C][/ROW]
[ROW][C]31[/C][C]0.8487[/C][C]0.82383271503445[/C][C]0.0248672849655508[/C][/ROW]
[ROW][C]32[/C][C]0.8572[/C][C]0.851760035745586[/C][C]0.0054399642544144[/C][/ROW]
[ROW][C]33[/C][C]0.8214[/C][C]0.827581692861597[/C][C]-0.00618169286159735[/C][/ROW]
[ROW][C]34[/C][C]0.8827[/C][C]0.819016109040866[/C][C]0.0636838909591345[/C][/ROW]
[ROW][C]35[/C][C]0.9216[/C][C]0.875091016756638[/C][C]0.0465089832433617[/C][/ROW]
[ROW][C]36[/C][C]0.8865[/C][C]0.925557249371646[/C][C]-0.0390572493716464[/C][/ROW]
[ROW][C]37[/C][C]0.8816[/C][C]0.875769428207806[/C][C]0.00583057179219378[/C][/ROW]
[ROW][C]38[/C][C]0.8884[/C][C]0.859019242916405[/C][C]0.0293807570835953[/C][/ROW]
[ROW][C]39[/C][C]0.9466[/C][C]0.894208943746033[/C][C]0.0523910562539672[/C][/ROW]
[ROW][C]40[/C][C]0.918[/C][C]0.939016015103575[/C][C]-0.0210160151035753[/C][/ROW]
[ROW][C]41[/C][C]0.9337[/C][C]0.919081957058695[/C][C]0.0146180429413048[/C][/ROW]
[ROW][C]42[/C][C]0.9559[/C][C]0.934650840304796[/C][C]0.0212491596952039[/C][/ROW]
[ROW][C]43[/C][C]0.9626[/C][C]0.957502440700828[/C][C]0.00509755929917249[/C][/ROW]
[ROW][C]44[/C][C]0.9434[/C][C]0.956670178618916[/C][C]-0.0132701786189158[/C][/ROW]
[ROW][C]45[/C][C]0.8639[/C][C]0.896918372403417[/C][C]-0.0330183724034174[/C][/ROW]
[ROW][C]46[/C][C]0.7996[/C][C]0.842723486867272[/C][C]-0.0431234868672724[/C][/ROW]
[ROW][C]47[/C][C]0.668[/C][C]0.757702879691152[/C][C]-0.0897028796911517[/C][/ROW]
[ROW][C]48[/C][C]0.6572[/C][C]0.629064588268485[/C][C]0.0281354117315154[/C][/ROW]
[ROW][C]49[/C][C]0.6928[/C][C]0.672215565894725[/C][C]0.0205844341052748[/C][/ROW]
[ROW][C]50[/C][C]0.6438[/C][C]0.707752819492532[/C][C]-0.0639528194925323[/C][/ROW]
[ROW][C]51[/C][C]0.6454[/C][C]0.673424829195943[/C][C]-0.0280248291959435[/C][/ROW]
[ROW][C]52[/C][C]0.6873[/C][C]0.659012876953028[/C][C]0.0282871230469718[/C][/ROW]
[ROW][C]53[/C][C]0.7265[/C][C]0.738052767292165[/C][C]-0.0115527672921649[/C][/ROW]
[ROW][C]54[/C][C]0.7912[/C][C]0.758925039364845[/C][C]0.0322749606351555[/C][/ROW]
[ROW][C]55[/C][C]0.8114[/C][C]0.826316103828616[/C][C]-0.0149161038286159[/C][/ROW]
[ROW][C]56[/C][C]0.8281[/C][C]0.822504238600839[/C][C]0.00559576139916069[/C][/ROW]
[ROW][C]57[/C][C]0.8393[/C][C]0.81539766425251[/C][C]0.0239023357474900[/C][/ROW]
[/TABLE]
Source: https://freestatistics.org/blog/index.php?pk=57903&T=4

Globally Unique Identifier (entire table): ba.freestatistics.org/blog/index.php?pk=57903&T=4

As an alternative you can also use a QR Code:  

The GUIDs for individual cells are displayed in the table below:

Multiple Linear Regression - Actuals, Interpolation, and Residuals
Time or IndexActualsInterpolationForecastResidualsPrediction Error
10.7790.785707704326124-0.00670770432612371
20.77440.7583354423472750.0160645576527254
30.79050.7849361175198750.00556388248012521
40.77190.783064203985963-0.0111642039859629
50.78110.788392398065896-0.00729239806589634
60.75570.782794725323252-0.0270947253232522
70.76370.7505418318987240.0131581681012764
80.75950.773012541048404-0.0135125410484043
90.74710.7409682788709890.00613172112901088
100.76150.76719065843101-0.00569065843101006
110.74870.750060427014922-0.00136042701492153
120.73890.7376537371128390.00124626288716086
130.73370.743874585699766-0.0101745856997665
140.7510.726991206346190.0240087936538091
150.73820.769956341344496-0.0317563413444964
160.71590.730386757779805-0.0144867577798046
170.75420.7430542288061850.0111457711938155
180.76360.776119178190505-0.0125191781905048
190.74330.771506908537384-0.0282069085373837
200.76580.7500530059862550.015746994013745
210.76270.7535339916114860.00916600838851389
220.7480.762869745660852-0.014869745660852
230.76920.7246456765372890.0445543234627115
240.7850.775324425247030.00967557475297011
250.79130.800832715871578-0.00953271587157835
260.7720.777501288897598-0.00550128889759753
270.7880.7861737681936530.00182623180634735
280.8070.7886201461776290.0183798538223709
290.82680.83371864877706-0.00691864877705902
300.82440.838310216816602-0.0139102168166024
310.84870.823832715034450.0248672849655508
320.85720.8517600357455860.0054399642544144
330.82140.827581692861597-0.00618169286159735
340.88270.8190161090408660.0636838909591345
350.92160.8750910167566380.0465089832433617
360.88650.925557249371646-0.0390572493716464
370.88160.8757694282078060.00583057179219378
380.88840.8590192429164050.0293807570835953
390.94660.8942089437460330.0523910562539672
400.9180.939016015103575-0.0210160151035753
410.93370.9190819570586950.0146180429413048
420.95590.9346508403047960.0212491596952039
430.96260.9575024407008280.00509755929917249
440.94340.956670178618916-0.0132701786189158
450.86390.896918372403417-0.0330183724034174
460.79960.842723486867272-0.0431234868672724
470.6680.757702879691152-0.0897028796911517
480.65720.6290645882684850.0281354117315154
490.69280.6722155658947250.0205844341052748
500.64380.707752819492532-0.0639528194925323
510.64540.673424829195943-0.0280248291959435
520.68730.6590128769530280.0282871230469718
530.72650.738052767292165-0.0115527672921649
540.79120.7589250393648450.0322749606351555
550.81140.826316103828616-0.0149161038286159
560.82810.8225042386008390.00559576139916069
570.83930.815397664252510.0239023357474900


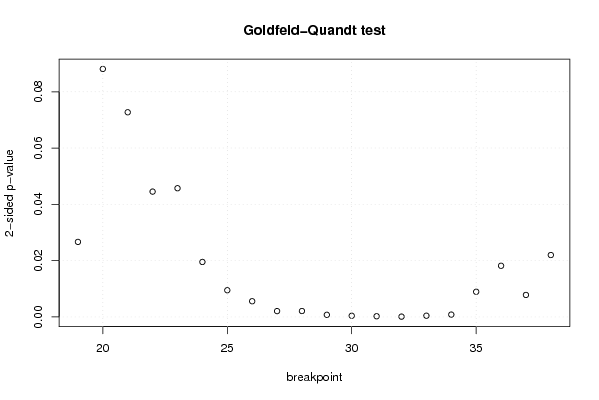
Goldfeld-Quandt test for Heteroskedasticity
p-valuesAlternative Hypothesis
breakpoint indexgreater2-sidedless
190.01332541489889050.02665082979778110.98667458510111
200.04405244682200350.0881048936440070.955947553177997
210.03635683630643380.07271367261286760.963643163693566
220.02226192750199890.04452385500399780.977738072498001
230.02286136441388520.04572272882777030.977138635586115
240.00976976458286150.0195395291657230.990230235417139
250.004742554823626910.009485109647253820.995257445176373
260.002788658970528580.005577317941057160.997211341029471
270.001037944819124660.002075889638249320.998962055180875
280.001049837942244180.002099675884488360.998950162057756
290.0003770566072654090.0007541132145308180.999622943392735
300.0002041263348365950.0004082526696731910.999795873665163
310.0001199848789589140.0002399697579178290.999880015121041
325.00010965545076e-050.0001000021931090150.999949998903445
330.0002167392440787870.0004334784881575750.999783260755921
340.0004145669010483880.0008291338020967770.999585433098952
350.004467778098722590.008935556197445180.995532221901277
360.009086636664851460.01817327332970290.990913363335149
370.003904985131296570.007809970262593130.996095014868703
380.01099663117282450.0219932623456490.989003368827176

\begin{tabular}{lllllllll}
\hline
Goldfeld-Quandt test for Heteroskedasticity \tabularnewline
p-values & Alternative Hypothesis \tabularnewline
breakpoint index & greater & 2-sided & less \tabularnewline
19 & 0.0133254148988905 & 0.0266508297977811 & 0.98667458510111 \tabularnewline
20 & 0.0440524468220035 & 0.088104893644007 & 0.955947553177997 \tabularnewline
21 & 0.0363568363064338 & 0.0727136726128676 & 0.963643163693566 \tabularnewline
22 & 0.0222619275019989 & 0.0445238550039978 & 0.977738072498001 \tabularnewline
23 & 0.0228613644138852 & 0.0457227288277703 & 0.977138635586115 \tabularnewline
24 & 0.0097697645828615 & 0.019539529165723 & 0.990230235417139 \tabularnewline
25 & 0.00474255482362691 & 0.00948510964725382 & 0.995257445176373 \tabularnewline
26 & 0.00278865897052858 & 0.00557731794105716 & 0.997211341029471 \tabularnewline
27 & 0.00103794481912466 & 0.00207588963824932 & 0.998962055180875 \tabularnewline
28 & 0.00104983794224418 & 0.00209967588448836 & 0.998950162057756 \tabularnewline
29 & 0.000377056607265409 & 0.000754113214530818 & 0.999622943392735 \tabularnewline
30 & 0.000204126334836595 & 0.000408252669673191 & 0.999795873665163 \tabularnewline
31 & 0.000119984878958914 & 0.000239969757917829 & 0.999880015121041 \tabularnewline
32 & 5.00010965545076e-05 & 0.000100002193109015 & 0.999949998903445 \tabularnewline
33 & 0.000216739244078787 & 0.000433478488157575 & 0.999783260755921 \tabularnewline
34 & 0.000414566901048388 & 0.000829133802096777 & 0.999585433098952 \tabularnewline
35 & 0.00446777809872259 & 0.00893555619744518 & 0.995532221901277 \tabularnewline
36 & 0.00908663666485146 & 0.0181732733297029 & 0.990913363335149 \tabularnewline
37 & 0.00390498513129657 & 0.00780997026259313 & 0.996095014868703 \tabularnewline
38 & 0.0109966311728245 & 0.021993262345649 & 0.989003368827176 \tabularnewline
\hline
\end{tabular}
%Source: https://freestatistics.org/blog/index.php?pk=57903&T=5

[TABLE]
[ROW][C]Goldfeld-Quandt test for Heteroskedasticity[/C][/ROW]
[ROW][C]p-values[/C][C]Alternative Hypothesis[/C][/ROW]
[ROW][C]breakpoint index[/C][C]greater[/C][C]2-sided[/C][C]less[/C][/ROW]
[ROW][C]19[/C][C]0.0133254148988905[/C][C]0.0266508297977811[/C][C]0.98667458510111[/C][/ROW]
[ROW][C]20[/C][C]0.0440524468220035[/C][C]0.088104893644007[/C][C]0.955947553177997[/C][/ROW]
[ROW][C]21[/C][C]0.0363568363064338[/C][C]0.0727136726128676[/C][C]0.963643163693566[/C][/ROW]
[ROW][C]22[/C][C]0.0222619275019989[/C][C]0.0445238550039978[/C][C]0.977738072498001[/C][/ROW]
[ROW][C]23[/C][C]0.0228613644138852[/C][C]0.0457227288277703[/C][C]0.977138635586115[/C][/ROW]
[ROW][C]24[/C][C]0.0097697645828615[/C][C]0.019539529165723[/C][C]0.990230235417139[/C][/ROW]
[ROW][C]25[/C][C]0.00474255482362691[/C][C]0.00948510964725382[/C][C]0.995257445176373[/C][/ROW]
[ROW][C]26[/C][C]0.00278865897052858[/C][C]0.00557731794105716[/C][C]0.997211341029471[/C][/ROW]
[ROW][C]27[/C][C]0.00103794481912466[/C][C]0.00207588963824932[/C][C]0.998962055180875[/C][/ROW]
[ROW][C]28[/C][C]0.00104983794224418[/C][C]0.00209967588448836[/C][C]0.998950162057756[/C][/ROW]
[ROW][C]29[/C][C]0.000377056607265409[/C][C]0.000754113214530818[/C][C]0.999622943392735[/C][/ROW]
[ROW][C]30[/C][C]0.000204126334836595[/C][C]0.000408252669673191[/C][C]0.999795873665163[/C][/ROW]
[ROW][C]31[/C][C]0.000119984878958914[/C][C]0.000239969757917829[/C][C]0.999880015121041[/C][/ROW]
[ROW][C]32[/C][C]5.00010965545076e-05[/C][C]0.000100002193109015[/C][C]0.999949998903445[/C][/ROW]
[ROW][C]33[/C][C]0.000216739244078787[/C][C]0.000433478488157575[/C][C]0.999783260755921[/C][/ROW]
[ROW][C]34[/C][C]0.000414566901048388[/C][C]0.000829133802096777[/C][C]0.999585433098952[/C][/ROW]
[ROW][C]35[/C][C]0.00446777809872259[/C][C]0.00893555619744518[/C][C]0.995532221901277[/C][/ROW]
[ROW][C]36[/C][C]0.00908663666485146[/C][C]0.0181732733297029[/C][C]0.990913363335149[/C][/ROW]
[ROW][C]37[/C][C]0.00390498513129657[/C][C]0.00780997026259313[/C][C]0.996095014868703[/C][/ROW]
[ROW][C]38[/C][C]0.0109966311728245[/C][C]0.021993262345649[/C][C]0.989003368827176[/C][/ROW]
[/TABLE]
Source: https://freestatistics.org/blog/index.php?pk=57903&T=5

Globally Unique Identifier (entire table): ba.freestatistics.org/blog/index.php?pk=57903&T=5

As an alternative you can also use a QR Code:  

The GUIDs for individual cells are displayed in the table below:

Goldfeld-Quandt test for Heteroskedasticity
p-valuesAlternative Hypothesis
breakpoint indexgreater2-sidedless
190.01332541489889050.02665082979778110.98667458510111
200.04405244682200350.0881048936440070.955947553177997
210.03635683630643380.07271367261286760.963643163693566
220.02226192750199890.04452385500399780.977738072498001
230.02286136441388520.04572272882777030.977138635586115
240.00976976458286150.0195395291657230.990230235417139
250.004742554823626910.009485109647253820.995257445176373
260.002788658970528580.005577317941057160.997211341029471
270.001037944819124660.002075889638249320.998962055180875
280.001049837942244180.002099675884488360.998950162057756
290.0003770566072654090.0007541132145308180.999622943392735
300.0002041263348365950.0004082526696731910.999795873665163
310.0001199848789589140.0002399697579178290.999880015121041
325.00010965545076e-050.0001000021931090150.999949998903445
330.0002167392440787870.0004334784881575750.999783260755921
340.0004145669010483880.0008291338020967770.999585433098952
350.004467778098722590.008935556197445180.995532221901277
360.009086636664851460.01817327332970290.990913363335149
370.003904985131296570.007809970262593130.996095014868703
380.01099663117282450.0219932623456490.989003368827176


Meta Analysis of Goldfeld-Quandt test for Heteroskedasticity
Description# significant tests% significant testsOK/NOK
1% type I error level120.6NOK
5% type I error level180.9NOK
10% type I error level201NOK

\begin{tabular}{lllllllll}
\hline
Meta Analysis of Goldfeld-Quandt test for Heteroskedasticity \tabularnewline
Description & # significant tests & % significant tests & OK/NOK \tabularnewline
1% type I error level & 12 & 0.6 & NOK \tabularnewline
5% type I error level & 18 & 0.9 & NOK \tabularnewline
10% type I error level & 20 & 1 & NOK \tabularnewline
\hline
\end{tabular}
%Source: https://freestatistics.org/blog/index.php?pk=57903&T=6

[TABLE]
[ROW][C]Meta Analysis of Goldfeld-Quandt test for Heteroskedasticity[/C][/ROW]
[ROW][C]Description[/C][C]# significant tests[/C][C]% significant tests[/C][C]OK/NOK[/C][/ROW]
[ROW][C]1% type I error level[/C][C]12[/C][C]0.6[/C][C]NOK[/C][/ROW]
[ROW][C]5% type I error level[/C][C]18[/C][C]0.9[/C][C]NOK[/C][/ROW]
[ROW][C]10% type I error level[/C][C]20[/C][C]1[/C][C]NOK[/C][/ROW]
[/TABLE]
Source: https://freestatistics.org/blog/index.php?pk=57903&T=6

Globally Unique Identifier (entire table): ba.freestatistics.org/blog/index.php?pk=57903&T=6

As an alternative you can also use a QR Code:  

The GUIDs for individual cells are displayed in the table below:

Meta Analysis of Goldfeld-Quandt test for Heteroskedasticity
Description# significant tests% significant testsOK/NOK
1% type I error level120.6NOK
5% type I error level180.9NOK
10% type I error level201NOK


Parameters (Session):
par1 = 1 ; par2 = Include Monthly Dummies ; par3 = Linear Trend ;
Parameters (R input):
par1 = 1 ; par2 = Include Monthly Dummies ; par3 = Linear Trend ;
R code (references can be found in the software module):
library(lattice)
library(lmtest)
n25 <- 25 #minimum number of obs. for Goldfeld-Quandt test
par1 <- as.numeric(par1)
x <- t(y)
k <- length(x[1,])
n <- length(x[,1])
x1 <- cbind(x[,par1], x[,1:k!=par1])
mycolnames <- c(colnames(x)[par1], colnames(x)[1:k!=par1])
colnames(x1) <- mycolnames #colnames(x)[par1]
x <- x1
if (par3 == 'First Differences'){
x2 <- array(0, dim=c(n-1,k), dimnames=list(1:(n-1), paste('(1-B)',colnames(x),sep='')))
for (i in 1:n-1) {
for (j in 1:k) {
x2[i,j] <- x[i+1,j] - x[i,j]
}
}
x <- x2
}
if (par2 == 'Include Monthly Dummies'){
x2 <- array(0, dim=c(n,11), dimnames=list(1:n, paste('M', seq(1:11), sep ='')))
for (i in 1:11){
x2[seq(i,n,12),i] <- 1
}
x <- cbind(x, x2)
}
if (par2 == 'Include Quarterly Dummies'){
x2 <- array(0, dim=c(n,3), dimnames=list(1:n, paste('Q', seq(1:3), sep ='')))
for (i in 1:3){
x2[seq(i,n,4),i] <- 1
}
x <- cbind(x, x2)
}
k <- length(x[1,])
if (par3 == 'Linear Trend'){
x <- cbind(x, c(1:n))
colnames(x)[k+1] <- 't'
}
x
k <- length(x[1,])
df <- as.data.frame(x)
(mylm <- lm(df))
(mysum <- summary(mylm))
if (n > n25) {
kp3 <- k + 3
nmkm3 <- n - k - 3
gqarr <- array(NA, dim=c(nmkm3-kp3+1,3))
numgqtests <- 0
numsignificant1 <- 0
numsignificant5 <- 0
numsignificant10 <- 0
for (mypoint in kp3:nmkm3) {
j <- 0
numgqtests <- numgqtests + 1
for (myalt in c('greater', 'two.sided', 'less')) {
j <- j + 1
gqarr[mypoint-kp3+1,j] <- gqtest(mylm, point=mypoint, alternative=myalt)$p.value
}
if (gqarr[mypoint-kp3+1,2] < 0.01) numsignificant1 <- numsignificant1 + 1
if (gqarr[mypoint-kp3+1,2] < 0.05) numsignificant5 <- numsignificant5 + 1
if (gqarr[mypoint-kp3+1,2] < 0.10) numsignificant10 <- numsignificant10 + 1
}
gqarr
}
bitmap(file='test0.png')
plot(x[,1], type='l', main='Actuals and Interpolation', ylab='value of Actuals and Interpolation (dots)', xlab='time or index')
points(x[,1]-mysum$resid)
grid()
dev.off()
bitmap(file='test1.png')
plot(mysum$resid, type='b', pch=19, main='Residuals', ylab='value of Residuals', xlab='time or index')
grid()
dev.off()
bitmap(file='test2.png')
hist(mysum$resid, main='Residual Histogram', xlab='values of Residuals')
grid()
dev.off()
bitmap(file='test3.png')
densityplot(~mysum$resid,col='black',main='Residual Density Plot', xlab='values of Residuals')
dev.off()
bitmap(file='test4.png')
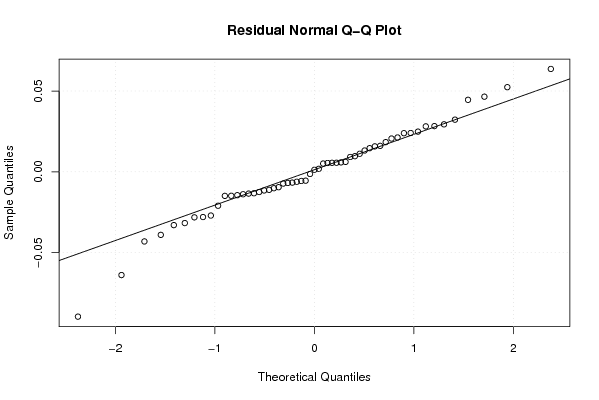
qqnorm(mysum$resid, main='Residual Normal Q-Q Plot')
qqline(mysum$resid)
grid()
dev.off()
(myerror <- as.ts(mysum$resid))
bitmap(file='test5.png')
dum <- cbind(lag(myerror,k=1),myerror)
dum
dum1 <- dum[2:length(myerror),]
dum1
z <- as.data.frame(dum1)
z
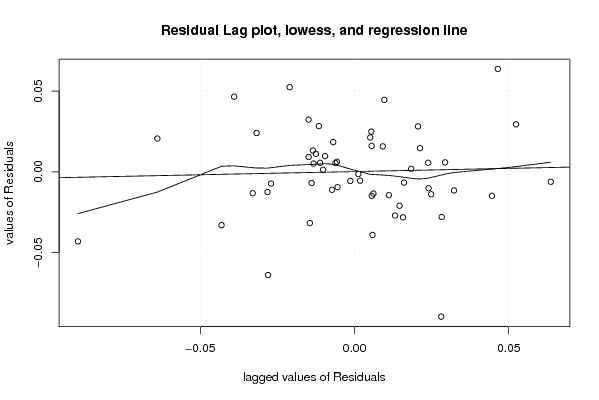
plot(z,main=paste('Residual Lag plot, lowess, and regression line'), ylab='values of Residuals', xlab='lagged values of Residuals')
lines(lowess(z))
abline(lm(z))
grid()
dev.off()
bitmap(file='test6.png')
acf(mysum$resid, lag.max=length(mysum$resid)/2, main='Residual Autocorrelation Function')
grid()
dev.off()
bitmap(file='test7.png')
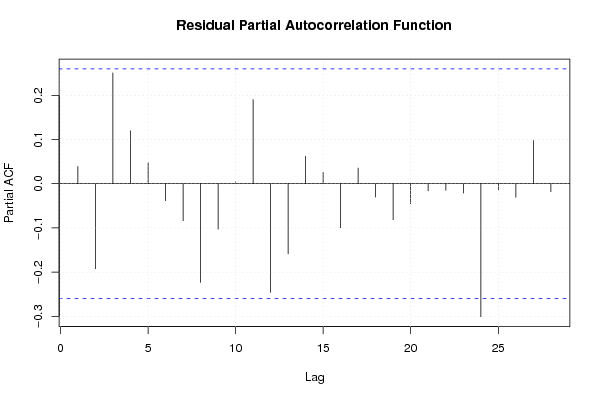
pacf(mysum$resid, lag.max=length(mysum$resid)/2, main='Residual Partial Autocorrelation Function')
grid()
dev.off()
bitmap(file='test8.png')
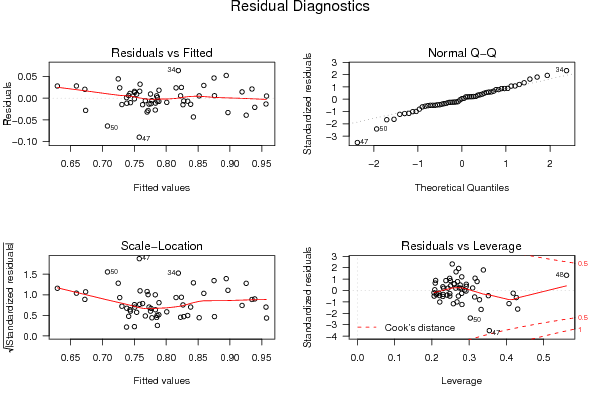
opar <- par(mfrow = c(2,2), oma = c(0, 0, 1.1, 0))
plot(mylm, las = 1, sub='Residual Diagnostics')
par(opar)
dev.off()
if (n > n25) {
bitmap(file='test9.png')
plot(kp3:nmkm3,gqarr[,2], main='Goldfeld-Quandt test',ylab='2-sided p-value',xlab='breakpoint')
grid()
dev.off()
}
load(file='createtable')
a<-table.start()
a<-table.row.start(a)
a<-table.element(a, 'Multiple Linear Regression - Estimated Regression Equation', 1, TRUE)
a<-table.row.end(a)
myeq <- colnames(x)[1]
myeq <- paste(myeq, '[t] = ', sep='')
for (i in 1:k){
if (mysum$coefficients[i,1] > 0) myeq <- paste(myeq, '+', '')
myeq <- paste(myeq, mysum$coefficients[i,1], sep=' ')
if (rownames(mysum$coefficients)[i] != '(Intercept)') {
myeq <- paste(myeq, rownames(mysum$coefficients)[i], sep='')
if (rownames(mysum$coefficients)[i] != 't') myeq <- paste(myeq, '[t]', sep='')
}
}
myeq <- paste(myeq, ' + e[t]')
a<-table.row.start(a)
a<-table.element(a, myeq)
a<-table.row.end(a)
a<-table.end(a)
table.save(a,file='mytable1.tab')
a<-table.start()
a<-table.row.start(a)
a<-table.element(a,hyperlink('ols1.htm','Multiple Linear Regression - Ordinary Least Squares',''), 6, TRUE)
a<-table.row.end(a)
a<-table.row.start(a)
a<-table.element(a,'Variable',header=TRUE)
a<-table.element(a,'Parameter',header=TRUE)
a<-table.element(a,'S.D.',header=TRUE)
a<-table.element(a,'T-STAT
H0: parameter = 0',header=TRUE)
a<-table.element(a,'2-tail p-value',header=TRUE)
a<-table.element(a,'1-tail p-value',header=TRUE)
a<-table.row.end(a)
for (i in 1:k){
a<-table.row.start(a)
a<-table.element(a,rownames(mysum$coefficients)[i],header=TRUE)
a<-table.element(a,mysum$coefficients[i,1])
a<-table.element(a, round(mysum$coefficients[i,2],6))
a<-table.element(a, round(mysum$coefficients[i,3],4))
a<-table.element(a, round(mysum$coefficients[i,4],6))
a<-table.element(a, round(mysum$coefficients[i,4]/2,6))
a<-table.row.end(a)
}
a<-table.end(a)
table.save(a,file='mytable2.tab')
a<-table.start()
a<-table.row.start(a)
a<-table.element(a, 'Multiple Linear Regression - Regression Statistics', 2, TRUE)
a<-table.row.end(a)
a<-table.row.start(a)
a<-table.element(a, 'Multiple R',1,TRUE)
a<-table.element(a, sqrt(mysum$r.squared))
a<-table.row.end(a)
a<-table.row.start(a)
a<-table.element(a, 'R-squared',1,TRUE)
a<-table.element(a, mysum$r.squared)
a<-table.row.end(a)
a<-table.row.start(a)
a<-table.element(a, 'Adjusted R-squared',1,TRUE)
a<-table.element(a, mysum$adj.r.squared)
a<-table.row.end(a)
a<-table.row.start(a)
a<-table.element(a, 'F-TEST (value)',1,TRUE)
a<-table.element(a, mysum$fstatistic[1])
a<-table.row.end(a)
a<-table.row.start(a)
a<-table.element(a, 'F-TEST (DF numerator)',1,TRUE)
a<-table.element(a, mysum$fstatistic[2])
a<-table.row.end(a)
a<-table.row.start(a)
a<-table.element(a, 'F-TEST (DF denominator)',1,TRUE)
a<-table.element(a, mysum$fstatistic[3])
a<-table.row.end(a)
a<-table.row.start(a)
a<-table.element(a, 'p-value',1,TRUE)
a<-table.element(a, 1-pf(mysum$fstatistic[1],mysum$fstatistic[2],mysum$fstatistic[3]))
a<-table.row.end(a)
a<-table.row.start(a)
a<-table.element(a, 'Multiple Linear Regression - Residual Statistics', 2, TRUE)
a<-table.row.end(a)
a<-table.row.start(a)
a<-table.element(a, 'Residual Standard Deviation',1,TRUE)
a<-table.element(a, mysum$sigma)
a<-table.row.end(a)
a<-table.row.start(a)
a<-table.element(a, 'Sum Squared Residuals',1,TRUE)
a<-table.element(a, sum(myerror*myerror))
a<-table.row.end(a)
a<-table.end(a)
table.save(a,file='mytable3.tab')
a<-table.start()
a<-table.row.start(a)
a<-table.element(a, 'Multiple Linear Regression - Actuals, Interpolation, and Residuals', 4, TRUE)
a<-table.row.end(a)
a<-table.row.start(a)
a<-table.element(a, 'Time or Index', 1, TRUE)
a<-table.element(a, 'Actuals', 1, TRUE)
a<-table.element(a, 'Interpolation
Forecast', 1, TRUE)
a<-table.element(a, 'Residuals
Prediction Error', 1, TRUE)
a<-table.row.end(a)
for (i in 1:n) {
a<-table.row.start(a)
a<-table.element(a,i, 1, TRUE)
a<-table.element(a,x[i])
a<-table.element(a,x[i]-mysum$resid[i])
a<-table.element(a,mysum$resid[i])
a<-table.row.end(a)
}
a<-table.end(a)
table.save(a,file='mytable4.tab')
if (n > n25) {
a<-table.start()
a<-table.row.start(a)
a<-table.element(a,'Goldfeld-Quandt test for Heteroskedasticity',4,TRUE)
a<-table.row.end(a)
a<-table.row.start(a)
a<-table.element(a,'p-values',header=TRUE)
a<-table.element(a,'Alternative Hypothesis',3,header=TRUE)
a<-table.row.end(a)
a<-table.row.start(a)
a<-table.element(a,'breakpoint index',header=TRUE)
a<-table.element(a,'greater',header=TRUE)
a<-table.element(a,'2-sided',header=TRUE)
a<-table.element(a,'less',header=TRUE)
a<-table.row.end(a)
for (mypoint in kp3:nmkm3) {
a<-table.row.start(a)
a<-table.element(a,mypoint,header=TRUE)
a<-table.element(a,gqarr[mypoint-kp3+1,1])
a<-table.element(a,gqarr[mypoint-kp3+1,2])
a<-table.element(a,gqarr[mypoint-kp3+1,3])
a<-table.row.end(a)
}
a<-table.end(a)
table.save(a,file='mytable5.tab')
a<-table.start()
a<-table.row.start(a)
a<-table.element(a,'Meta Analysis of Goldfeld-Quandt test for Heteroskedasticity',4,TRUE)
a<-table.row.end(a)
a<-table.row.start(a)
a<-table.element(a,'Description',header=TRUE)
a<-table.element(a,'# significant tests',header=TRUE)
a<-table.element(a,'% significant tests',header=TRUE)
a<-table.element(a,'OK/NOK',header=TRUE)
a<-table.row.end(a)
a<-table.row.start(a)
a<-table.element(a,'1% type I error level',header=TRUE)
a<-table.element(a,numsignificant1)
a<-table.element(a,numsignificant1/numgqtests)
if (numsignificant1/numgqtests < 0.01) dum <- 'OK' else dum <- 'NOK'
a<-table.element(a,dum)
a<-table.row.end(a)
a<-table.row.start(a)
a<-table.element(a,'5% type I error level',header=TRUE)
a<-table.element(a,numsignificant5)
a<-table.element(a,numsignificant5/numgqtests)
if (numsignificant5/numgqtests < 0.05) dum <- 'OK' else dum <- 'NOK'
a<-table.element(a,dum)
a<-table.row.end(a)
a<-table.row.start(a)
a<-table.element(a,'10% type I error level',header=TRUE)
a<-table.element(a,numsignificant10)
a<-table.element(a,numsignificant10/numgqtests)
if (numsignificant10/numgqtests < 0.1) dum <- 'OK' else dum <- 'NOK'
a<-table.element(a,dum)
a<-table.row.end(a)
a<-table.end(a)
table.save(a,file='mytable6.tab')
}