Free Statistics

of Irreproducible Research!

Author's title

Author*The author of this computation has been verified*
R Software Modulerwasp_multipleregression.wasp
Title produced by softwareMultiple Regression
Date of computationThu, 19 Nov 2009 12:11:30 -0700
Cite this page as followsStatistical Computations at FreeStatistics.org, Office for Research Development and Education, URL https://freestatistics.org/blog/index.php?v=date/2009/Nov/19/t12586579245zlflrj8daehne3.htm/, Retrieved Thu, 25 Apr 2024 21:05:22 +0000
Statistical Computations at FreeStatistics.org, Office for Research Development and Education, URL https://freestatistics.org/blog/index.php?pk=57902, Retrieved Thu, 25 Apr 2024 21:05:22 +0000
QR Codes:

Original text written by user:
IsPrivate?No (this computation is public)
User-defined keywords
Estimated Impact154
Family? (F = Feedback message, R = changed R code, M = changed R Module, P = changed Parameters, D = changed Data)
-     [Multiple Regression] [Q1 The Seatbeltlaw] [2007-11-14 19:27:43] [8cd6641b921d30ebe00b648d1481bba0]
- RMPD  [Multiple Regression] [Seatbelt] [2009-11-12 14:03:14] [b98453cac15ba1066b407e146608df68]
-    D      [Multiple Regression] [WS 7 Multiple reg...] [2009-11-19 19:11:30] [eba9f01697e64705b70041e6f338cb22] [Current]
-   P         [Multiple Regression] [] [2009-11-26 18:31:17] [1e83ffa964db6f7ea6ccc4e7b5acbbff]
Feedback Forum

Post a new message
Dataseries X:
108.01	102.9
101.21	97.4
119.93	111.4
94.76	87.4
95.26	96.8
117.96	114.1
115.86	110.3
111.44	103.9
108.16	101.6
108.77	94.6
109.45	95.9
124.83	104.7
115.31	102.8
109.49	98.1
124.24	113.9
92.85	80.9
98.42	95.7
120.88	113.2
111.72	105.9
116.1	108.8
109.37	102.3
111.65	99
114.29	100.7
133.68	115.5
114.27	100.7
126.49	109.9
131	114.6
104	85.4
108.88	100.5
128.48	114.8
132.44	116.5
128.04	112.9
116.35	102
120.93	106
118.59	105.3
133.1	118.8
121.05	106.1
127.62	109.3
135.44	117.2
114.88	92.5
114.34	104.2
128.85	112.5
138.9	122.4
129.44	113.3
114.96	100
127.98	110.7
127.03	112.8
128.75	109.8
137.91	117.3
128.37	109.1
135.9	115.9
122.19	96
113.08	99.8
136.2	116.8
138	115.7
115.24	99.4
110.95	94.3
99.23	91
102.39	93.2
112.67	103.1


Summary of computational transaction
Raw Inputview raw input (R code)
Raw Outputview raw output of R engine
Computing time6 seconds
R Server'Gwilym Jenkins' @ 72.249.127.135

\begin{tabular}{lllllllll}
\hline
Summary of computational transaction \tabularnewline
Raw Input & view raw input (R code)  \tabularnewline
Raw Output & view raw output of R engine  \tabularnewline
Computing time & 6 seconds \tabularnewline
R Server & 'Gwilym Jenkins' @ 72.249.127.135 \tabularnewline
\hline
\end{tabular}
%Source: https://freestatistics.org/blog/index.php?pk=57902&T=0

[TABLE]
[ROW][C]Summary of computational transaction[/C][/ROW]
[ROW][C]Raw Input[/C][C]view raw input (R code) [/C][/ROW]
[ROW][C]Raw Output[/C][C]view raw output of R engine [/C][/ROW]
[ROW][C]Computing time[/C][C]6 seconds[/C][/ROW]
[ROW][C]R Server[/C][C]'Gwilym Jenkins' @ 72.249.127.135[/C][/ROW]
[/TABLE]
Source: https://freestatistics.org/blog/index.php?pk=57902&T=0

Globally Unique Identifier (entire table): ba.freestatistics.org/blog/index.php?pk=57902&T=0

As an alternative you can also use a QR Code:  

The GUIDs for individual cells are displayed in the table below:

Summary of computational transaction
Raw Inputview raw input (R code)
Raw Outputview raw output of R engine
Computing time6 seconds
R Server'Gwilym Jenkins' @ 72.249.127.135


Multiple Linear Regression - Estimated Regression Equation
Y(omzet)[t] = -37.7533688137505 + 1.48903215087652`X(prod)`[t] -0.714477893125787M1[t] + 0.398360687926065M2[t] -3.58771567669893M3[t] + 11.7993653902309M4[t] -4.26042698337578M5[t] -5.93922538841844M6[t] -4.85054153031326M7[t] -2.50383254961587M8[t] + 0.748592440063247M9[t] + 2.17500536687042M10[t] + 0.847482927713403M11[t] + e[t]

\begin{tabular}{lllllllll}
\hline
Multiple Linear Regression - Estimated Regression Equation \tabularnewline
Y(omzet)[t] =  -37.7533688137505 +  1.48903215087652`X(prod)`[t] -0.714477893125787M1[t] +  0.398360687926065M2[t] -3.58771567669893M3[t] +  11.7993653902309M4[t] -4.26042698337578M5[t] -5.93922538841844M6[t] -4.85054153031326M7[t] -2.50383254961587M8[t] +  0.748592440063247M9[t] +  2.17500536687042M10[t] +  0.847482927713403M11[t]  + e[t] \tabularnewline
\hline
\end{tabular}
%Source: https://freestatistics.org/blog/index.php?pk=57902&T=1

[TABLE]
[ROW][C]Multiple Linear Regression - Estimated Regression Equation[/C][/ROW]
[ROW][C]Y(omzet)[t] =  -37.7533688137505 +  1.48903215087652`X(prod)`[t] -0.714477893125787M1[t] +  0.398360687926065M2[t] -3.58771567669893M3[t] +  11.7993653902309M4[t] -4.26042698337578M5[t] -5.93922538841844M6[t] -4.85054153031326M7[t] -2.50383254961587M8[t] +  0.748592440063247M9[t] +  2.17500536687042M10[t] +  0.847482927713403M11[t]  + e[t][/C][/ROW]
[/TABLE]
Source: https://freestatistics.org/blog/index.php?pk=57902&T=1

Globally Unique Identifier (entire table): ba.freestatistics.org/blog/index.php?pk=57902&T=1

As an alternative you can also use a QR Code:  

The GUIDs for individual cells are displayed in the table below:

Multiple Linear Regression - Estimated Regression Equation
Y(omzet)[t] = -37.7533688137505 + 1.48903215087652`X(prod)`[t] -0.714477893125787M1[t] + 0.398360687926065M2[t] -3.58771567669893M3[t] + 11.7993653902309M4[t] -4.26042698337578M5[t] -5.93922538841844M6[t] -4.85054153031326M7[t] -2.50383254961587M8[t] + 0.748592440063247M9[t] + 2.17500536687042M10[t] + 0.847482927713403M11[t] + e[t]


Multiple Linear Regression - Ordinary Least Squares
VariableParameterS.D.T-STATH0: parameter = 02-tail p-value1-tail p-value
(Intercept)-37.753368813750513.371138-2.82350.0069460.003473
`X(prod)`1.489032150876520.11958812.451400
M1-0.7144778931257873.06093-0.23340.816450.408225
M20.3983606879260653.0889470.1290.8979370.448969
M3-3.587715676698933.056891-1.17360.2464490.123225
M411.79936539023093.9967472.95220.0049110.002455
M5-4.260426983375783.288474-1.29560.2014530.100726
M6-5.939225388418443.050807-1.94680.0575520.028776
M7-4.850541530313263.048646-1.5910.1183030.059152
M8-2.503832549615873.032442-0.82570.4131560.206578
M90.7485924400632473.2586690.22970.8193040.409652
M102.175005366870423.2487770.66950.5064620.253231
M110.8474829277134033.1933350.26540.7918690.395934

\begin{tabular}{lllllllll}
\hline
Multiple Linear Regression - Ordinary Least Squares \tabularnewline
Variable & Parameter & S.D. & T-STATH0: parameter = 0 & 2-tail p-value & 1-tail p-value \tabularnewline
(Intercept) & -37.7533688137505 & 13.371138 & -2.8235 & 0.006946 & 0.003473 \tabularnewline
`X(prod)` & 1.48903215087652 & 0.119588 & 12.4514 & 0 & 0 \tabularnewline
M1 & -0.714477893125787 & 3.06093 & -0.2334 & 0.81645 & 0.408225 \tabularnewline
M2 & 0.398360687926065 & 3.088947 & 0.129 & 0.897937 & 0.448969 \tabularnewline
M3 & -3.58771567669893 & 3.056891 & -1.1736 & 0.246449 & 0.123225 \tabularnewline
M4 & 11.7993653902309 & 3.996747 & 2.9522 & 0.004911 & 0.002455 \tabularnewline
M5 & -4.26042698337578 & 3.288474 & -1.2956 & 0.201453 & 0.100726 \tabularnewline
M6 & -5.93922538841844 & 3.050807 & -1.9468 & 0.057552 & 0.028776 \tabularnewline
M7 & -4.85054153031326 & 3.048646 & -1.591 & 0.118303 & 0.059152 \tabularnewline
M8 & -2.50383254961587 & 3.032442 & -0.8257 & 0.413156 & 0.206578 \tabularnewline
M9 & 0.748592440063247 & 3.258669 & 0.2297 & 0.819304 & 0.409652 \tabularnewline
M10 & 2.17500536687042 & 3.248777 & 0.6695 & 0.506462 & 0.253231 \tabularnewline
M11 & 0.847482927713403 & 3.193335 & 0.2654 & 0.791869 & 0.395934 \tabularnewline
\hline
\end{tabular}
%Source: https://freestatistics.org/blog/index.php?pk=57902&T=2

[TABLE]
[ROW][C]Multiple Linear Regression - Ordinary Least Squares[/C][/ROW]
[ROW][C]Variable[/C][C]Parameter[/C][C]S.D.[/C][C]T-STATH0: parameter = 0[/C][C]2-tail p-value[/C][C]1-tail p-value[/C][/ROW]
[ROW][C](Intercept)[/C][C]-37.7533688137505[/C][C]13.371138[/C][C]-2.8235[/C][C]0.006946[/C][C]0.003473[/C][/ROW]
[ROW][C]`X(prod)`[/C][C]1.48903215087652[/C][C]0.119588[/C][C]12.4514[/C][C]0[/C][C]0[/C][/ROW]
[ROW][C]M1[/C][C]-0.714477893125787[/C][C]3.06093[/C][C]-0.2334[/C][C]0.81645[/C][C]0.408225[/C][/ROW]
[ROW][C]M2[/C][C]0.398360687926065[/C][C]3.088947[/C][C]0.129[/C][C]0.897937[/C][C]0.448969[/C][/ROW]
[ROW][C]M3[/C][C]-3.58771567669893[/C][C]3.056891[/C][C]-1.1736[/C][C]0.246449[/C][C]0.123225[/C][/ROW]
[ROW][C]M4[/C][C]11.7993653902309[/C][C]3.996747[/C][C]2.9522[/C][C]0.004911[/C][C]0.002455[/C][/ROW]
[ROW][C]M5[/C][C]-4.26042698337578[/C][C]3.288474[/C][C]-1.2956[/C][C]0.201453[/C][C]0.100726[/C][/ROW]
[ROW][C]M6[/C][C]-5.93922538841844[/C][C]3.050807[/C][C]-1.9468[/C][C]0.057552[/C][C]0.028776[/C][/ROW]
[ROW][C]M7[/C][C]-4.85054153031326[/C][C]3.048646[/C][C]-1.591[/C][C]0.118303[/C][C]0.059152[/C][/ROW]
[ROW][C]M8[/C][C]-2.50383254961587[/C][C]3.032442[/C][C]-0.8257[/C][C]0.413156[/C][C]0.206578[/C][/ROW]
[ROW][C]M9[/C][C]0.748592440063247[/C][C]3.258669[/C][C]0.2297[/C][C]0.819304[/C][C]0.409652[/C][/ROW]
[ROW][C]M10[/C][C]2.17500536687042[/C][C]3.248777[/C][C]0.6695[/C][C]0.506462[/C][C]0.253231[/C][/ROW]
[ROW][C]M11[/C][C]0.847482927713403[/C][C]3.193335[/C][C]0.2654[/C][C]0.791869[/C][C]0.395934[/C][/ROW]
[/TABLE]
Source: https://freestatistics.org/blog/index.php?pk=57902&T=2

Globally Unique Identifier (entire table): ba.freestatistics.org/blog/index.php?pk=57902&T=2

As an alternative you can also use a QR Code:  

The GUIDs for individual cells are displayed in the table below:

Multiple Linear Regression - Ordinary Least Squares
VariableParameterS.D.T-STATH0: parameter = 02-tail p-value1-tail p-value
(Intercept)-37.753368813750513.371138-2.82350.0069460.003473
`X(prod)`1.489032150876520.11958812.451400
M1-0.7144778931257873.06093-0.23340.816450.408225
M20.3983606879260653.0889470.1290.8979370.448969
M3-3.587715676698933.056891-1.17360.2464490.123225
M411.79936539023093.9967472.95220.0049110.002455
M5-4.260426983375783.288474-1.29560.2014530.100726
M6-5.939225388418443.050807-1.94680.0575520.028776
M7-4.850541530313263.048646-1.5910.1183030.059152
M8-2.503832549615873.032442-0.82570.4131560.206578
M90.7485924400632473.2586690.22970.8193040.409652
M102.175005366870423.2487770.66950.5064620.253231
M110.8474829277134033.1933350.26540.7918690.395934


Multiple Linear Regression - Regression Statistics
Multiple R0.932939088464168
R-squared0.870375342784353
Adjusted R-squared0.837279685622912
F-TEST (value)26.2987780704469
F-TEST (DF numerator)12
F-TEST (DF denominator)47
p-value0
Multiple Linear Regression - Residual Statistics
Residual Standard Deviation4.76704844747167
Sum Squared Residuals1068.06329232548

\begin{tabular}{lllllllll}
\hline
Multiple Linear Regression - Regression Statistics \tabularnewline
Multiple R & 0.932939088464168 \tabularnewline
R-squared & 0.870375342784353 \tabularnewline
Adjusted R-squared & 0.837279685622912 \tabularnewline
F-TEST (value) & 26.2987780704469 \tabularnewline
F-TEST (DF numerator) & 12 \tabularnewline
F-TEST (DF denominator) & 47 \tabularnewline
p-value & 0 \tabularnewline
Multiple Linear Regression - Residual Statistics \tabularnewline
Residual Standard Deviation & 4.76704844747167 \tabularnewline
Sum Squared Residuals & 1068.06329232548 \tabularnewline
\hline
\end{tabular}
%Source: https://freestatistics.org/blog/index.php?pk=57902&T=3

[TABLE]
[ROW][C]Multiple Linear Regression - Regression Statistics[/C][/ROW]
[ROW][C]Multiple R[/C][C]0.932939088464168[/C][/ROW]
[ROW][C]R-squared[/C][C]0.870375342784353[/C][/ROW]
[ROW][C]Adjusted R-squared[/C][C]0.837279685622912[/C][/ROW]
[ROW][C]F-TEST (value)[/C][C]26.2987780704469[/C][/ROW]
[ROW][C]F-TEST (DF numerator)[/C][C]12[/C][/ROW]
[ROW][C]F-TEST (DF denominator)[/C][C]47[/C][/ROW]
[ROW][C]p-value[/C][C]0[/C][/ROW]
[ROW][C]Multiple Linear Regression - Residual Statistics[/C][/ROW]
[ROW][C]Residual Standard Deviation[/C][C]4.76704844747167[/C][/ROW]
[ROW][C]Sum Squared Residuals[/C][C]1068.06329232548[/C][/ROW]
[/TABLE]
Source: https://freestatistics.org/blog/index.php?pk=57902&T=3

Globally Unique Identifier (entire table): ba.freestatistics.org/blog/index.php?pk=57902&T=3

As an alternative you can also use a QR Code:  

The GUIDs for individual cells are displayed in the table below:

Multiple Linear Regression - Regression Statistics
Multiple R0.932939088464168
R-squared0.870375342784353
Adjusted R-squared0.837279685622912
F-TEST (value)26.2987780704469
F-TEST (DF numerator)12
F-TEST (DF denominator)47
p-value0
Multiple Linear Regression - Residual Statistics
Residual Standard Deviation4.76704844747167
Sum Squared Residuals1068.06329232548


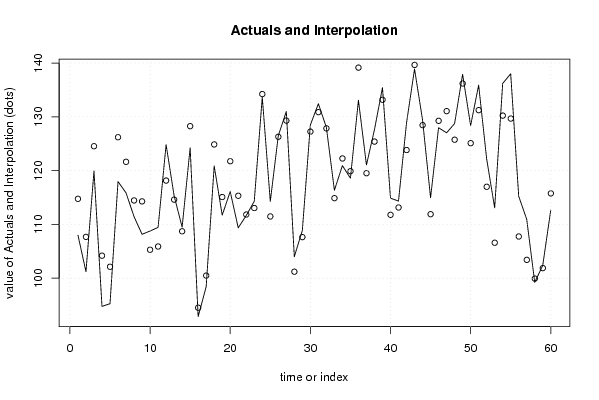
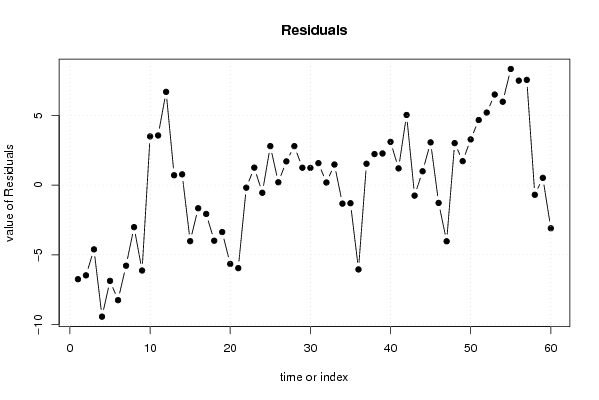
Multiple Linear Regression - Actuals, Interpolation, and Residuals
Time or IndexActualsInterpolationForecastResidualsPrediction Error
1108.01114.753561618318-6.74356161831793
2101.21107.676723369549-6.46672336954877
3119.93124.537097117195-4.60709711719513
494.76104.187406563088-9.4274065630884
595.26102.124516407721-6.86451640772103
6117.96126.205974212842-8.24597421284223
7115.86121.636335897617-5.77633589761661
8111.44114.453239112704-3.01323911270428
9108.16114.280890155367-6.12089015536737
10108.77105.2840780260393.48592197396112
11109.45105.8922973830213.55770261697864
12124.83118.1482973830216.68170261697865
13115.31114.6046584032300.705341596769839
14109.49108.7190458751620.770954124837636
15124.24128.259677494386-4.01967749438644
1692.8594.508697582391-1.65869758239103
1798.42100.486581041757-2.06658104175687
18120.88124.865845277053-3.98584527705336
19111.72115.08459443376-3.36459443375993
20116.1121.749496651999-5.64949665199923
21109.37115.323212660981-5.95321266098093
22111.65111.835819489896-0.185819489895579
23114.29113.0396517072291.25034829277134
24133.68134.229844612488-0.549844612487789
25114.27111.4776908863892.79230911361052
26126.49126.2896252555050.200374744494649
27131129.3021.69800000000001
28104101.2093422613352.79065773866463
29108.88107.6339353659641.24606463403582
30128.48127.2482967184561.23170328154421
31132.44130.8683352330511.57166476694894
32128.04127.8545284705930.185471529407012
33116.35114.8765030157181.47349698428201
34120.93122.259044546031-1.32904454603124
35118.59119.889199601261-1.29919960126066
36133.1139.143650710380-6.04365071038032
37121.05119.5184645011231.53153549887731
38127.62125.3962059649792.22379403502059
39135.44133.1734835922792.26651640772104
40114.88111.7814705325593.09852946744132
41114.34113.1433543242071.19664567579269
42128.85123.8235227714405.02647722856021
43138.9139.653624923223-0.753624923222548
44129.44128.4501413309440.989858669056423
45114.96111.8984387139653.06156128603505
46127.98129.257495655151-1.2774956551509
47127.03131.056940732835-4.02694073283458
48128.75125.7423613524923.00763864750839
49137.91136.1956245909401.71437540906025
50128.37125.0983995348043.27160046519589
51135.9131.2377417961394.66225820386052
52122.19116.9930830606275.19691693937349
53113.08106.5916128603516.48838713964939
54136.2130.2263610202095.97363897979116
55138129.6771095123508.32289048765015
56115.24107.752594433767.48740556624007
57110.95103.4109554539697.53904454603125
5899.2399.9235622828834-0.693562282883395
59102.39101.8719105756550.518089424345254
60112.67115.765845941619-3.09584594161890

\begin{tabular}{lllllllll}
\hline
Multiple Linear Regression - Actuals, Interpolation, and Residuals \tabularnewline
Time or Index & Actuals & InterpolationForecast & ResidualsPrediction Error \tabularnewline
1 & 108.01 & 114.753561618318 & -6.74356161831793 \tabularnewline
2 & 101.21 & 107.676723369549 & -6.46672336954877 \tabularnewline
3 & 119.93 & 124.537097117195 & -4.60709711719513 \tabularnewline
4 & 94.76 & 104.187406563088 & -9.4274065630884 \tabularnewline
5 & 95.26 & 102.124516407721 & -6.86451640772103 \tabularnewline
6 & 117.96 & 126.205974212842 & -8.24597421284223 \tabularnewline
7 & 115.86 & 121.636335897617 & -5.77633589761661 \tabularnewline
8 & 111.44 & 114.453239112704 & -3.01323911270428 \tabularnewline
9 & 108.16 & 114.280890155367 & -6.12089015536737 \tabularnewline
10 & 108.77 & 105.284078026039 & 3.48592197396112 \tabularnewline
11 & 109.45 & 105.892297383021 & 3.55770261697864 \tabularnewline
12 & 124.83 & 118.148297383021 & 6.68170261697865 \tabularnewline
13 & 115.31 & 114.604658403230 & 0.705341596769839 \tabularnewline
14 & 109.49 & 108.719045875162 & 0.770954124837636 \tabularnewline
15 & 124.24 & 128.259677494386 & -4.01967749438644 \tabularnewline
16 & 92.85 & 94.508697582391 & -1.65869758239103 \tabularnewline
17 & 98.42 & 100.486581041757 & -2.06658104175687 \tabularnewline
18 & 120.88 & 124.865845277053 & -3.98584527705336 \tabularnewline
19 & 111.72 & 115.08459443376 & -3.36459443375993 \tabularnewline
20 & 116.1 & 121.749496651999 & -5.64949665199923 \tabularnewline
21 & 109.37 & 115.323212660981 & -5.95321266098093 \tabularnewline
22 & 111.65 & 111.835819489896 & -0.185819489895579 \tabularnewline
23 & 114.29 & 113.039651707229 & 1.25034829277134 \tabularnewline
24 & 133.68 & 134.229844612488 & -0.549844612487789 \tabularnewline
25 & 114.27 & 111.477690886389 & 2.79230911361052 \tabularnewline
26 & 126.49 & 126.289625255505 & 0.200374744494649 \tabularnewline
27 & 131 & 129.302 & 1.69800000000001 \tabularnewline
28 & 104 & 101.209342261335 & 2.79065773866463 \tabularnewline
29 & 108.88 & 107.633935365964 & 1.24606463403582 \tabularnewline
30 & 128.48 & 127.248296718456 & 1.23170328154421 \tabularnewline
31 & 132.44 & 130.868335233051 & 1.57166476694894 \tabularnewline
32 & 128.04 & 127.854528470593 & 0.185471529407012 \tabularnewline
33 & 116.35 & 114.876503015718 & 1.47349698428201 \tabularnewline
34 & 120.93 & 122.259044546031 & -1.32904454603124 \tabularnewline
35 & 118.59 & 119.889199601261 & -1.29919960126066 \tabularnewline
36 & 133.1 & 139.143650710380 & -6.04365071038032 \tabularnewline
37 & 121.05 & 119.518464501123 & 1.53153549887731 \tabularnewline
38 & 127.62 & 125.396205964979 & 2.22379403502059 \tabularnewline
39 & 135.44 & 133.173483592279 & 2.26651640772104 \tabularnewline
40 & 114.88 & 111.781470532559 & 3.09852946744132 \tabularnewline
41 & 114.34 & 113.143354324207 & 1.19664567579269 \tabularnewline
42 & 128.85 & 123.823522771440 & 5.02647722856021 \tabularnewline
43 & 138.9 & 139.653624923223 & -0.753624923222548 \tabularnewline
44 & 129.44 & 128.450141330944 & 0.989858669056423 \tabularnewline
45 & 114.96 & 111.898438713965 & 3.06156128603505 \tabularnewline
46 & 127.98 & 129.257495655151 & -1.2774956551509 \tabularnewline
47 & 127.03 & 131.056940732835 & -4.02694073283458 \tabularnewline
48 & 128.75 & 125.742361352492 & 3.00763864750839 \tabularnewline
49 & 137.91 & 136.195624590940 & 1.71437540906025 \tabularnewline
50 & 128.37 & 125.098399534804 & 3.27160046519589 \tabularnewline
51 & 135.9 & 131.237741796139 & 4.66225820386052 \tabularnewline
52 & 122.19 & 116.993083060627 & 5.19691693937349 \tabularnewline
53 & 113.08 & 106.591612860351 & 6.48838713964939 \tabularnewline
54 & 136.2 & 130.226361020209 & 5.97363897979116 \tabularnewline
55 & 138 & 129.677109512350 & 8.32289048765015 \tabularnewline
56 & 115.24 & 107.75259443376 & 7.48740556624007 \tabularnewline
57 & 110.95 & 103.410955453969 & 7.53904454603125 \tabularnewline
58 & 99.23 & 99.9235622828834 & -0.693562282883395 \tabularnewline
59 & 102.39 & 101.871910575655 & 0.518089424345254 \tabularnewline
60 & 112.67 & 115.765845941619 & -3.09584594161890 \tabularnewline
\hline
\end{tabular}
%Source: https://freestatistics.org/blog/index.php?pk=57902&T=4

[TABLE]
[ROW][C]Multiple Linear Regression - Actuals, Interpolation, and Residuals[/C][/ROW]
[ROW][C]Time or Index[/C][C]Actuals[/C][C]InterpolationForecast[/C][C]ResidualsPrediction Error[/C][/ROW]
[ROW][C]1[/C][C]108.01[/C][C]114.753561618318[/C][C]-6.74356161831793[/C][/ROW]
[ROW][C]2[/C][C]101.21[/C][C]107.676723369549[/C][C]-6.46672336954877[/C][/ROW]
[ROW][C]3[/C][C]119.93[/C][C]124.537097117195[/C][C]-4.60709711719513[/C][/ROW]
[ROW][C]4[/C][C]94.76[/C][C]104.187406563088[/C][C]-9.4274065630884[/C][/ROW]
[ROW][C]5[/C][C]95.26[/C][C]102.124516407721[/C][C]-6.86451640772103[/C][/ROW]
[ROW][C]6[/C][C]117.96[/C][C]126.205974212842[/C][C]-8.24597421284223[/C][/ROW]
[ROW][C]7[/C][C]115.86[/C][C]121.636335897617[/C][C]-5.77633589761661[/C][/ROW]
[ROW][C]8[/C][C]111.44[/C][C]114.453239112704[/C][C]-3.01323911270428[/C][/ROW]
[ROW][C]9[/C][C]108.16[/C][C]114.280890155367[/C][C]-6.12089015536737[/C][/ROW]
[ROW][C]10[/C][C]108.77[/C][C]105.284078026039[/C][C]3.48592197396112[/C][/ROW]
[ROW][C]11[/C][C]109.45[/C][C]105.892297383021[/C][C]3.55770261697864[/C][/ROW]
[ROW][C]12[/C][C]124.83[/C][C]118.148297383021[/C][C]6.68170261697865[/C][/ROW]
[ROW][C]13[/C][C]115.31[/C][C]114.604658403230[/C][C]0.705341596769839[/C][/ROW]
[ROW][C]14[/C][C]109.49[/C][C]108.719045875162[/C][C]0.770954124837636[/C][/ROW]
[ROW][C]15[/C][C]124.24[/C][C]128.259677494386[/C][C]-4.01967749438644[/C][/ROW]
[ROW][C]16[/C][C]92.85[/C][C]94.508697582391[/C][C]-1.65869758239103[/C][/ROW]
[ROW][C]17[/C][C]98.42[/C][C]100.486581041757[/C][C]-2.06658104175687[/C][/ROW]
[ROW][C]18[/C][C]120.88[/C][C]124.865845277053[/C][C]-3.98584527705336[/C][/ROW]
[ROW][C]19[/C][C]111.72[/C][C]115.08459443376[/C][C]-3.36459443375993[/C][/ROW]
[ROW][C]20[/C][C]116.1[/C][C]121.749496651999[/C][C]-5.64949665199923[/C][/ROW]
[ROW][C]21[/C][C]109.37[/C][C]115.323212660981[/C][C]-5.95321266098093[/C][/ROW]
[ROW][C]22[/C][C]111.65[/C][C]111.835819489896[/C][C]-0.185819489895579[/C][/ROW]
[ROW][C]23[/C][C]114.29[/C][C]113.039651707229[/C][C]1.25034829277134[/C][/ROW]
[ROW][C]24[/C][C]133.68[/C][C]134.229844612488[/C][C]-0.549844612487789[/C][/ROW]
[ROW][C]25[/C][C]114.27[/C][C]111.477690886389[/C][C]2.79230911361052[/C][/ROW]
[ROW][C]26[/C][C]126.49[/C][C]126.289625255505[/C][C]0.200374744494649[/C][/ROW]
[ROW][C]27[/C][C]131[/C][C]129.302[/C][C]1.69800000000001[/C][/ROW]
[ROW][C]28[/C][C]104[/C][C]101.209342261335[/C][C]2.79065773866463[/C][/ROW]
[ROW][C]29[/C][C]108.88[/C][C]107.633935365964[/C][C]1.24606463403582[/C][/ROW]
[ROW][C]30[/C][C]128.48[/C][C]127.248296718456[/C][C]1.23170328154421[/C][/ROW]
[ROW][C]31[/C][C]132.44[/C][C]130.868335233051[/C][C]1.57166476694894[/C][/ROW]
[ROW][C]32[/C][C]128.04[/C][C]127.854528470593[/C][C]0.185471529407012[/C][/ROW]
[ROW][C]33[/C][C]116.35[/C][C]114.876503015718[/C][C]1.47349698428201[/C][/ROW]
[ROW][C]34[/C][C]120.93[/C][C]122.259044546031[/C][C]-1.32904454603124[/C][/ROW]
[ROW][C]35[/C][C]118.59[/C][C]119.889199601261[/C][C]-1.29919960126066[/C][/ROW]
[ROW][C]36[/C][C]133.1[/C][C]139.143650710380[/C][C]-6.04365071038032[/C][/ROW]
[ROW][C]37[/C][C]121.05[/C][C]119.518464501123[/C][C]1.53153549887731[/C][/ROW]
[ROW][C]38[/C][C]127.62[/C][C]125.396205964979[/C][C]2.22379403502059[/C][/ROW]
[ROW][C]39[/C][C]135.44[/C][C]133.173483592279[/C][C]2.26651640772104[/C][/ROW]
[ROW][C]40[/C][C]114.88[/C][C]111.781470532559[/C][C]3.09852946744132[/C][/ROW]
[ROW][C]41[/C][C]114.34[/C][C]113.143354324207[/C][C]1.19664567579269[/C][/ROW]
[ROW][C]42[/C][C]128.85[/C][C]123.823522771440[/C][C]5.02647722856021[/C][/ROW]
[ROW][C]43[/C][C]138.9[/C][C]139.653624923223[/C][C]-0.753624923222548[/C][/ROW]
[ROW][C]44[/C][C]129.44[/C][C]128.450141330944[/C][C]0.989858669056423[/C][/ROW]
[ROW][C]45[/C][C]114.96[/C][C]111.898438713965[/C][C]3.06156128603505[/C][/ROW]
[ROW][C]46[/C][C]127.98[/C][C]129.257495655151[/C][C]-1.2774956551509[/C][/ROW]
[ROW][C]47[/C][C]127.03[/C][C]131.056940732835[/C][C]-4.02694073283458[/C][/ROW]
[ROW][C]48[/C][C]128.75[/C][C]125.742361352492[/C][C]3.00763864750839[/C][/ROW]
[ROW][C]49[/C][C]137.91[/C][C]136.195624590940[/C][C]1.71437540906025[/C][/ROW]
[ROW][C]50[/C][C]128.37[/C][C]125.098399534804[/C][C]3.27160046519589[/C][/ROW]
[ROW][C]51[/C][C]135.9[/C][C]131.237741796139[/C][C]4.66225820386052[/C][/ROW]
[ROW][C]52[/C][C]122.19[/C][C]116.993083060627[/C][C]5.19691693937349[/C][/ROW]
[ROW][C]53[/C][C]113.08[/C][C]106.591612860351[/C][C]6.48838713964939[/C][/ROW]
[ROW][C]54[/C][C]136.2[/C][C]130.226361020209[/C][C]5.97363897979116[/C][/ROW]
[ROW][C]55[/C][C]138[/C][C]129.677109512350[/C][C]8.32289048765015[/C][/ROW]
[ROW][C]56[/C][C]115.24[/C][C]107.75259443376[/C][C]7.48740556624007[/C][/ROW]
[ROW][C]57[/C][C]110.95[/C][C]103.410955453969[/C][C]7.53904454603125[/C][/ROW]
[ROW][C]58[/C][C]99.23[/C][C]99.9235622828834[/C][C]-0.693562282883395[/C][/ROW]
[ROW][C]59[/C][C]102.39[/C][C]101.871910575655[/C][C]0.518089424345254[/C][/ROW]
[ROW][C]60[/C][C]112.67[/C][C]115.765845941619[/C][C]-3.09584594161890[/C][/ROW]
[/TABLE]
Source: https://freestatistics.org/blog/index.php?pk=57902&T=4

Globally Unique Identifier (entire table): ba.freestatistics.org/blog/index.php?pk=57902&T=4

As an alternative you can also use a QR Code:  

The GUIDs for individual cells are displayed in the table below:

Multiple Linear Regression - Actuals, Interpolation, and Residuals
Time or IndexActualsInterpolationForecastResidualsPrediction Error
1108.01114.753561618318-6.74356161831793
2101.21107.676723369549-6.46672336954877
3119.93124.537097117195-4.60709711719513
494.76104.187406563088-9.4274065630884
595.26102.124516407721-6.86451640772103
6117.96126.205974212842-8.24597421284223
7115.86121.636335897617-5.77633589761661
8111.44114.453239112704-3.01323911270428
9108.16114.280890155367-6.12089015536737
10108.77105.2840780260393.48592197396112
11109.45105.8922973830213.55770261697864
12124.83118.1482973830216.68170261697865
13115.31114.6046584032300.705341596769839
14109.49108.7190458751620.770954124837636
15124.24128.259677494386-4.01967749438644
1692.8594.508697582391-1.65869758239103
1798.42100.486581041757-2.06658104175687
18120.88124.865845277053-3.98584527705336
19111.72115.08459443376-3.36459443375993
20116.1121.749496651999-5.64949665199923
21109.37115.323212660981-5.95321266098093
22111.65111.835819489896-0.185819489895579
23114.29113.0396517072291.25034829277134
24133.68134.229844612488-0.549844612487789
25114.27111.4776908863892.79230911361052
26126.49126.2896252555050.200374744494649
27131129.3021.69800000000001
28104101.2093422613352.79065773866463
29108.88107.6339353659641.24606463403582
30128.48127.2482967184561.23170328154421
31132.44130.8683352330511.57166476694894
32128.04127.8545284705930.185471529407012
33116.35114.8765030157181.47349698428201
34120.93122.259044546031-1.32904454603124
35118.59119.889199601261-1.29919960126066
36133.1139.143650710380-6.04365071038032
37121.05119.5184645011231.53153549887731
38127.62125.3962059649792.22379403502059
39135.44133.1734835922792.26651640772104
40114.88111.7814705325593.09852946744132
41114.34113.1433543242071.19664567579269
42128.85123.8235227714405.02647722856021
43138.9139.653624923223-0.753624923222548
44129.44128.4501413309440.989858669056423
45114.96111.8984387139653.06156128603505
46127.98129.257495655151-1.2774956551509
47127.03131.056940732835-4.02694073283458
48128.75125.7423613524923.00763864750839
49137.91136.1956245909401.71437540906025
50128.37125.0983995348043.27160046519589
51135.9131.2377417961394.66225820386052
52122.19116.9930830606275.19691693937349
53113.08106.5916128603516.48838713964939
54136.2130.2263610202095.97363897979116
55138129.6771095123508.32289048765015
56115.24107.752594433767.48740556624007
57110.95103.4109554539697.53904454603125
5899.2399.9235622828834-0.693562282883395
59102.39101.8719105756550.518089424345254
60112.67115.765845941619-3.09584594161890


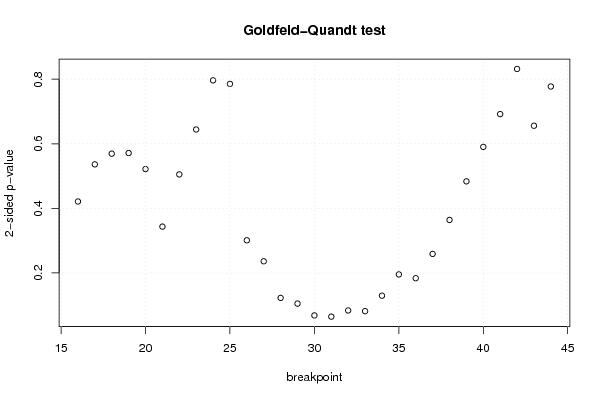
Goldfeld-Quandt test for Heteroskedasticity
p-valuesAlternative Hypothesis
breakpoint indexgreater2-sidedless
160.789394717290860.4212105654182810.210605282709140
170.7318699417891050.536260116421790.268130058210895
180.7153134858618540.5693730282762910.284686514138146
190.7143489194196780.5713021611606440.285651080580322
200.7391582987424160.5216834025151690.260841701257584
210.8283187342195580.3433625315608850.171681265780442
220.7474525009143410.5050949981713190.252547499085659
230.6778721490630130.6442557018739750.322127850936987
240.6017536405377460.7964927189245090.398246359462254
250.6072485024585480.7855029950829050.392751497541452
260.849475428577680.3010491428446410.150524571422321
270.8820231178002270.2359537643995460.117976882199773
280.9387061966513910.1225876066972170.0612938033486086
290.9475234128236580.1049531743526840.0524765871763418
300.9658813917755260.0682372164489480.034118608224474
310.9677685392943640.06446292141127210.0322314607056361
320.9581462824862130.08370743502757340.0418537175137867
330.959249382177240.08150123564552060.0407506178227603
340.9352887924488670.1294224151022660.064711207551133
350.9023590437032270.1952819125935450.0976409562967727
360.9082382601805320.1835234796389370.0917617398194683
370.8705738537291850.2588522925416300.129426146270815
380.8179545408492810.3640909183014370.182045459150719
390.7582104971965830.4835790056068340.241789502803417
400.704785117391590.590429765216820.29521488260841
410.6540652368323930.6918695263352130.345934763167607
420.5840960993238230.8318078013523540.415903900676177
430.6720669663714590.6558660672570820.327933033628541
440.611278305110230.7774433897795380.388721694889769

\begin{tabular}{lllllllll}
\hline
Goldfeld-Quandt test for Heteroskedasticity \tabularnewline
p-values & Alternative Hypothesis \tabularnewline
breakpoint index & greater & 2-sided & less \tabularnewline
16 & 0.78939471729086 & 0.421210565418281 & 0.210605282709140 \tabularnewline
17 & 0.731869941789105 & 0.53626011642179 & 0.268130058210895 \tabularnewline
18 & 0.715313485861854 & 0.569373028276291 & 0.284686514138146 \tabularnewline
19 & 0.714348919419678 & 0.571302161160644 & 0.285651080580322 \tabularnewline
20 & 0.739158298742416 & 0.521683402515169 & 0.260841701257584 \tabularnewline
21 & 0.828318734219558 & 0.343362531560885 & 0.171681265780442 \tabularnewline
22 & 0.747452500914341 & 0.505094998171319 & 0.252547499085659 \tabularnewline
23 & 0.677872149063013 & 0.644255701873975 & 0.322127850936987 \tabularnewline
24 & 0.601753640537746 & 0.796492718924509 & 0.398246359462254 \tabularnewline
25 & 0.607248502458548 & 0.785502995082905 & 0.392751497541452 \tabularnewline
26 & 0.84947542857768 & 0.301049142844641 & 0.150524571422321 \tabularnewline
27 & 0.882023117800227 & 0.235953764399546 & 0.117976882199773 \tabularnewline
28 & 0.938706196651391 & 0.122587606697217 & 0.0612938033486086 \tabularnewline
29 & 0.947523412823658 & 0.104953174352684 & 0.0524765871763418 \tabularnewline
30 & 0.965881391775526 & 0.068237216448948 & 0.034118608224474 \tabularnewline
31 & 0.967768539294364 & 0.0644629214112721 & 0.0322314607056361 \tabularnewline
32 & 0.958146282486213 & 0.0837074350275734 & 0.0418537175137867 \tabularnewline
33 & 0.95924938217724 & 0.0815012356455206 & 0.0407506178227603 \tabularnewline
34 & 0.935288792448867 & 0.129422415102266 & 0.064711207551133 \tabularnewline
35 & 0.902359043703227 & 0.195281912593545 & 0.0976409562967727 \tabularnewline
36 & 0.908238260180532 & 0.183523479638937 & 0.0917617398194683 \tabularnewline
37 & 0.870573853729185 & 0.258852292541630 & 0.129426146270815 \tabularnewline
38 & 0.817954540849281 & 0.364090918301437 & 0.182045459150719 \tabularnewline
39 & 0.758210497196583 & 0.483579005606834 & 0.241789502803417 \tabularnewline
40 & 0.70478511739159 & 0.59042976521682 & 0.29521488260841 \tabularnewline
41 & 0.654065236832393 & 0.691869526335213 & 0.345934763167607 \tabularnewline
42 & 0.584096099323823 & 0.831807801352354 & 0.415903900676177 \tabularnewline
43 & 0.672066966371459 & 0.655866067257082 & 0.327933033628541 \tabularnewline
44 & 0.61127830511023 & 0.777443389779538 & 0.388721694889769 \tabularnewline
\hline
\end{tabular}
%Source: https://freestatistics.org/blog/index.php?pk=57902&T=5

[TABLE]
[ROW][C]Goldfeld-Quandt test for Heteroskedasticity[/C][/ROW]
[ROW][C]p-values[/C][C]Alternative Hypothesis[/C][/ROW]
[ROW][C]breakpoint index[/C][C]greater[/C][C]2-sided[/C][C]less[/C][/ROW]
[ROW][C]16[/C][C]0.78939471729086[/C][C]0.421210565418281[/C][C]0.210605282709140[/C][/ROW]
[ROW][C]17[/C][C]0.731869941789105[/C][C]0.53626011642179[/C][C]0.268130058210895[/C][/ROW]
[ROW][C]18[/C][C]0.715313485861854[/C][C]0.569373028276291[/C][C]0.284686514138146[/C][/ROW]
[ROW][C]19[/C][C]0.714348919419678[/C][C]0.571302161160644[/C][C]0.285651080580322[/C][/ROW]
[ROW][C]20[/C][C]0.739158298742416[/C][C]0.521683402515169[/C][C]0.260841701257584[/C][/ROW]
[ROW][C]21[/C][C]0.828318734219558[/C][C]0.343362531560885[/C][C]0.171681265780442[/C][/ROW]
[ROW][C]22[/C][C]0.747452500914341[/C][C]0.505094998171319[/C][C]0.252547499085659[/C][/ROW]
[ROW][C]23[/C][C]0.677872149063013[/C][C]0.644255701873975[/C][C]0.322127850936987[/C][/ROW]
[ROW][C]24[/C][C]0.601753640537746[/C][C]0.796492718924509[/C][C]0.398246359462254[/C][/ROW]
[ROW][C]25[/C][C]0.607248502458548[/C][C]0.785502995082905[/C][C]0.392751497541452[/C][/ROW]
[ROW][C]26[/C][C]0.84947542857768[/C][C]0.301049142844641[/C][C]0.150524571422321[/C][/ROW]
[ROW][C]27[/C][C]0.882023117800227[/C][C]0.235953764399546[/C][C]0.117976882199773[/C][/ROW]
[ROW][C]28[/C][C]0.938706196651391[/C][C]0.122587606697217[/C][C]0.0612938033486086[/C][/ROW]
[ROW][C]29[/C][C]0.947523412823658[/C][C]0.104953174352684[/C][C]0.0524765871763418[/C][/ROW]
[ROW][C]30[/C][C]0.965881391775526[/C][C]0.068237216448948[/C][C]0.034118608224474[/C][/ROW]
[ROW][C]31[/C][C]0.967768539294364[/C][C]0.0644629214112721[/C][C]0.0322314607056361[/C][/ROW]
[ROW][C]32[/C][C]0.958146282486213[/C][C]0.0837074350275734[/C][C]0.0418537175137867[/C][/ROW]
[ROW][C]33[/C][C]0.95924938217724[/C][C]0.0815012356455206[/C][C]0.0407506178227603[/C][/ROW]
[ROW][C]34[/C][C]0.935288792448867[/C][C]0.129422415102266[/C][C]0.064711207551133[/C][/ROW]
[ROW][C]35[/C][C]0.902359043703227[/C][C]0.195281912593545[/C][C]0.0976409562967727[/C][/ROW]
[ROW][C]36[/C][C]0.908238260180532[/C][C]0.183523479638937[/C][C]0.0917617398194683[/C][/ROW]
[ROW][C]37[/C][C]0.870573853729185[/C][C]0.258852292541630[/C][C]0.129426146270815[/C][/ROW]
[ROW][C]38[/C][C]0.817954540849281[/C][C]0.364090918301437[/C][C]0.182045459150719[/C][/ROW]
[ROW][C]39[/C][C]0.758210497196583[/C][C]0.483579005606834[/C][C]0.241789502803417[/C][/ROW]
[ROW][C]40[/C][C]0.70478511739159[/C][C]0.59042976521682[/C][C]0.29521488260841[/C][/ROW]
[ROW][C]41[/C][C]0.654065236832393[/C][C]0.691869526335213[/C][C]0.345934763167607[/C][/ROW]
[ROW][C]42[/C][C]0.584096099323823[/C][C]0.831807801352354[/C][C]0.415903900676177[/C][/ROW]
[ROW][C]43[/C][C]0.672066966371459[/C][C]0.655866067257082[/C][C]0.327933033628541[/C][/ROW]
[ROW][C]44[/C][C]0.61127830511023[/C][C]0.777443389779538[/C][C]0.388721694889769[/C][/ROW]
[/TABLE]
Source: https://freestatistics.org/blog/index.php?pk=57902&T=5

Globally Unique Identifier (entire table): ba.freestatistics.org/blog/index.php?pk=57902&T=5

As an alternative you can also use a QR Code:  

The GUIDs for individual cells are displayed in the table below:

Goldfeld-Quandt test for Heteroskedasticity
p-valuesAlternative Hypothesis
breakpoint indexgreater2-sidedless
160.789394717290860.4212105654182810.210605282709140
170.7318699417891050.536260116421790.268130058210895
180.7153134858618540.5693730282762910.284686514138146
190.7143489194196780.5713021611606440.285651080580322
200.7391582987424160.5216834025151690.260841701257584
210.8283187342195580.3433625315608850.171681265780442
220.7474525009143410.5050949981713190.252547499085659
230.6778721490630130.6442557018739750.322127850936987
240.6017536405377460.7964927189245090.398246359462254
250.6072485024585480.7855029950829050.392751497541452
260.849475428577680.3010491428446410.150524571422321
270.8820231178002270.2359537643995460.117976882199773
280.9387061966513910.1225876066972170.0612938033486086
290.9475234128236580.1049531743526840.0524765871763418
300.9658813917755260.0682372164489480.034118608224474
310.9677685392943640.06446292141127210.0322314607056361
320.9581462824862130.08370743502757340.0418537175137867
330.959249382177240.08150123564552060.0407506178227603
340.9352887924488670.1294224151022660.064711207551133
350.9023590437032270.1952819125935450.0976409562967727
360.9082382601805320.1835234796389370.0917617398194683
370.8705738537291850.2588522925416300.129426146270815
380.8179545408492810.3640909183014370.182045459150719
390.7582104971965830.4835790056068340.241789502803417
400.704785117391590.590429765216820.29521488260841
410.6540652368323930.6918695263352130.345934763167607
420.5840960993238230.8318078013523540.415903900676177
430.6720669663714590.6558660672570820.327933033628541
440.611278305110230.7774433897795380.388721694889769


Meta Analysis of Goldfeld-Quandt test for Heteroskedasticity
Description# significant tests% significant testsOK/NOK
1% type I error level00OK
5% type I error level00OK
10% type I error level40.137931034482759NOK

\begin{tabular}{lllllllll}
\hline
Meta Analysis of Goldfeld-Quandt test for Heteroskedasticity \tabularnewline
Description & # significant tests & % significant tests & OK/NOK \tabularnewline
1% type I error level & 0 & 0 & OK \tabularnewline
5% type I error level & 0 & 0 & OK \tabularnewline
10% type I error level & 4 & 0.137931034482759 & NOK \tabularnewline
\hline
\end{tabular}
%Source: https://freestatistics.org/blog/index.php?pk=57902&T=6

[TABLE]
[ROW][C]Meta Analysis of Goldfeld-Quandt test for Heteroskedasticity[/C][/ROW]
[ROW][C]Description[/C][C]# significant tests[/C][C]% significant tests[/C][C]OK/NOK[/C][/ROW]
[ROW][C]1% type I error level[/C][C]0[/C][C]0[/C][C]OK[/C][/ROW]
[ROW][C]5% type I error level[/C][C]0[/C][C]0[/C][C]OK[/C][/ROW]
[ROW][C]10% type I error level[/C][C]4[/C][C]0.137931034482759[/C][C]NOK[/C][/ROW]
[/TABLE]
Source: https://freestatistics.org/blog/index.php?pk=57902&T=6

Globally Unique Identifier (entire table): ba.freestatistics.org/blog/index.php?pk=57902&T=6

As an alternative you can also use a QR Code:  

The GUIDs for individual cells are displayed in the table below:

Meta Analysis of Goldfeld-Quandt test for Heteroskedasticity
Description# significant tests% significant testsOK/NOK
1% type I error level00OK
5% type I error level00OK
10% type I error level40.137931034482759NOK


Parameters (Session):
par1 = 1 ; par2 = Include Monthly Dummies ; par3 = No Linear Trend ;
Parameters (R input):
par1 = 1 ; par2 = Include Monthly Dummies ; par3 = No Linear Trend ;
R code (references can be found in the software module):
library(lattice)
library(lmtest)
n25 <- 25 #minimum number of obs. for Goldfeld-Quandt test
par1 <- as.numeric(par1)
x <- t(y)
k <- length(x[1,])
n <- length(x[,1])
x1 <- cbind(x[,par1], x[,1:k!=par1])
mycolnames <- c(colnames(x)[par1], colnames(x)[1:k!=par1])
colnames(x1) <- mycolnames #colnames(x)[par1]
x <- x1
if (par3 == 'First Differences'){
x2 <- array(0, dim=c(n-1,k), dimnames=list(1:(n-1), paste('(1-B)',colnames(x),sep='')))
for (i in 1:n-1) {
for (j in 1:k) {
x2[i,j] <- x[i+1,j] - x[i,j]
}
}
x <- x2
}
if (par2 == 'Include Monthly Dummies'){
x2 <- array(0, dim=c(n,11), dimnames=list(1:n, paste('M', seq(1:11), sep ='')))
for (i in 1:11){
x2[seq(i,n,12),i] <- 1
}
x <- cbind(x, x2)
}
if (par2 == 'Include Quarterly Dummies'){
x2 <- array(0, dim=c(n,3), dimnames=list(1:n, paste('Q', seq(1:3), sep ='')))
for (i in 1:3){
x2[seq(i,n,4),i] <- 1
}
x <- cbind(x, x2)
}
k <- length(x[1,])
if (par3 == 'Linear Trend'){
x <- cbind(x, c(1:n))
colnames(x)[k+1] <- 't'
}
x
k <- length(x[1,])
df <- as.data.frame(x)
(mylm <- lm(df))
(mysum <- summary(mylm))
if (n > n25) {
kp3 <- k + 3
nmkm3 <- n - k - 3
gqarr <- array(NA, dim=c(nmkm3-kp3+1,3))
numgqtests <- 0
numsignificant1 <- 0
numsignificant5 <- 0
numsignificant10 <- 0
for (mypoint in kp3:nmkm3) {
j <- 0
numgqtests <- numgqtests + 1
for (myalt in c('greater', 'two.sided', 'less')) {
j <- j + 1
gqarr[mypoint-kp3+1,j] <- gqtest(mylm, point=mypoint, alternative=myalt)$p.value
}
if (gqarr[mypoint-kp3+1,2] < 0.01) numsignificant1 <- numsignificant1 + 1
if (gqarr[mypoint-kp3+1,2] < 0.05) numsignificant5 <- numsignificant5 + 1
if (gqarr[mypoint-kp3+1,2] < 0.10) numsignificant10 <- numsignificant10 + 1
}
gqarr
}
bitmap(file='test0.png')
plot(x[,1], type='l', main='Actuals and Interpolation', ylab='value of Actuals and Interpolation (dots)', xlab='time or index')
points(x[,1]-mysum$resid)
grid()
dev.off()
bitmap(file='test1.png')
plot(mysum$resid, type='b', pch=19, main='Residuals', ylab='value of Residuals', xlab='time or index')
grid()
dev.off()
bitmap(file='test2.png')
hist(mysum$resid, main='Residual Histogram', xlab='values of Residuals')
grid()
dev.off()
bitmap(file='test3.png')
densityplot(~mysum$resid,col='black',main='Residual Density Plot', xlab='values of Residuals')
dev.off()
bitmap(file='test4.png')
qqnorm(mysum$resid, main='Residual Normal Q-Q Plot')
qqline(mysum$resid)
grid()
dev.off()
(myerror <- as.ts(mysum$resid))
bitmap(file='test5.png')
dum <- cbind(lag(myerror,k=1),myerror)
dum
dum1 <- dum[2:length(myerror),]
dum1
z <- as.data.frame(dum1)
z
plot(z,main=paste('Residual Lag plot, lowess, and regression line'), ylab='values of Residuals', xlab='lagged values of Residuals')
lines(lowess(z))
abline(lm(z))
grid()
dev.off()
bitmap(file='test6.png')
acf(mysum$resid, lag.max=length(mysum$resid)/2, main='Residual Autocorrelation Function')
grid()
dev.off()
bitmap(file='test7.png')
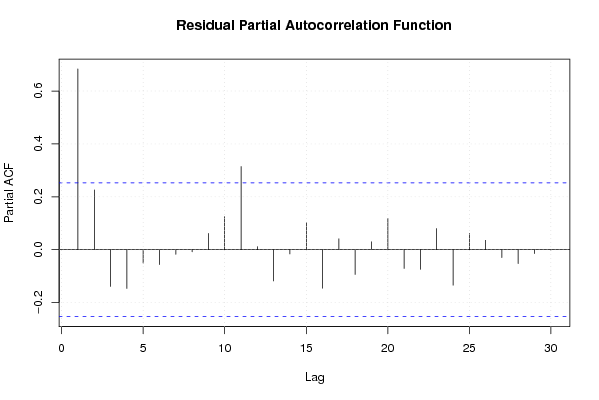
pacf(mysum$resid, lag.max=length(mysum$resid)/2, main='Residual Partial Autocorrelation Function')
grid()
dev.off()
bitmap(file='test8.png')
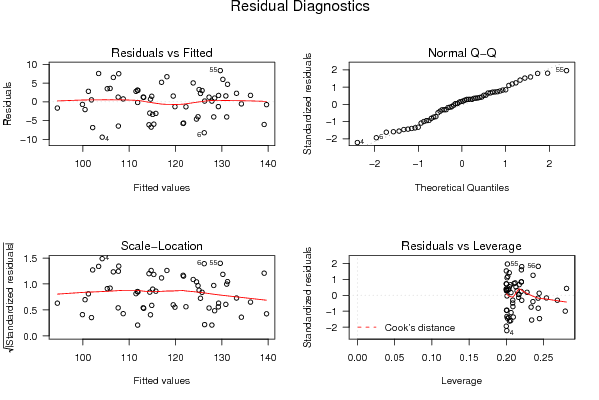
opar <- par(mfrow = c(2,2), oma = c(0, 0, 1.1, 0))
plot(mylm, las = 1, sub='Residual Diagnostics')
par(opar)
dev.off()
if (n > n25) {
bitmap(file='test9.png')
plot(kp3:nmkm3,gqarr[,2], main='Goldfeld-Quandt test',ylab='2-sided p-value',xlab='breakpoint')
grid()
dev.off()
}
load(file='createtable')
a<-table.start()
a<-table.row.start(a)
a<-table.element(a, 'Multiple Linear Regression - Estimated Regression Equation', 1, TRUE)
a<-table.row.end(a)
myeq <- colnames(x)[1]
myeq <- paste(myeq, '[t] = ', sep='')
for (i in 1:k){
if (mysum$coefficients[i,1] > 0) myeq <- paste(myeq, '+', '')
myeq <- paste(myeq, mysum$coefficients[i,1], sep=' ')
if (rownames(mysum$coefficients)[i] != '(Intercept)') {
myeq <- paste(myeq, rownames(mysum$coefficients)[i], sep='')
if (rownames(mysum$coefficients)[i] != 't') myeq <- paste(myeq, '[t]', sep='')
}
}
myeq <- paste(myeq, ' + e[t]')
a<-table.row.start(a)
a<-table.element(a, myeq)
a<-table.row.end(a)
a<-table.end(a)
table.save(a,file='mytable1.tab')
a<-table.start()
a<-table.row.start(a)
a<-table.element(a,hyperlink('ols1.htm','Multiple Linear Regression - Ordinary Least Squares',''), 6, TRUE)
a<-table.row.end(a)
a<-table.row.start(a)
a<-table.element(a,'Variable',header=TRUE)
a<-table.element(a,'Parameter',header=TRUE)
a<-table.element(a,'S.D.',header=TRUE)
a<-table.element(a,'T-STAT
H0: parameter = 0',header=TRUE)
a<-table.element(a,'2-tail p-value',header=TRUE)
a<-table.element(a,'1-tail p-value',header=TRUE)
a<-table.row.end(a)
for (i in 1:k){
a<-table.row.start(a)
a<-table.element(a,rownames(mysum$coefficients)[i],header=TRUE)
a<-table.element(a,mysum$coefficients[i,1])
a<-table.element(a, round(mysum$coefficients[i,2],6))
a<-table.element(a, round(mysum$coefficients[i,3],4))
a<-table.element(a, round(mysum$coefficients[i,4],6))
a<-table.element(a, round(mysum$coefficients[i,4]/2,6))
a<-table.row.end(a)
}
a<-table.end(a)
table.save(a,file='mytable2.tab')
a<-table.start()
a<-table.row.start(a)
a<-table.element(a, 'Multiple Linear Regression - Regression Statistics', 2, TRUE)
a<-table.row.end(a)
a<-table.row.start(a)
a<-table.element(a, 'Multiple R',1,TRUE)
a<-table.element(a, sqrt(mysum$r.squared))
a<-table.row.end(a)
a<-table.row.start(a)
a<-table.element(a, 'R-squared',1,TRUE)
a<-table.element(a, mysum$r.squared)
a<-table.row.end(a)
a<-table.row.start(a)
a<-table.element(a, 'Adjusted R-squared',1,TRUE)
a<-table.element(a, mysum$adj.r.squared)
a<-table.row.end(a)
a<-table.row.start(a)
a<-table.element(a, 'F-TEST (value)',1,TRUE)
a<-table.element(a, mysum$fstatistic[1])
a<-table.row.end(a)
a<-table.row.start(a)
a<-table.element(a, 'F-TEST (DF numerator)',1,TRUE)
a<-table.element(a, mysum$fstatistic[2])
a<-table.row.end(a)
a<-table.row.start(a)
a<-table.element(a, 'F-TEST (DF denominator)',1,TRUE)
a<-table.element(a, mysum$fstatistic[3])
a<-table.row.end(a)
a<-table.row.start(a)
a<-table.element(a, 'p-value',1,TRUE)
a<-table.element(a, 1-pf(mysum$fstatistic[1],mysum$fstatistic[2],mysum$fstatistic[3]))
a<-table.row.end(a)
a<-table.row.start(a)
a<-table.element(a, 'Multiple Linear Regression - Residual Statistics', 2, TRUE)
a<-table.row.end(a)
a<-table.row.start(a)
a<-table.element(a, 'Residual Standard Deviation',1,TRUE)
a<-table.element(a, mysum$sigma)
a<-table.row.end(a)
a<-table.row.start(a)
a<-table.element(a, 'Sum Squared Residuals',1,TRUE)
a<-table.element(a, sum(myerror*myerror))
a<-table.row.end(a)
a<-table.end(a)
table.save(a,file='mytable3.tab')
a<-table.start()
a<-table.row.start(a)
a<-table.element(a, 'Multiple Linear Regression - Actuals, Interpolation, and Residuals', 4, TRUE)
a<-table.row.end(a)
a<-table.row.start(a)
a<-table.element(a, 'Time or Index', 1, TRUE)
a<-table.element(a, 'Actuals', 1, TRUE)
a<-table.element(a, 'Interpolation
Forecast', 1, TRUE)
a<-table.element(a, 'Residuals
Prediction Error', 1, TRUE)
a<-table.row.end(a)
for (i in 1:n) {
a<-table.row.start(a)
a<-table.element(a,i, 1, TRUE)
a<-table.element(a,x[i])
a<-table.element(a,x[i]-mysum$resid[i])
a<-table.element(a,mysum$resid[i])
a<-table.row.end(a)
}
a<-table.end(a)
table.save(a,file='mytable4.tab')
if (n > n25) {
a<-table.start()
a<-table.row.start(a)
a<-table.element(a,'Goldfeld-Quandt test for Heteroskedasticity',4,TRUE)
a<-table.row.end(a)
a<-table.row.start(a)
a<-table.element(a,'p-values',header=TRUE)
a<-table.element(a,'Alternative Hypothesis',3,header=TRUE)
a<-table.row.end(a)
a<-table.row.start(a)
a<-table.element(a,'breakpoint index',header=TRUE)
a<-table.element(a,'greater',header=TRUE)
a<-table.element(a,'2-sided',header=TRUE)
a<-table.element(a,'less',header=TRUE)
a<-table.row.end(a)
for (mypoint in kp3:nmkm3) {
a<-table.row.start(a)
a<-table.element(a,mypoint,header=TRUE)
a<-table.element(a,gqarr[mypoint-kp3+1,1])
a<-table.element(a,gqarr[mypoint-kp3+1,2])
a<-table.element(a,gqarr[mypoint-kp3+1,3])
a<-table.row.end(a)
}
a<-table.end(a)
table.save(a,file='mytable5.tab')
a<-table.start()
a<-table.row.start(a)
a<-table.element(a,'Meta Analysis of Goldfeld-Quandt test for Heteroskedasticity',4,TRUE)
a<-table.row.end(a)
a<-table.row.start(a)
a<-table.element(a,'Description',header=TRUE)
a<-table.element(a,'# significant tests',header=TRUE)
a<-table.element(a,'% significant tests',header=TRUE)
a<-table.element(a,'OK/NOK',header=TRUE)
a<-table.row.end(a)
a<-table.row.start(a)
a<-table.element(a,'1% type I error level',header=TRUE)
a<-table.element(a,numsignificant1)
a<-table.element(a,numsignificant1/numgqtests)
if (numsignificant1/numgqtests < 0.01) dum <- 'OK' else dum <- 'NOK'
a<-table.element(a,dum)
a<-table.row.end(a)
a<-table.row.start(a)
a<-table.element(a,'5% type I error level',header=TRUE)
a<-table.element(a,numsignificant5)
a<-table.element(a,numsignificant5/numgqtests)
if (numsignificant5/numgqtests < 0.05) dum <- 'OK' else dum <- 'NOK'
a<-table.element(a,dum)
a<-table.row.end(a)
a<-table.row.start(a)
a<-table.element(a,'10% type I error level',header=TRUE)
a<-table.element(a,numsignificant10)
a<-table.element(a,numsignificant10/numgqtests)
if (numsignificant10/numgqtests < 0.1) dum <- 'OK' else dum <- 'NOK'
a<-table.element(a,dum)
a<-table.row.end(a)
a<-table.end(a)
table.save(a,file='mytable6.tab')
}