| Multiple Linear Regression - Estimated Regression Equation |
| Y[t] = + 0.62534313143448 + 0.134177451152066X[t] + 0.763994640040319`Y(t-1)`[t] + 0.0704456425436845`Y(t-2)`[t] + 0.0782248700521776`Y(t-3)`[t] -0.146998416229665`Y(t-4)`[t] + 3.86274414161116M1[t] + 2.64053282326136M2[t] + 0.873677019898664M3[t] + 1.00749157087014M4[t] + 0.226587076443826M5[t] + 1.87144092960793M6[t] + 0.964855849929924M7[t] + 3.12046893188267M8[t] + 0.988941013633353M9[t] + 2.26002196920389M10[t] -1.84545590981347M11[t] -0.0211274789115458t + e[t] |
| Multiple Linear Regression - Ordinary Least Squares | |||||
| Variable | Parameter | S.D. | T-STAT H0: parameter = 0 | 2-tail p-value | 1-tail p-value |
| (Intercept) | 0.62534313143448 | 3.092271 | 0.2022 | 0.84079 | 0.420395 |
| X | 0.134177451152066 | 0.180865 | 0.7419 | 0.462614 | 0.231307 |
| `Y(t-1)` | 0.763994640040319 | 0.169359 | 4.5111 | 5.8e-05 | 2.9e-05 |
| `Y(t-2)` | 0.0704456425436845 | 0.206742 | 0.3407 | 0.735127 | 0.367563 |
| `Y(t-3)` | 0.0782248700521776 | 0.20344 | 0.3845 | 0.702689 | 0.351344 |
| `Y(t-4)` | -0.146998416229665 | 0.16191 | -0.9079 | 0.369505 | 0.184753 |
| M1 | 3.86274414161116 | 2.442532 | 1.5815 | 0.121852 | 0.060926 |
| M2 | 2.64053282326136 | 2.55431 | 1.0338 | 0.307618 | 0.153809 |
| M3 | 0.873677019898664 | 2.457133 | 0.3556 | 0.72408 | 0.36204 |
| M4 | 1.00749157087014 | 2.443923 | 0.4122 | 0.682418 | 0.341209 |
| M5 | 0.226587076443826 | 2.423242 | 0.0935 | 0.925981 | 0.46299 |
| M6 | 1.87144092960793 | 2.368799 | 0.79 | 0.434283 | 0.217142 |
| M7 | 0.964855849929924 | 2.426073 | 0.3977 | 0.693018 | 0.346509 |
| M8 | 3.12046893188267 | 2.380822 | 1.3107 | 0.197636 | 0.098818 |
| M9 | 0.988941013633353 | 2.489186 | 0.3973 | 0.693316 | 0.346658 |
| M10 | 2.26002196920389 | 2.505296 | 0.9021 | 0.372543 | 0.186271 |
| M11 | -1.84545590981347 | 2.554184 | -0.7225 | 0.474284 | 0.237142 |
| t | -0.0211274789115458 | 0.034949 | -0.6045 | 0.548997 | 0.274499 |
| Multiple Linear Regression - Regression Statistics | |
| Multiple R | 0.919899890899325 |
| R-squared | 0.84621580927659 |
| Adjusted R-squared | 0.779181674858694 |
| F-TEST (value) | 12.6236553455171 |
| F-TEST (DF numerator) | 17 |
| F-TEST (DF denominator) | 39 |
| p-value | 6.12756512197166e-11 |
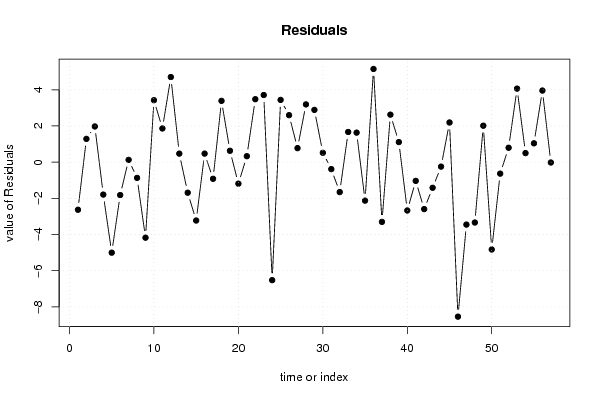
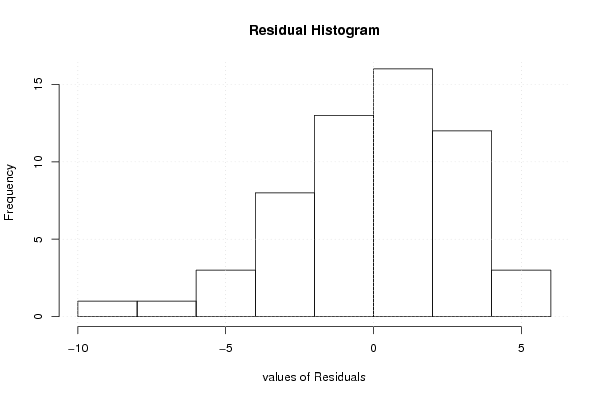
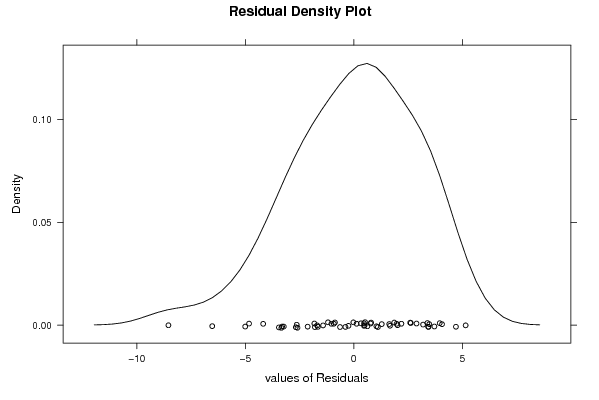
| Multiple Linear Regression - Residual Statistics | |
| Residual Standard Deviation | 3.47962494480970 |
| Sum Squared Residuals | 472.203800505133 |
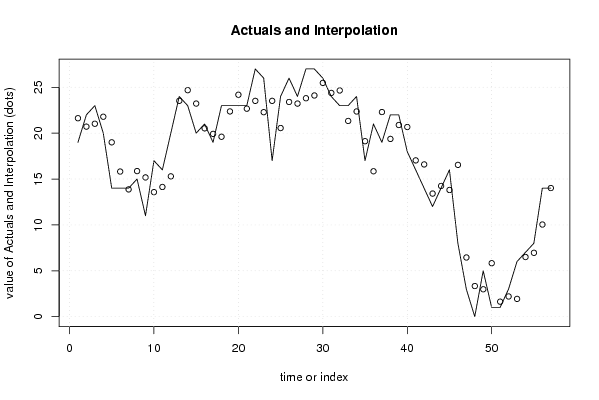
| Multiple Linear Regression - Actuals, Interpolation, and Residuals | |||
| Time or Index | Actuals | Interpolation Forecast | Residuals Prediction Error |
| 1 | 19 | 21.630118286506 | -2.63011828650599 |
| 2 | 22 | 20.7120567694659 | 1.28794323053411 |
| 3 | 23 | 21.0253305950230 | 1.97466940497697 |
| 4 | 20 | 21.791920132027 | -1.79192013202699 |
| 5 | 14 | 19.0030244912684 | -5.00302449126839 |
| 6 | 14 | 15.8175370920065 | -1.81753709200653 |
| 7 | 14 | 13.8707937299254 | 0.129206270074637 |
| 8 | 15 | 15.8695834004208 | -0.869583400420844 |
| 9 | 11 | 15.1750647090654 | -4.17506470906540 |
| 10 | 17 | 13.5736627192589 | 3.42633728074114 |
| 11 | 16 | 14.1360756390991 | 1.86392436090094 |
| 12 | 20 | 15.2933628399365 | 4.70663716006354 |
| 13 | 24 | 23.5267166784808 | 0.473283321519236 |
| 14 | 23 | 24.6877591343557 | -1.68775913435569 |
| 15 | 20 | 23.2263230516496 | -3.22632305164961 |
| 16 | 21 | 20.5270556898373 | 0.472944310162739 |
| 17 | 19 | 19.9200710315876 | -0.920071031587584 |
| 18 | 23 | 19.6094629660353 | 3.39053703396467 |
| 19 | 23 | 22.3709949584498 | 0.629005041550219 |
| 20 | 23 | 24.1886245827972 | -1.18862458279716 |
| 21 | 23 | 22.6697009885347 | 0.330299011465254 |
| 22 | 27 | 23.5195092318880 | 3.48049076811203 |
| 23 | 26 | 22.2878694927379 | 3.71213050726213 |
| 24 | 17 | 23.5226438928525 | -6.52264389285255 |
| 25 | 24 | 20.5563319463566 | 3.44366805364337 |
| 26 | 26 | 23.4009795468591 | 2.59902045314085 |
| 27 | 24 | 23.2246748244987 | 0.775325175501328 |
| 28 | 27 | 23.8074059928824 | 3.19259400711764 |
| 29 | 27 | 24.1094967945771 | 2.89050320542290 |
| 30 | 26 | 25.4806957787818 | 0.519304221218178 |
| 31 | 24 | 24.3847487483438 | -0.384748748343841 |
| 32 | 23 | 24.6542348665694 | -1.65423486656941 |
| 33 | 23 | 21.3306202426158 | 1.66937975738421 |
| 34 | 24 | 22.3664993017043 | 1.63350069829566 |
| 35 | 17 | 19.1257363304165 | -2.12573633041646 |
| 36 | 21 | 15.8463818300399 | 5.15361816996009 |
| 37 | 19 | 22.3022469349168 | -3.30224693491677 |
| 38 | 22 | 19.3730660783435 | 2.62693392165645 |
| 39 | 22 | 20.8902153933064 | 1.10978460669364 |
| 40 | 18 | 20.6710621647024 | -2.67106216470244 |
| 41 | 16 | 17.0331149361694 | -1.03311493616941 |
| 42 | 14 | 16.5939226430905 | -2.59392264309049 |
| 43 | 12 | 13.4160751368201 | -1.41607513682008 |
| 44 | 14 | 14.2461353739316 | -0.246135373931552 |
| 45 | 16 | 13.8059734957318 | 2.19402650426818 |
| 46 | 8 | 16.5403287471488 | -8.54032874714883 |
| 47 | 3 | 6.45031853774661 | -3.45031853774661 |
| 48 | 0 | 3.33761143717108 | -3.33761143717108 |
| 49 | 5 | 2.98458615373985 | 2.01541384626015 |
| 50 | 1 | 5.82613847097573 | -4.82613847097573 |
| 51 | 1 | 1.63345613552232 | -0.633456135522325 |
| 52 | 3 | 2.20255602055096 | 0.797443979449044 |
| 53 | 6 | 1.93429274639753 | 4.06570725360247 |
| 54 | 7 | 6.49838152008584 | 0.501618479914164 |
| 55 | 8 | 6.95738742646093 | 1.04261257353907 |
| 56 | 14 | 10.0414217762810 | 3.95857822371897 |
| 57 | 14 | 14.0186405640523 | -0.0186405640522542 |
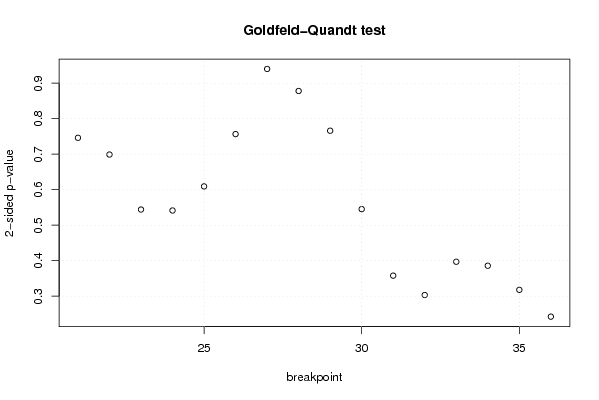
| Goldfeld-Quandt test for Heteroskedasticity | |||
| p-values | Alternative Hypothesis | ||
| breakpoint index | greater | 2-sided | less |
| 21 | 0.373070549844811 | 0.746141099689622 | 0.626929450155189 |
| 22 | 0.349474674790675 | 0.698949349581351 | 0.650525325209325 |
| 23 | 0.272016363830697 | 0.544032727661394 | 0.727983636169303 |
| 24 | 0.729319665539629 | 0.541360668920743 | 0.270680334460371 |
| 25 | 0.695398224588654 | 0.609203550822693 | 0.304601775411346 |
| 26 | 0.621722670211397 | 0.756554659577205 | 0.378277329788603 |
| 27 | 0.529954654909137 | 0.940090690181725 | 0.470045345090863 |
| 28 | 0.439054755848634 | 0.878109511697268 | 0.560945244151366 |
| 29 | 0.383031002312029 | 0.766062004624058 | 0.616968997687971 |
| 30 | 0.272605390944969 | 0.545210781889939 | 0.72739460905503 |
| 31 | 0.178907154429273 | 0.357814308858546 | 0.821092845570727 |
| 32 | 0.151589693533477 | 0.303179387066954 | 0.848410306466523 |
| 33 | 0.198508483621600 | 0.397016967243199 | 0.8014915163784 |
| 34 | 0.192881983911404 | 0.385763967822808 | 0.807118016088596 |
| 35 | 0.158903622051204 | 0.317807244102407 | 0.841096377948797 |
| 36 | 0.121153536403580 | 0.242307072807159 | 0.87884646359642 |
| Meta Analysis of Goldfeld-Quandt test for Heteroskedasticity | |||
| Description | # significant tests | % significant tests | OK/NOK |
| 1% type I error level | 0 | 0 | OK |
| 5% type I error level | 0 | 0 | OK |
| 10% type I error level | 0 | 0 | OK |