| Multiple Linear Regression - Estimated Regression Equation |
| Y[t] = + 588.264 -26.1600000000000X[t] -14.2319999999999M1[t] -29.632M2[t] -27.232M3[t] -25.0320000000000M4[t] -29.232M5[t] -38.032M6[t] -43.032M7[t] -54.232M8[t] -52.032M9[t] -0.831999999999988M10[t] + 7.16800000000001M11[t] + e[t] |
| Multiple Linear Regression - Ordinary Least Squares | |||||
| Variable | Parameter | S.D. | T-STAT H0: parameter = 0 | 2-tail p-value | 1-tail p-value |
| (Intercept) | 588.264 | 18.56253 | 31.6909 | 0 | 0 |
| X | -26.1600000000000 | 12.630202 | -2.0712 | 0.043853 | 0.021926 |
| M1 | -14.2319999999999 | 25.386392 | -0.5606 | 0.577723 | 0.288861 |
| M2 | -29.632 | 25.386392 | -1.1672 | 0.249002 | 0.124501 |
| M3 | -27.232 | 25.386392 | -1.0727 | 0.288883 | 0.144441 |
| M4 | -25.0320000000000 | 25.386392 | -0.986 | 0.329163 | 0.164581 |
| M5 | -29.232 | 25.386392 | -1.1515 | 0.255358 | 0.127679 |
| M6 | -38.032 | 25.386392 | -1.4981 | 0.140787 | 0.070394 |
| M7 | -43.032 | 25.386392 | -1.6951 | 0.096676 | 0.048338 |
| M8 | -54.232 | 25.386392 | -2.1363 | 0.037896 | 0.018948 |
| M9 | -52.032 | 25.386392 | -2.0496 | 0.046007 | 0.023003 |
| M10 | -0.831999999999988 | 25.386392 | -0.0328 | 0.973994 | 0.486997 |
| M11 | 7.16800000000001 | 25.386392 | 0.2824 | 0.77891 | 0.389455 |
| Multiple Linear Regression - Regression Statistics | |
| Multiple R | 0.521709767358670 |
| R-squared | 0.272181081357437 |
| Adjusted R-squared | 0.0863549744699744 |
| F-TEST (value) | 1.46470851656098 |
| F-TEST (DF numerator) | 12 |
| F-TEST (DF denominator) | 47 |
| p-value | 0.171785357661580 |
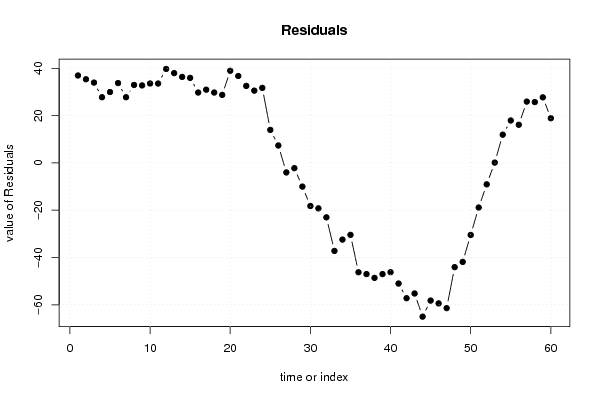
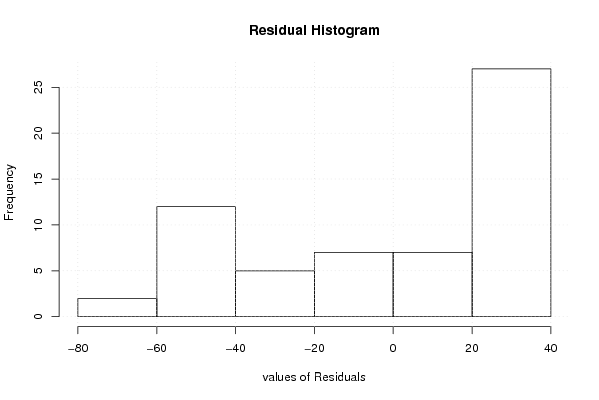
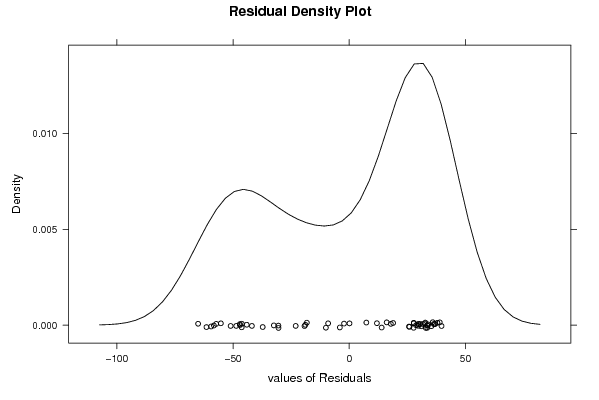
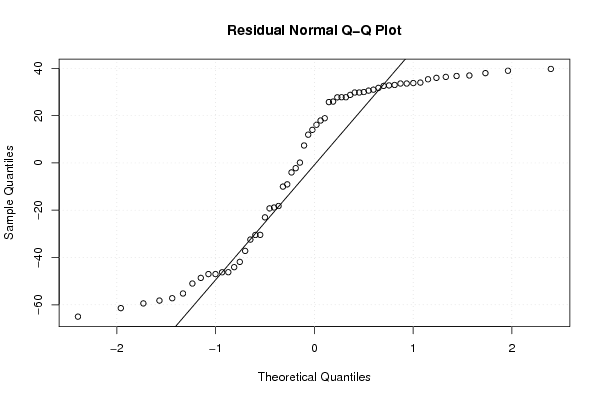
| Multiple Linear Regression - Residual Statistics | |
| Residual Standard Deviation | 39.9402063728567 |
| Sum Squared Residuals | 74975.344 |
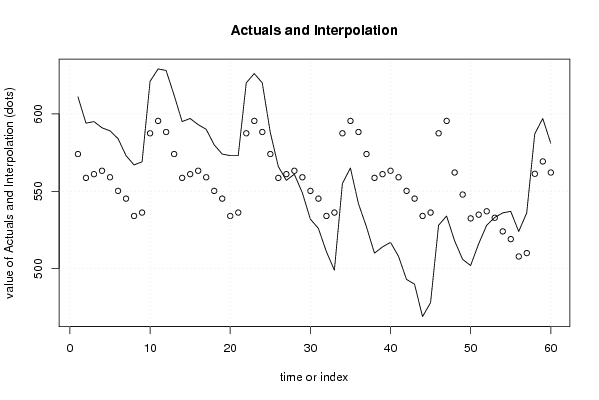
| Multiple Linear Regression - Actuals, Interpolation, and Residuals | |||
| Time or Index | Actuals | Interpolation Forecast | Residuals Prediction Error |
| 1 | 611 | 574.032 | 36.9680000000002 |
| 2 | 594 | 558.632 | 35.368 |
| 3 | 595 | 561.032 | 33.968 |
| 4 | 591 | 563.232 | 27.768 |
| 5 | 589 | 559.032 | 29.9680000000000 |
| 6 | 584 | 550.232 | 33.768 |
| 7 | 573 | 545.232 | 27.768 |
| 8 | 567 | 534.032 | 32.9680000000001 |
| 9 | 569 | 536.232 | 32.768 |
| 10 | 621 | 587.432 | 33.568 |
| 11 | 629 | 595.432 | 33.568 |
| 12 | 628 | 588.264 | 39.736 |
| 13 | 612 | 574.032 | 37.9680000000000 |
| 14 | 595 | 558.632 | 36.3680 |
| 15 | 597 | 561.032 | 35.968 |
| 16 | 593 | 563.232 | 29.768 |
| 17 | 590 | 559.032 | 30.968 |
| 18 | 580 | 550.232 | 29.768 |
| 19 | 574 | 545.232 | 28.768 |
| 20 | 573 | 534.032 | 38.968 |
| 21 | 573 | 536.232 | 36.768 |
| 22 | 620 | 587.432 | 32.568 |
| 23 | 626 | 595.432 | 30.568 |
| 24 | 620 | 588.264 | 31.736 |
| 25 | 588 | 574.032 | 13.9679999999999 |
| 26 | 566 | 558.632 | 7.36799999999997 |
| 27 | 557 | 561.032 | -4.03199999999999 |
| 28 | 561 | 563.232 | -2.23200000000002 |
| 29 | 549 | 559.032 | -10.032 |
| 30 | 532 | 550.232 | -18.232 |
| 31 | 526 | 545.232 | -19.232 |
| 32 | 511 | 534.032 | -23.0320000000000 |
| 33 | 499 | 536.232 | -37.232 |
| 34 | 555 | 587.432 | -32.432 |
| 35 | 565 | 595.432 | -30.432 |
| 36 | 542 | 588.264 | -46.264 |
| 37 | 527 | 574.032 | -47.0320000000001 |
| 38 | 510 | 558.632 | -48.6320000000000 |
| 39 | 514 | 561.032 | -47.032 |
| 40 | 517 | 563.232 | -46.232 |
| 41 | 508 | 559.032 | -51.032 |
| 42 | 493 | 550.232 | -57.232 |
| 43 | 490 | 545.232 | -55.232 |
| 44 | 469 | 534.032 | -65.032 |
| 45 | 478 | 536.232 | -58.232 |
| 46 | 528 | 587.432 | -59.432 |
| 47 | 534 | 595.432 | -61.432 |
| 48 | 518 | 562.104 | -44.104 |
| 49 | 506 | 547.872 | -41.8720000000001 |
| 50 | 502 | 532.472 | -30.472 |
| 51 | 516 | 534.872 | -18.8720000000000 |
| 52 | 528 | 537.072 | -9.0720 |
| 53 | 533 | 532.872 | 0.128000000000013 |
| 54 | 536 | 524.072 | 11.928 |
| 55 | 537 | 519.072 | 17.9280000000000 |
| 56 | 524 | 507.872 | 16.128 |
| 57 | 536 | 510.072 | 25.928 |
| 58 | 587 | 561.272 | 25.728 |
| 59 | 597 | 569.272 | 27.728 |
| 60 | 581 | 562.104 | 18.8960000000000 |
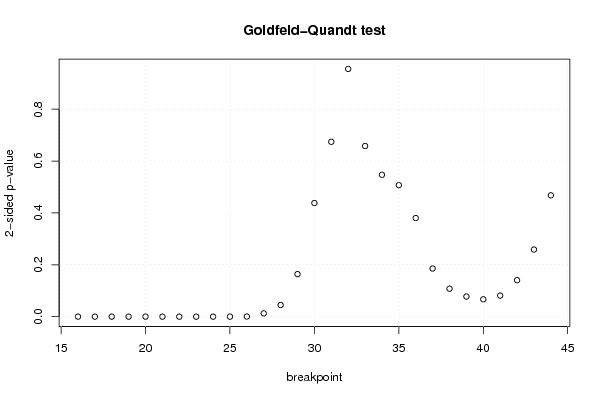
| Goldfeld-Quandt test for Heteroskedasticity | |||
| p-values | Alternative Hypothesis | ||
| breakpoint index | greater | 2-sided | less |
| 16 | 5.49470362031783e-05 | 0.000109894072406357 | 0.999945052963797 |
| 17 | 2.00506099788873e-06 | 4.01012199577746e-06 | 0.999997994939002 |
| 18 | 5.68416998379384e-07 | 1.13683399675877e-06 | 0.999999431583002 |
| 19 | 2.85295091729473e-08 | 5.70590183458946e-08 | 0.99999997147049 |
| 20 | 2.68181243090685e-08 | 5.3636248618137e-08 | 0.999999973181876 |
| 21 | 5.39219011652879e-09 | 1.07843802330576e-08 | 0.99999999460781 |
| 22 | 5.36949944686265e-10 | 1.07389988937253e-09 | 0.99999999946305 |
| 23 | 9.13524024705453e-11 | 1.82704804941091e-10 | 0.999999999908648 |
| 24 | 3.20922885527082e-10 | 6.41845771054165e-10 | 0.999999999679077 |
| 25 | 2.670198908114e-06 | 5.340397816228e-06 | 0.999997329801092 |
| 26 | 0.00019552840018603 | 0.00039105680037206 | 0.999804471599814 |
| 27 | 0.00627577510361603 | 0.0125515502072321 | 0.993724224896384 |
| 28 | 0.0224480995605931 | 0.0448961991211863 | 0.977551900439407 |
| 29 | 0.0819473263274314 | 0.163894652654863 | 0.918052673672569 |
| 30 | 0.219042294313272 | 0.438084588626543 | 0.780957705686728 |
| 31 | 0.337161702366073 | 0.674323404732146 | 0.662838297633927 |
| 32 | 0.522401087210945 | 0.955197825578111 | 0.477598912789055 |
| 33 | 0.670984379454451 | 0.658031241091098 | 0.329015620545549 |
| 34 | 0.726435585914262 | 0.547128828171476 | 0.273564414085738 |
| 35 | 0.746433472054658 | 0.507133055890683 | 0.253566527945342 |
| 36 | 0.809894834107154 | 0.380210331785693 | 0.190105165892846 |
| 37 | 0.90720187093765 | 0.185596258124700 | 0.0927981290623502 |
| 38 | 0.946098163717386 | 0.107803672565229 | 0.0539018362826144 |
| 39 | 0.9612637997554 | 0.077472400489199 | 0.0387362002445995 |
| 40 | 0.96652448409956 | 0.0669510318008816 | 0.0334755159004408 |
| 41 | 0.959365060245657 | 0.081269879508686 | 0.040634939754343 |
| 42 | 0.929628070434517 | 0.140743859130967 | 0.0703719295654834 |
| 43 | 0.870609339484666 | 0.258781321030669 | 0.129390660515334 |
| 44 | 0.766056557456433 | 0.467886885087133 | 0.233943442543567 |
| Meta Analysis of Goldfeld-Quandt test for Heteroskedasticity | |||
| Description | # significant tests | % significant tests | OK/NOK |
| 1% type I error level | 11 | 0.379310344827586 | NOK |
| 5% type I error level | 13 | 0.448275862068966 | NOK |
| 10% type I error level | 16 | 0.551724137931034 | NOK |