| Multiple Linear Regression - Estimated Regression Equation |
| dzcg[t] = + 35.827194618634 + 0.620492354829152totid[t] -0.175207770002832ndzcg[t] + 0.0505564905142856`indc `[t] -0.267758201308649M1[t] -2.10353433741009M2[t] -4.31529303020741M3[t] -4.15092239169755M4[t] -3.98514743986063M5[t] -3.03513796721337M6[t] -2.9433276410124M7[t] -2.40598674775383M8[t] -0.370837857517617M9[t] -1.06772121231664M10[t] -1.31099541995592M11[t] -0.195264491163186t + e[t] |
| Multiple Linear Regression - Ordinary Least Squares | |||||
| Variable | Parameter | S.D. | T-STAT H0: parameter = 0 | 2-tail p-value | 1-tail p-value |
| (Intercept) | 35.827194618634 | 15.343124 | 2.3351 | 0.024059 | 0.01203 |
| totid | 0.620492354829152 | 0.131304 | 4.7256 | 2.3e-05 | 1.1e-05 |
| ndzcg | -0.175207770002832 | 0.190627 | -0.9191 | 0.362938 | 0.181469 |
| `indc ` | 0.0505564905142856 | 0.07609 | 0.6644 | 0.509807 | 0.254904 |
| M1 | -0.267758201308649 | 1.76059 | -0.1521 | 0.8798 | 0.4399 |
| M2 | -2.10353433741009 | 1.877751 | -1.1202 | 0.268554 | 0.134277 |
| M3 | -4.31529303020741 | 1.875068 | -2.3014 | 0.026054 | 0.013027 |
| M4 | -4.15092239169755 | 1.845966 | -2.2486 | 0.029478 | 0.014739 |
| M5 | -3.98514743986063 | 1.85268 | -2.151 | 0.036881 | 0.018441 |
| M6 | -3.03513796721337 | 1.845947 | -1.6442 | 0.107101 | 0.05355 |
| M7 | -2.9433276410124 | 1.850447 | -1.5906 | 0.1187 | 0.05935 |
| M8 | -2.40598674775383 | 1.840687 | -1.3071 | 0.197814 | 0.098907 |
| M9 | -0.370837857517617 | 1.851996 | -0.2002 | 0.842198 | 0.421099 |
| M10 | -1.06772121231664 | 1.844407 | -0.5789 | 0.565545 | 0.282773 |
| M11 | -1.31099541995592 | 1.834468 | -0.7146 | 0.478519 | 0.239259 |
| t | -0.195264491163186 | 0.032669 | -5.9771 | 0 | 0 |
| Multiple Linear Regression - Regression Statistics | |
| Multiple R | 0.89732527534081 |
| R-squared | 0.80519264976546 |
| Adjusted R-squared | 0.740256866353947 |
| F-TEST (value) | 12.3998296080108 |
| F-TEST (DF numerator) | 15 |
| F-TEST (DF denominator) | 45 |
| p-value | 2.39483988195843e-11 |
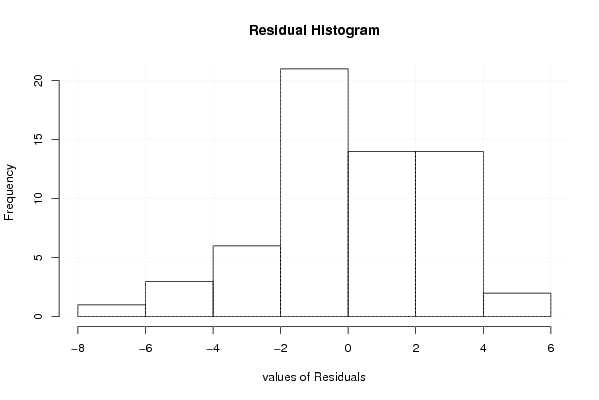
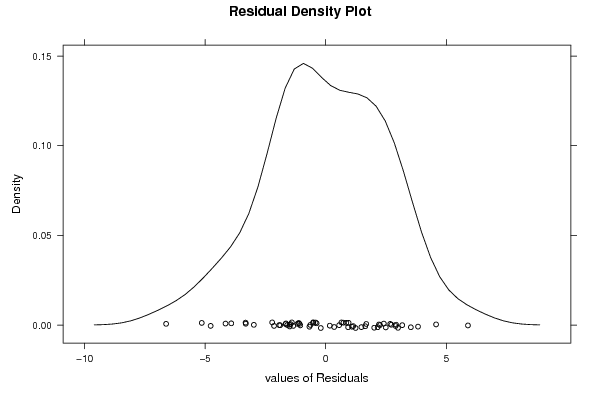
| Multiple Linear Regression - Residual Statistics | |
| Residual Standard Deviation | 2.89887556448711 |
| Sum Squared Residuals | 378.156579227121 |
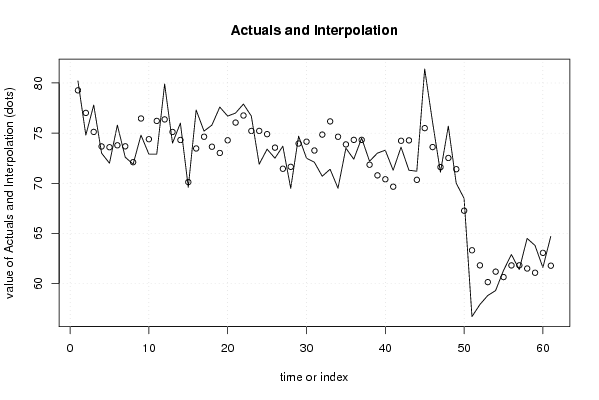
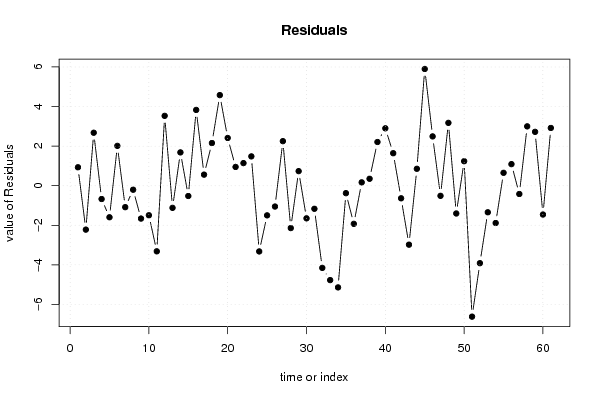
| Multiple Linear Regression - Actuals, Interpolation, and Residuals | |||
| Time or Index | Actuals | Interpolation Forecast | Residuals Prediction Error |
| 1 | 80.2 | 79.2688998518525 | 0.931100148147502 |
| 2 | 74.8 | 77.0186758046253 | -2.21867580462526 |
| 3 | 77.8 | 75.1221084090779 | 2.67789159092207 |
| 4 | 73 | 73.6735690447996 | -0.673569044799629 |
| 5 | 72 | 73.5949865574949 | -1.59498655749488 |
| 6 | 75.8 | 73.7863765152185 | 2.01362348478153 |
| 7 | 72.6 | 73.6853494885234 | -1.08534948852337 |
| 8 | 71.9 | 72.102772952459 | -0.202772952459035 |
| 9 | 74.8 | 76.4603526441141 | -1.6603526441141 |
| 10 | 72.9 | 74.393628419868 | -1.49362841986805 |
| 11 | 72.9 | 76.2160857841091 | -3.31608578410913 |
| 12 | 79.9 | 76.3689321800133 | 3.53106781998670 |
| 13 | 74 | 75.1179168414532 | -1.11791684145322 |
| 14 | 76 | 74.3167050832247 | 1.68329491677528 |
| 15 | 69.6 | 70.1205201980127 | -0.520520198012685 |
| 16 | 77.3 | 73.4702093174188 | 3.82979068258122 |
| 17 | 75.2 | 74.6407192951527 | 0.559280704847296 |
| 18 | 75.8 | 73.6428232575138 | 2.15717674248622 |
| 19 | 77.6 | 73.0219955592375 | 4.57800444076245 |
| 20 | 76.7 | 74.2885665573687 | 2.41143344263126 |
| 21 | 77 | 76.0511131991934 | 0.94888680080664 |
| 22 | 77.9 | 76.7576307627144 | 1.14236923728564 |
| 23 | 76.7 | 75.2182735702559 | 1.48172642974415 |
| 24 | 71.9 | 75.2222460689466 | -3.32224606894663 |
| 25 | 73.4 | 74.89863139035 | -1.49863139035005 |
| 26 | 72.5 | 73.5535912258479 | -1.0535912258479 |
| 27 | 73.7 | 71.4485434214636 | 2.25145657853643 |
| 28 | 69.5 | 71.641634403589 | -2.14163440358901 |
| 29 | 74.7 | 73.9630980677127 | 0.736901932287297 |
| 30 | 72.5 | 74.1487968977511 | -1.64879689775108 |
| 31 | 72.1 | 73.266273672088 | -1.166273672088 |
| 32 | 70.7 | 74.8536938797332 | -4.15369387973323 |
| 33 | 71.4 | 76.1707295219833 | -4.7707295219833 |
| 34 | 69.5 | 74.6394524165743 | -5.13945241657427 |
| 35 | 73.5 | 73.8766056358074 | -0.376605635807353 |
| 36 | 72.4 | 74.3273157512883 | -1.92731575128830 |
| 37 | 74.5 | 74.330220388747 | 0.169779611252972 |
| 38 | 72.2 | 71.8489622510979 | 0.351037748902109 |
| 39 | 73 | 70.790965013297 | 2.20903498670295 |
| 40 | 73.3 | 70.3990525885386 | 2.9009474114614 |
| 41 | 71.3 | 69.6576710325849 | 1.64232896741509 |
| 42 | 73.6 | 74.2368200284189 | -0.636820028418914 |
| 43 | 71.3 | 74.2793336967424 | -2.97933369674238 |
| 44 | 71.2 | 70.3447932441887 | 0.85520675581127 |
| 45 | 81.4 | 75.4990942842871 | 5.9009057157129 |
| 46 | 76.1 | 73.6087678405234 | 2.49123215947656 |
| 47 | 71.1 | 71.6113117970483 | -0.511311797048289 |
| 48 | 75.7 | 72.5244903700094 | 3.17550962999062 |
| 49 | 70 | 71.4030066836362 | -1.40300668363621 |
| 50 | 68.5 | 67.2620656352042 | 1.23793436479577 |
| 51 | 56.7 | 63.3178629581488 | -6.61786295814876 |
| 52 | 57.9 | 61.815534645654 | -3.91553464565398 |
| 53 | 58.8 | 60.1435250470548 | -1.3435250470548 |
| 54 | 59.3 | 61.1851833010978 | -1.88518330109776 |
| 55 | 61.3 | 60.6470475834087 | 0.652952416591306 |
| 56 | 62.9 | 61.8101733662503 | 1.08982663374973 |
| 57 | 61.4 | 61.8187103504221 | -0.41871035042214 |
| 58 | 64.5 | 61.5005205603199 | 2.99947943968011 |
| 59 | 63.8 | 61.0777232127794 | 2.72227678722063 |
| 60 | 61.6 | 63.0570156297424 | -1.45701562974238 |
| 61 | 64.7 | 61.781324843961 | 2.91867515603901 |
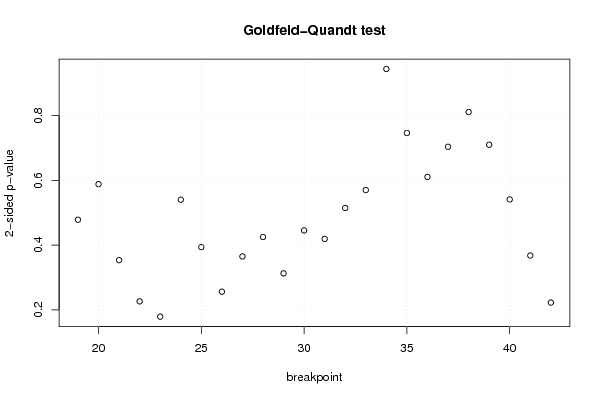
| Goldfeld-Quandt test for Heteroskedasticity | |||
| p-values | Alternative Hypothesis | ||
| breakpoint index | greater | 2-sided | less |
| 19 | 0.23925991950688 | 0.47851983901376 | 0.76074008049312 |
| 20 | 0.294213364505212 | 0.588426729010424 | 0.705786635494788 |
| 21 | 0.176763341045642 | 0.353526682091285 | 0.823236658954358 |
| 22 | 0.113087670523094 | 0.226175341046189 | 0.886912329476906 |
| 23 | 0.0894249561984708 | 0.178849912396942 | 0.910575043801529 |
| 24 | 0.270174427906442 | 0.540348855812884 | 0.729825572093558 |
| 25 | 0.196886163865332 | 0.393772327730664 | 0.803113836134668 |
| 26 | 0.128081803939589 | 0.256163607879179 | 0.87191819606041 |
| 27 | 0.18250092619244 | 0.36500185238488 | 0.81749907380756 |
| 28 | 0.212573525787618 | 0.425147051575235 | 0.787426474212382 |
| 29 | 0.156324486811328 | 0.312648973622656 | 0.843675513188672 |
| 30 | 0.222705341608857 | 0.445410683217713 | 0.777294658391143 |
| 31 | 0.209565888691486 | 0.419131777382972 | 0.790434111308514 |
| 32 | 0.257345844495958 | 0.514691688991916 | 0.742654155504042 |
| 33 | 0.285060572506748 | 0.570121145013496 | 0.714939427493252 |
| 34 | 0.472244810966617 | 0.944489621933233 | 0.527755189033383 |
| 35 | 0.373255935356234 | 0.746511870712468 | 0.626744064643766 |
| 36 | 0.305368434230863 | 0.610736868461727 | 0.694631565769137 |
| 37 | 0.351961377056051 | 0.703922754112102 | 0.648038622943949 |
| 38 | 0.405638335770558 | 0.811276671541117 | 0.594361664229442 |
| 39 | 0.355171179373265 | 0.71034235874653 | 0.644828820626735 |
| 40 | 0.270591876390886 | 0.541183752781772 | 0.729408123609114 |
| 41 | 0.183869841285086 | 0.367739682570173 | 0.816130158714914 |
| 42 | 0.111205806399792 | 0.222411612799585 | 0.888794193600208 |
| Meta Analysis of Goldfeld-Quandt test for Heteroskedasticity | |||
| Description | # significant tests | % significant tests | OK/NOK |
| 1% type I error level | 0 | 0 | OK |
| 5% type I error level | 0 | 0 | OK |
| 10% type I error level | 0 | 0 | OK |