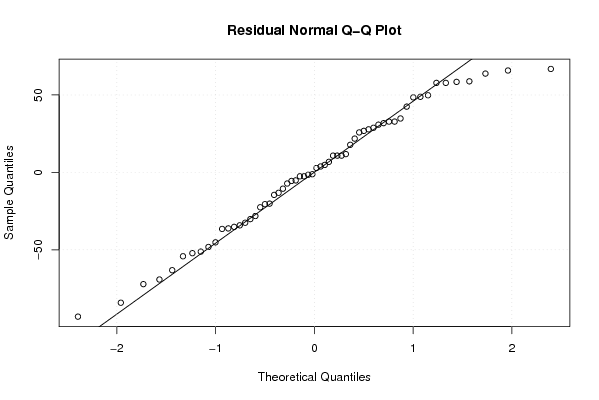
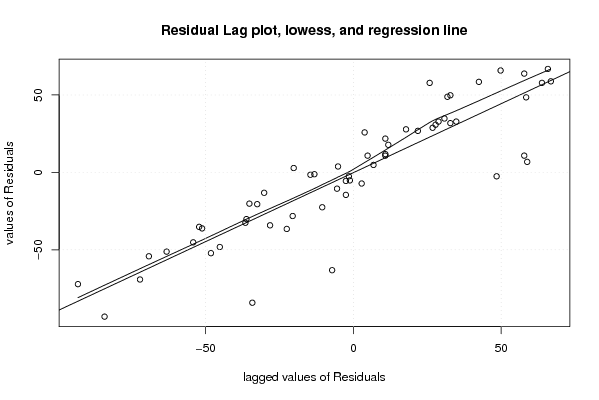
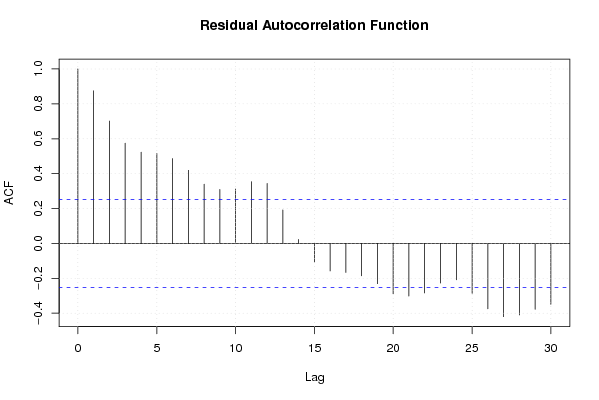
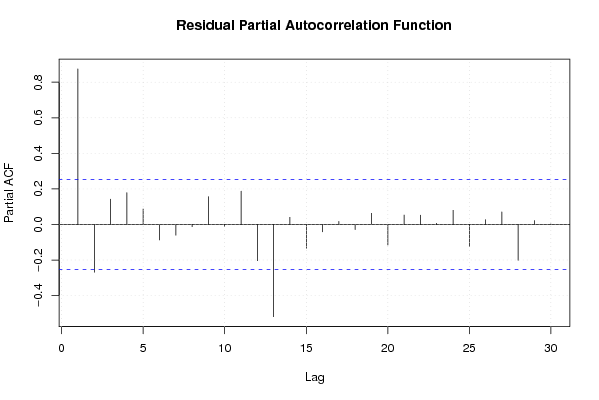
| Multiple Linear Regression - Estimated Regression Equation |
| Y[t] = + 562.191489361702 -23.6530278232406X[t] + e[t] |
| Multiple Linear Regression - Ordinary Least Squares | |||||
| Variable | Parameter | S.D. | T-STAT H0: parameter = 0 | 2-tail p-value | 1-tail p-value |
| (Intercept) | 562.191489361702 | 5.974896 | 94.0923 | 0 | 0 |
| X | -23.6530278232406 | 12.836135 | -1.8427 | 0.070487 | 0.035243 |
| Multiple Linear Regression - Regression Statistics | |
| Multiple R | 0.235171212976024 |
| R-squared | 0.0553054994126142 |
| Adjusted R-squared | 0.0390176631955904 |
| F-TEST (value) | 3.39550930373486 |
| F-TEST (DF numerator) | 1 |
| F-TEST (DF denominator) | 58 |
| p-value | 0.070486897756235 |
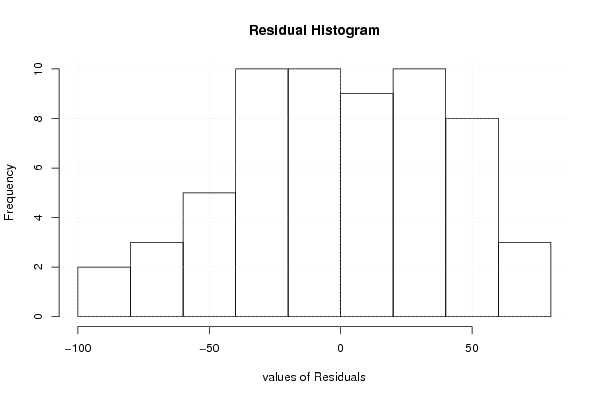
| Multiple Linear Regression - Residual Statistics | |
| Residual Standard Deviation | 40.961821451658 |
| Sum Squared Residuals | 97316.5073649755 |
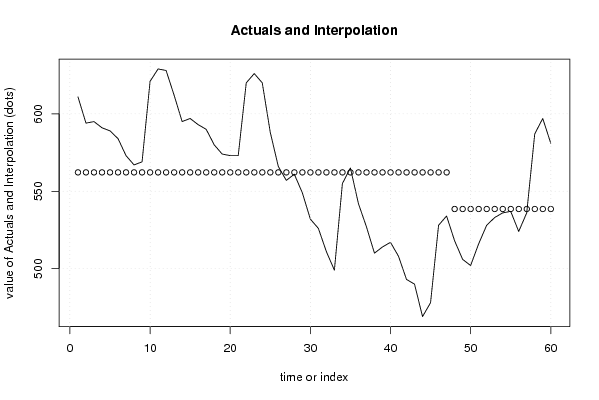
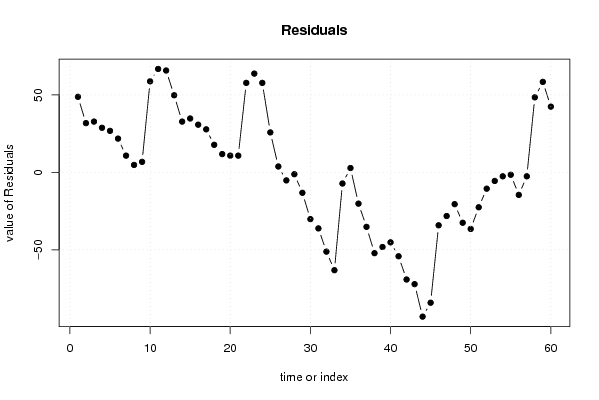
| Multiple Linear Regression - Actuals, Interpolation, and Residuals | |||
| Time or Index | Actuals | Interpolation Forecast | Residuals Prediction Error |
| 1 | 611 | 562.191489361702 | 48.8085106382982 |
| 2 | 594 | 562.191489361702 | 31.8085106382979 |
| 3 | 595 | 562.191489361702 | 32.8085106382979 |
| 4 | 591 | 562.191489361702 | 28.8085106382979 |
| 5 | 589 | 562.191489361702 | 26.8085106382979 |
| 6 | 584 | 562.191489361702 | 21.8085106382979 |
| 7 | 573 | 562.191489361702 | 10.8085106382979 |
| 8 | 567 | 562.191489361702 | 4.80851063829787 |
| 9 | 569 | 562.191489361702 | 6.80851063829787 |
| 10 | 621 | 562.191489361702 | 58.8085106382979 |
| 11 | 629 | 562.191489361702 | 66.8085106382979 |
| 12 | 628 | 562.191489361702 | 65.8085106382979 |
| 13 | 612 | 562.191489361702 | 49.8085106382979 |
| 14 | 595 | 562.191489361702 | 32.8085106382979 |
| 15 | 597 | 562.191489361702 | 34.8085106382979 |
| 16 | 593 | 562.191489361702 | 30.8085106382979 |
| 17 | 590 | 562.191489361702 | 27.8085106382979 |
| 18 | 580 | 562.191489361702 | 17.8085106382979 |
| 19 | 574 | 562.191489361702 | 11.8085106382979 |
| 20 | 573 | 562.191489361702 | 10.8085106382979 |
| 21 | 573 | 562.191489361702 | 10.8085106382979 |
| 22 | 620 | 562.191489361702 | 57.8085106382979 |
| 23 | 626 | 562.191489361702 | 63.8085106382979 |
| 24 | 620 | 562.191489361702 | 57.8085106382979 |
| 25 | 588 | 562.191489361702 | 25.8085106382979 |
| 26 | 566 | 562.191489361702 | 3.80851063829787 |
| 27 | 557 | 562.191489361702 | -5.19148936170213 |
| 28 | 561 | 562.191489361702 | -1.19148936170213 |
| 29 | 549 | 562.191489361702 | -13.1914893617021 |
| 30 | 532 | 562.191489361702 | -30.1914893617021 |
| 31 | 526 | 562.191489361702 | -36.1914893617021 |
| 32 | 511 | 562.191489361702 | -51.1914893617021 |
| 33 | 499 | 562.191489361702 | -63.1914893617021 |
| 34 | 555 | 562.191489361702 | -7.19148936170213 |
| 35 | 565 | 562.191489361702 | 2.80851063829787 |
| 36 | 542 | 562.191489361702 | -20.1914893617021 |
| 37 | 527 | 562.191489361702 | -35.1914893617021 |
| 38 | 510 | 562.191489361702 | -52.1914893617021 |
| 39 | 514 | 562.191489361702 | -48.1914893617021 |
| 40 | 517 | 562.191489361702 | -45.1914893617021 |
| 41 | 508 | 562.191489361702 | -54.1914893617021 |
| 42 | 493 | 562.191489361702 | -69.1914893617021 |
| 43 | 490 | 562.191489361702 | -72.1914893617021 |
| 44 | 469 | 562.191489361702 | -93.1914893617021 |
| 45 | 478 | 562.191489361702 | -84.1914893617021 |
| 46 | 528 | 562.191489361702 | -34.1914893617021 |
| 47 | 534 | 562.191489361702 | -28.1914893617021 |
| 48 | 518 | 538.538461538462 | -20.5384615384615 |
| 49 | 506 | 538.538461538462 | -32.5384615384615 |
| 50 | 502 | 538.538461538462 | -36.5384615384615 |
| 51 | 516 | 538.538461538462 | -22.5384615384615 |
| 52 | 528 | 538.538461538462 | -10.5384615384615 |
| 53 | 533 | 538.538461538462 | -5.53846153846154 |
| 54 | 536 | 538.538461538462 | -2.53846153846154 |
| 55 | 537 | 538.538461538462 | -1.53846153846154 |
| 56 | 524 | 538.538461538462 | -14.5384615384615 |
| 57 | 536 | 538.538461538462 | -2.53846153846154 |
| 58 | 587 | 538.538461538462 | 48.4615384615385 |
| 59 | 597 | 538.538461538462 | 58.4615384615385 |
| 60 | 581 | 538.538461538462 | 42.4615384615385 |
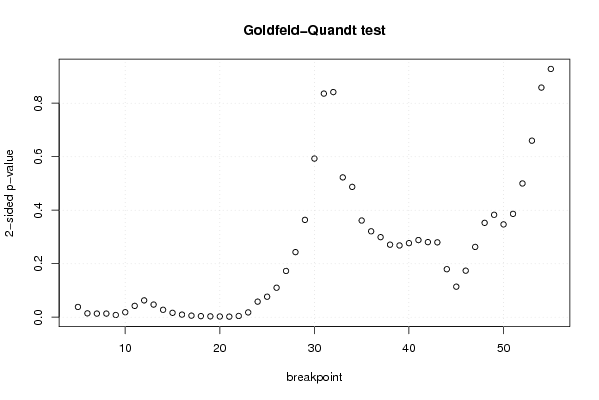
| Goldfeld-Quandt test for Heteroskedasticity | |||
| p-values | Alternative Hypothesis | ||
| breakpoint index | greater | 2-sided | less |
| 5 | 0.0191196987086397 | 0.0382393974172794 | 0.98088030129136 |
| 6 | 0.00714913941716335 | 0.0142982788343267 | 0.992850860582837 |
| 7 | 0.00672535916346196 | 0.0134507183269239 | 0.993274640836538 |
| 8 | 0.00670459287639376 | 0.0134091857527875 | 0.993295407123606 |
| 9 | 0.00408714914956368 | 0.00817429829912736 | 0.995912850850436 |
| 10 | 0.00928986187530165 | 0.0185797237506033 | 0.990710138124698 |
| 11 | 0.0211205696294501 | 0.0422411392589003 | 0.97887943037055 |
| 12 | 0.031408967084831 | 0.062817934169662 | 0.96859103291517 |
| 13 | 0.0235536961374826 | 0.0471073922749652 | 0.976446303862517 |
| 14 | 0.0138147727362416 | 0.0276295454724831 | 0.986185227263758 |
| 15 | 0.0081720306297986 | 0.0163440612595972 | 0.991827969370201 |
| 16 | 0.00479274681613789 | 0.00958549363227579 | 0.995207253183862 |
| 17 | 0.00284924452970747 | 0.00569848905941494 | 0.997150755470293 |
| 18 | 0.00195825290578001 | 0.00391650581156002 | 0.99804174709422 |
| 19 | 0.00157034362020517 | 0.00314068724041033 | 0.998429656379795 |
| 20 | 0.00125866743077242 | 0.00251733486154484 | 0.998741332569228 |
| 21 | 0.0009827964762945 | 0.001965592952589 | 0.999017203523705 |
| 22 | 0.00224394919392743 | 0.00448789838785485 | 0.997756050806073 |
| 23 | 0.00890816166213439 | 0.0178163233242688 | 0.991091838337866 |
| 24 | 0.0290453156717811 | 0.0580906313435622 | 0.970954684328219 |
| 25 | 0.0382508045099664 | 0.0765016090199328 | 0.961749195490034 |
| 26 | 0.0550599784692554 | 0.110119956938511 | 0.944940021530745 |
| 27 | 0.0864118039627778 | 0.172823607925556 | 0.913588196037222 |
| 28 | 0.121600243114090 | 0.243200486228179 | 0.87839975688591 |
| 29 | 0.181888056788101 | 0.363776113576201 | 0.8181119432119 |
| 30 | 0.296476861223953 | 0.592953722447906 | 0.703523138776047 |
| 31 | 0.41798342862505 | 0.8359668572501 | 0.58201657137495 |
| 32 | 0.579194038328074 | 0.841611923343852 | 0.420805961671926 |
| 33 | 0.738646311965449 | 0.522707376069102 | 0.261353688034551 |
| 34 | 0.756399546686023 | 0.487200906627953 | 0.243600453313977 |
| 35 | 0.819293469456018 | 0.361413061087964 | 0.180706530543982 |
| 36 | 0.839450576070787 | 0.321098847858427 | 0.160549423929213 |
| 37 | 0.85040477276851 | 0.299190454462981 | 0.149595227231490 |
| 38 | 0.864467148800974 | 0.271065702398052 | 0.135532851199026 |
| 39 | 0.865896496795584 | 0.268207006408832 | 0.134103503204416 |
| 40 | 0.861579628982873 | 0.276840742034255 | 0.138420371017127 |
| 41 | 0.855846059967713 | 0.288307880064574 | 0.144153940032287 |
| 42 | 0.859679200356536 | 0.280641599286928 | 0.140320799643464 |
| 43 | 0.860098044866498 | 0.279803910267003 | 0.139901955133502 |
| 44 | 0.910301399594078 | 0.179397200811844 | 0.0896986004059222 |
| 45 | 0.942996328964422 | 0.114007342071157 | 0.0570036710355784 |
| 46 | 0.913093394155127 | 0.173813211689745 | 0.0869066058448726 |
| 47 | 0.868677602138455 | 0.26264479572309 | 0.131322397861545 |
| 48 | 0.823638789167184 | 0.352722421665632 | 0.176361210832816 |
| 49 | 0.808607290371021 | 0.382785419257958 | 0.191392709628979 |
| 50 | 0.826515279734884 | 0.346969440530232 | 0.173484720265116 |
| 51 | 0.806861761804161 | 0.386276476391678 | 0.193138238195839 |
| 52 | 0.749986481968234 | 0.500027036063532 | 0.250013518031766 |
| 53 | 0.670033477349216 | 0.659933045301567 | 0.329966522650784 |
| 54 | 0.570762523004971 | 0.858474953990057 | 0.429237476995029 |
| 55 | 0.464069744573504 | 0.928139489147009 | 0.535930255426496 |
| Meta Analysis of Goldfeld-Quandt test for Heteroskedasticity | |||
| Description | # significant tests | % significant tests | OK/NOK |
| 1% type I error level | 8 | 0.156862745098039 | NOK |
| 5% type I error level | 18 | 0.352941176470588 | NOK |
| 10% type I error level | 21 | 0.411764705882353 | NOK |