| Multiple Linear Regression - Estimated Regression Equation |
| Bouw[t] = + 4555.54545454545 + 27.6397306397301Wman[t] + e[t] |
| Multiple Linear Regression - Ordinary Least Squares | |||||
| Variable | Parameter | S.D. | T-STAT H0: parameter = 0 | 2-tail p-value | 1-tail p-value |
| (Intercept) | 4555.54545454545 | 109.836209 | 41.4758 | 0 | 0 |
| Wman | 27.6397306397301 | 163.734153 | 0.1688 | 0.866535 | 0.433267 |
| Multiple Linear Regression - Regression Statistics | |
| Multiple R | 0.0221602099004452 |
| R-squared | 0.000491074902831788 |
| Adjusted R-squared | -0.0167418375988435 |
| F-TEST (value) | 0.0284963382007567 |
| F-TEST (DF numerator) | 1 |
| F-TEST (DF denominator) | 58 |
| p-value | 0.86653454062564 |
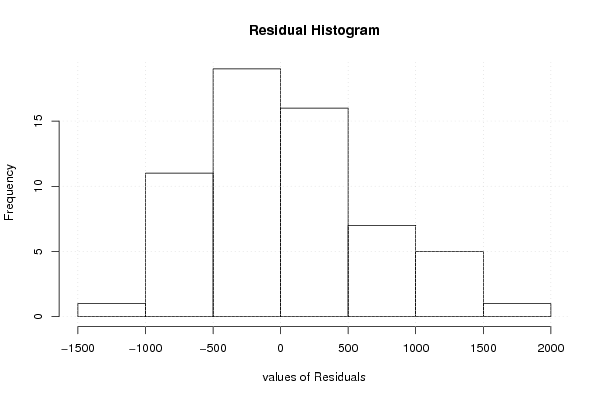
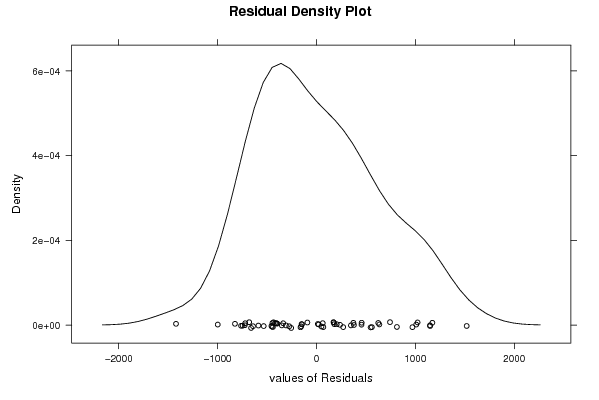
| Multiple Linear Regression - Residual Statistics | |
| Residual Standard Deviation | 630.960983764151 |
| Sum Squared Residuals | 23090482.2558923 |
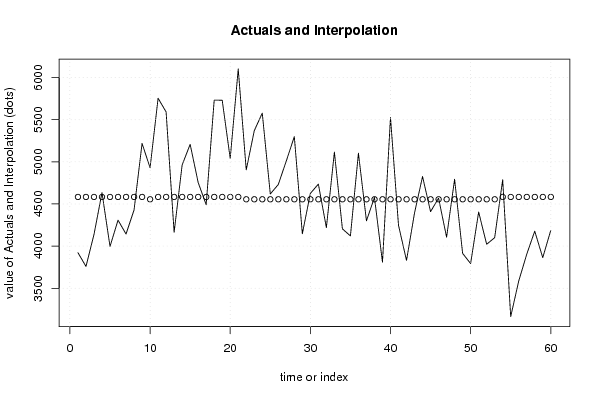
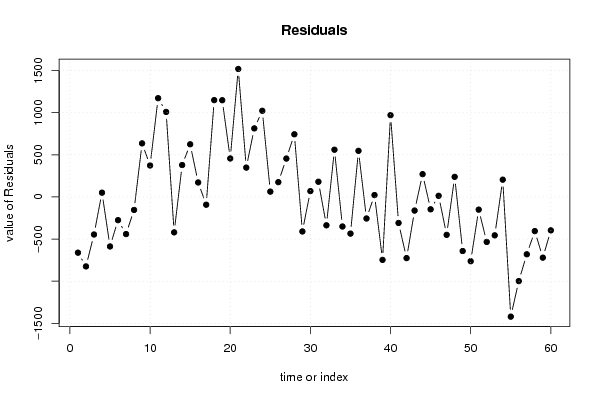
| Multiple Linear Regression - Actuals, Interpolation, and Residuals | |||
| Time or Index | Actuals | Interpolation Forecast | Residuals Prediction Error |
| 1 | 3922 | 4583.18518518520 | -661.185185185195 |
| 2 | 3759 | 4583.18518518518 | -824.185185185185 |
| 3 | 4138 | 4583.18518518518 | -445.185185185185 |
| 4 | 4634 | 4583.18518518518 | 50.8148148148154 |
| 5 | 3996 | 4583.18518518518 | -587.185185185185 |
| 6 | 4308 | 4583.18518518518 | -275.185185185185 |
| 7 | 4143 | 4583.18518518518 | -440.185185185185 |
| 8 | 4429 | 4583.18518518518 | -154.185185185185 |
| 9 | 5219 | 4583.18518518518 | 635.814814814815 |
| 10 | 4929 | 4555.54545454545 | 373.454545454545 |
| 11 | 5755 | 4583.18518518518 | 1171.81481481482 |
| 12 | 5592 | 4583.18518518518 | 1008.81481481482 |
| 13 | 4163 | 4583.18518518518 | -420.185185185185 |
| 14 | 4962 | 4583.18518518518 | 378.814814814815 |
| 15 | 5208 | 4583.18518518518 | 624.814814814815 |
| 16 | 4755 | 4583.18518518518 | 171.814814814815 |
| 17 | 4491 | 4583.18518518518 | -92.1851851851846 |
| 18 | 5732 | 4583.18518518518 | 1148.81481481482 |
| 19 | 5731 | 4583.18518518518 | 1147.81481481482 |
| 20 | 5040 | 4583.18518518518 | 456.814814814815 |
| 21 | 6102 | 4583.18518518518 | 1518.81481481482 |
| 22 | 4904 | 4555.54545454545 | 348.454545454545 |
| 23 | 5369 | 4555.54545454545 | 813.454545454545 |
| 24 | 5578 | 4555.54545454545 | 1022.45454545455 |
| 25 | 4619 | 4555.54545454545 | 63.4545454545454 |
| 26 | 4731 | 4555.54545454545 | 175.454545454545 |
| 27 | 5011 | 4555.54545454545 | 455.454545454545 |
| 28 | 5299 | 4555.54545454545 | 743.454545454545 |
| 29 | 4146 | 4555.54545454545 | -409.545454545455 |
| 30 | 4625 | 4555.54545454545 | 69.4545454545454 |
| 31 | 4736 | 4555.54545454545 | 180.454545454545 |
| 32 | 4219 | 4555.54545454545 | -336.545454545455 |
| 33 | 5116 | 4555.54545454545 | 560.454545454545 |
| 34 | 4205 | 4555.54545454545 | -350.545454545455 |
| 35 | 4121 | 4555.54545454545 | -434.545454545455 |
| 36 | 5103 | 4555.54545454545 | 547.454545454545 |
| 37 | 4300 | 4555.54545454545 | -255.545454545455 |
| 38 | 4578 | 4555.54545454545 | 22.4545454545454 |
| 39 | 3809 | 4555.54545454545 | -746.545454545455 |
| 40 | 5526 | 4555.54545454545 | 970.454545454545 |
| 41 | 4247 | 4555.54545454545 | -308.545454545455 |
| 42 | 3830 | 4555.54545454545 | -725.545454545455 |
| 43 | 4394 | 4555.54545454545 | -161.545454545455 |
| 44 | 4826 | 4555.54545454545 | 270.454545454545 |
| 45 | 4409 | 4555.54545454545 | -146.545454545455 |
| 46 | 4569 | 4555.54545454545 | 13.4545454545454 |
| 47 | 4106 | 4555.54545454545 | -449.545454545455 |
| 48 | 4794 | 4555.54545454545 | 238.454545454545 |
| 49 | 3914 | 4555.54545454545 | -641.545454545455 |
| 50 | 3793 | 4555.54545454545 | -762.545454545455 |
| 51 | 4405 | 4555.54545454545 | -150.545454545455 |
| 52 | 4022 | 4555.54545454545 | -533.545454545455 |
| 53 | 4100 | 4555.54545454545 | -455.545454545455 |
| 54 | 4788 | 4583.18518518518 | 204.814814814815 |
| 55 | 3163 | 4583.18518518518 | -1420.18518518518 |
| 56 | 3585 | 4583.18518518518 | -998.185185185185 |
| 57 | 3903 | 4583.18518518518 | -680.185185185185 |
| 58 | 4178 | 4583.18518518518 | -405.185185185185 |
| 59 | 3863 | 4583.18518518518 | -720.185185185185 |
| 60 | 4187 | 4583.18518518518 | -396.185185185185 |
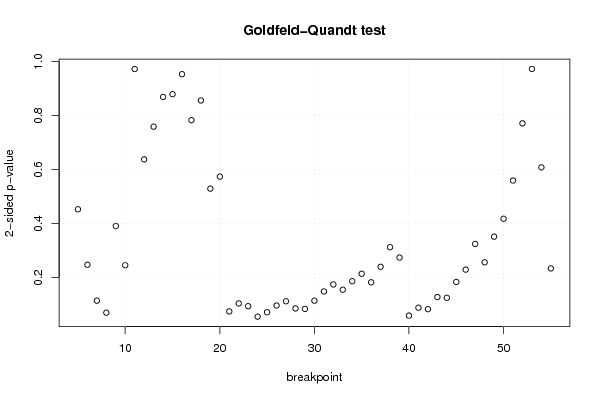
| Goldfeld-Quandt test for Heteroskedasticity | |||
| p-values | Alternative Hypothesis | ||
| breakpoint index | greater | 2-sided | less |
| 5 | 0.226167231683546 | 0.452334463367091 | 0.773832768316454 |
| 6 | 0.123389939704840 | 0.246779879409679 | 0.87661006029516 |
| 7 | 0.0568259631774179 | 0.113651926354836 | 0.943174036822582 |
| 8 | 0.0345410234984041 | 0.0690820469968081 | 0.965458976501596 |
| 9 | 0.195136551077712 | 0.390273102155423 | 0.804863448922288 |
| 10 | 0.122464952008046 | 0.244929904016093 | 0.877535047991954 |
| 11 | 0.513945759090611 | 0.972108481818778 | 0.486054240909389 |
| 12 | 0.681352254748792 | 0.637295490502416 | 0.318647745251208 |
| 13 | 0.620726285584331 | 0.758547428831337 | 0.379273714415669 |
| 14 | 0.565627571454926 | 0.868744857090148 | 0.434372428545074 |
| 15 | 0.56053614643047 | 0.878927707139061 | 0.439463853569531 |
| 16 | 0.476533329330878 | 0.953066658661756 | 0.523466670669122 |
| 17 | 0.391337366388709 | 0.782674732777417 | 0.608662633611291 |
| 18 | 0.572192270277242 | 0.855615459445517 | 0.427807729722758 |
| 19 | 0.735623547229274 | 0.528752905541451 | 0.264376452770726 |
| 20 | 0.71335539363146 | 0.573289212737081 | 0.286644606368540 |
| 21 | 0.9631220435144 | 0.0737559129712009 | 0.0368779564856005 |
| 22 | 0.94827725803744 | 0.103445483925121 | 0.0517227419625605 |
| 23 | 0.953429796632116 | 0.0931404067357679 | 0.0465702033678839 |
| 24 | 0.972822568451529 | 0.0543548630969427 | 0.0271774315484714 |
| 25 | 0.964655342726213 | 0.0706893145475732 | 0.0353446572737866 |
| 26 | 0.952228535748717 | 0.0955429285025664 | 0.0477714642512832 |
| 27 | 0.944309580366475 | 0.111380839267049 | 0.0556904196335246 |
| 28 | 0.95760359797217 | 0.0847928040556614 | 0.0423964020278307 |
| 29 | 0.95846078453203 | 0.083078430935941 | 0.0415392154679705 |
| 30 | 0.943304399559462 | 0.113391200881076 | 0.056695600440538 |
| 31 | 0.926105949202144 | 0.147788101595712 | 0.0738940507978562 |
| 32 | 0.91309503572247 | 0.173809928555059 | 0.0869049642775293 |
| 33 | 0.922867371411737 | 0.154265257176527 | 0.0771326285882634 |
| 34 | 0.907152636297478 | 0.185694727405044 | 0.0928473637025222 |
| 35 | 0.893290293416875 | 0.213419413166251 | 0.106709706583125 |
| 36 | 0.909191647035287 | 0.181616705929426 | 0.0908083529647132 |
| 37 | 0.880409594595661 | 0.239180810808678 | 0.119590405404339 |
| 38 | 0.844054880514554 | 0.311890238970892 | 0.155945119485446 |
| 39 | 0.863284582189693 | 0.273430835620613 | 0.136715417810307 |
| 40 | 0.970863819665182 | 0.0582723606696367 | 0.0291361803348184 |
| 41 | 0.956200224970154 | 0.087599550059693 | 0.0437997750298465 |
| 42 | 0.958952140840204 | 0.0820957183195916 | 0.0410478591597958 |
| 43 | 0.936511292707262 | 0.126977414585476 | 0.0634887072927379 |
| 44 | 0.937860382826233 | 0.124279234347535 | 0.0621396171737674 |
| 45 | 0.90849643852428 | 0.183007122951441 | 0.0915035614757205 |
| 46 | 0.885618219635417 | 0.228763560729167 | 0.114381780364583 |
| 47 | 0.838030513781202 | 0.323938972437595 | 0.161969486218798 |
| 48 | 0.872105334708755 | 0.25578933058249 | 0.127894665291245 |
| 49 | 0.824583721690507 | 0.350832556618986 | 0.175416278309493 |
| 50 | 0.791392419187493 | 0.417215161625013 | 0.208607580812507 |
| 51 | 0.720597329106989 | 0.558805341786022 | 0.279402670893011 |
| 52 | 0.61456688519752 | 0.77086622960496 | 0.38543311480248 |
| 53 | 0.486221003189370 | 0.972442006378739 | 0.51377899681063 |
| 54 | 0.696227769814154 | 0.607544460371692 | 0.303772230185846 |
| 55 | 0.883418700273877 | 0.233162599452246 | 0.116581299726123 |
| Meta Analysis of Goldfeld-Quandt test for Heteroskedasticity | |||
| Description | # significant tests | % significant tests | OK/NOK |
| 1% type I error level | 0 | 0 | OK |
| 5% type I error level | 0 | 0 | OK |
| 10% type I error level | 11 | 0.215686274509804 | NOK |