| Multiple Linear Regression - Estimated Regression Equation |
| Y[t] = + 0.29971047287334 -0.663822504572186X[t] + 1.08044916584715Y1[t] -0.0879835056614519Y2[t] -0.188245761093748Y3[t] + 0.0560742837520075Y4[t] + 0.00722853285851178t + e[t] |
| Multiple Linear Regression - Ordinary Least Squares | |||||
| Variable | Parameter | S.D. | T-STAT H0: parameter = 0 | 2-tail p-value | 1-tail p-value |
| (Intercept) | 0.29971047287334 | 0.072599 | 4.1283 | 0.000142 | 7.1e-05 |
| X | -0.663822504572186 | 0.155341 | -4.2733 | 8.8e-05 | 4.4e-05 |
| Y1 | 1.08044916584715 | 0.176589 | 6.1184 | 0 | 0 |
| Y2 | -0.0879835056614519 | 0.238677 | -0.3686 | 0.713991 | 0.356996 |
| Y3 | -0.188245761093748 | 0.242498 | -0.7763 | 0.441316 | 0.220658 |
| Y4 | 0.0560742837520075 | 0.135941 | 0.4125 | 0.681779 | 0.34089 |
| t | 0.00722853285851178 | 0.002356 | 3.0688 | 0.003498 | 0.001749 |
| Multiple Linear Regression - Regression Statistics | |
| Multiple R | 0.995432595103778 |
| R-squared | 0.990886051395043 |
| Adjusted R-squared | 0.989770057688313 |
| F-TEST (value) | 887.895734017145 |
| F-TEST (DF numerator) | 6 |
| F-TEST (DF denominator) | 49 |
| p-value | 0 |
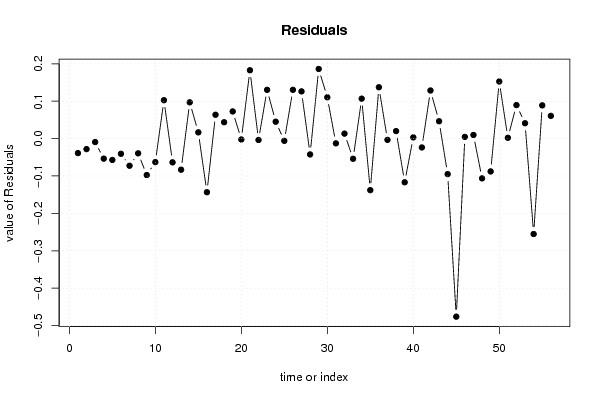
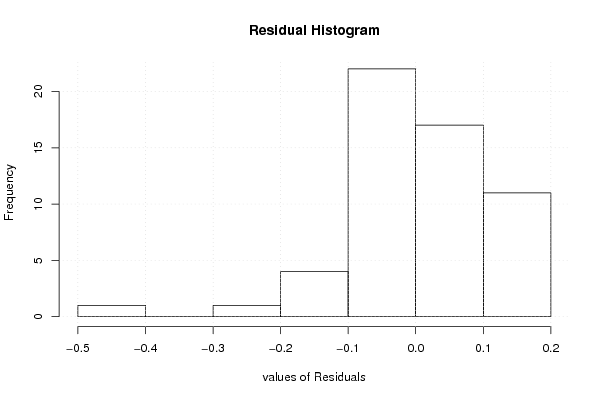
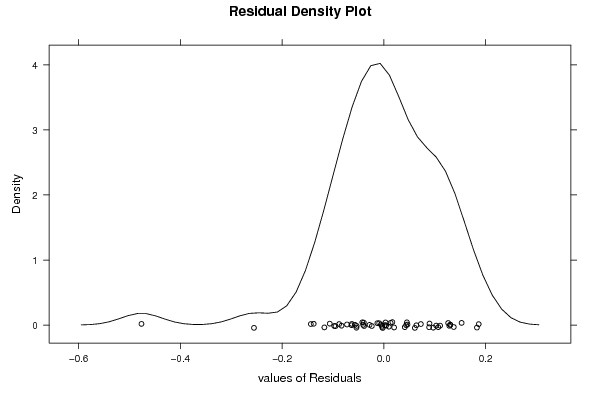
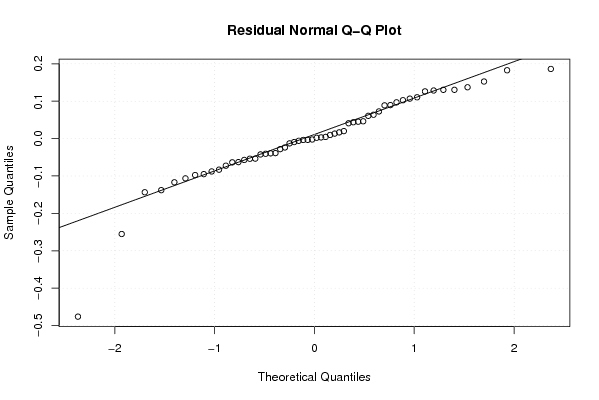
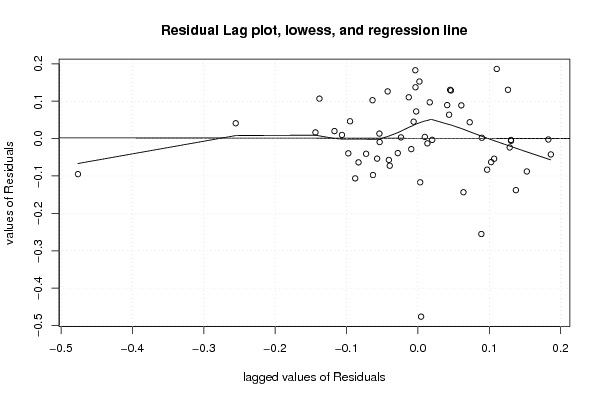
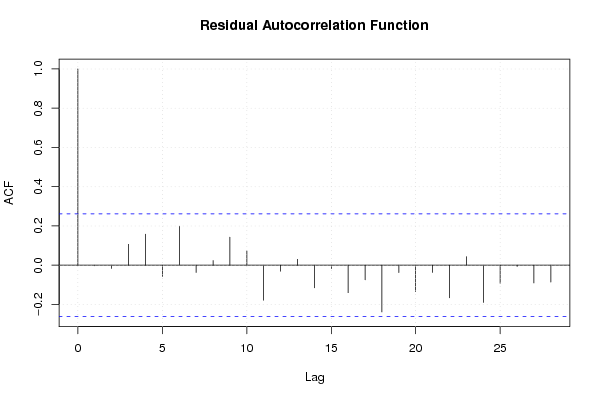
| Multiple Linear Regression - Residual Statistics | |
| Residual Standard Deviation | 0.117666128724429 |
| Sum Squared Residuals | 0.678420574600706 |
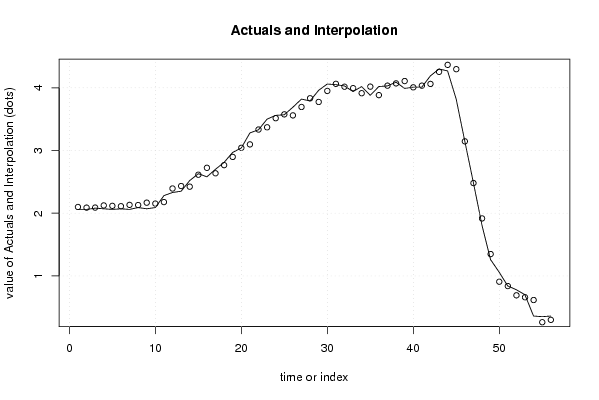
| Multiple Linear Regression - Actuals, Interpolation, and Residuals | |||
| Time or Index | Actuals | Interpolation Forecast | Residuals Prediction Error |
| 1 | 2.06 | 2.09879018211876 | -0.0387901821187631 |
| 2 | 2.06 | 2.08817857125920 | -0.028178571259196 |
| 3 | 2.08 | 2.08927643004804 | -0.00927643004804446 |
| 4 | 2.07 | 2.12356108995793 | -0.0535610899579341 |
| 5 | 2.06 | 2.11710397536970 | -0.0571039753697043 |
| 6 | 2.07 | 2.11064293640448 | -0.0406429364044849 |
| 7 | 2.06 | 2.13255973926406 | -0.0725597392640597 |
| 8 | 2.09 | 2.12942566018090 | -0.0394256601809034 |
| 9 | 2.07 | 2.16750430262299 | -0.0975043026229865 |
| 10 | 2.09 | 2.15292754744317 | -0.0629275474431691 |
| 11 | 2.28 | 2.17731661806152 | 0.102683381938479 |
| 12 | 2.33 | 2.39351796605220 | -0.0635179660521976 |
| 13 | 2.35 | 2.43316569023048 | -0.0831656902304765 |
| 14 | 2.52 | 2.42295882219009 | 0.0970411778099131 |
| 15 | 2.63 | 2.61334586898758 | 0.0166541310124201 |
| 16 | 2.58 | 2.72350541309256 | -0.143505413092557 |
| 17 | 2.7 | 2.63615300832505 | 0.0638469916749454 |
| 18 | 2.81 | 2.76626021088583 | 0.0437397891141733 |
| 19 | 2.97 | 2.89736059057556 | 0.0726394094244408 |
| 20 | 3.04 | 3.04238959882801 | -0.00238959882800619 |
| 21 | 3.28 | 3.09719409271991 | 0.182805907280085 |
| 22 | 3.33 | 3.33362042942316 | -0.00362042942316313 |
| 23 | 3.5 | 3.36955006133904 | 0.130449938660957 |
| 24 | 3.56 | 3.51480199430864 | 0.0451980056913601 |
| 25 | 3.57 | 3.57594582120133 | -0.00594582120132879 |
| 26 | 3.69 | 3.55950177018029 | 0.130498229819712 |
| 27 | 3.82 | 3.69374225045606 | 0.126257749543940 |
| 28 | 3.79 | 3.83235315360951 | -0.0423531536095107 |
| 29 | 3.96 | 3.77370160726289 | 0.186298392737110 |
| 30 | 4.06 | 3.94950296859332 | 0.110497031406685 |
| 31 | 4.05 | 4.06275625179467 | -0.0127562517946685 |
| 32 | 4.03 | 4.01669793453007 | 0.0133020654699339 |
| 33 | 3.94 | 3.99390537125672 | -0.0539053712567166 |
| 34 | 4.02 | 3.91314303528835 | 0.106856964711648 |
| 35 | 3.88 | 4.01793018930852 | -0.137930189308521 |
| 36 | 4.02 | 3.88267779131891 | 0.137322208681087 |
| 37 | 4.03 | 4.03338055176345 | -0.00338055176344775 |
| 38 | 4.09 | 4.06993623474111 | 0.0200637652588859 |
| 39 | 3.99 | 4.10690707621543 | -0.116907076215434 |
| 40 | 4.01 | 4.00677962426389 | 0.00322037573611233 |
| 41 | 4.01 | 4.03368148817738 | -0.0236814881773826 |
| 42 | 4.19 | 4.06133938405716 | 0.12866061594284 |
| 43 | 4.3 | 4.25367642317109 | 0.0463235768289148 |
| 44 | 4.27 | 4.36503881892876 | -0.0950388189287623 |
| 45 | 3.82 | 4.29629145419222 | -0.476291454192224 |
| 46 | 3.15 | 3.14552120037222 | 0.00447879962777656 |
| 47 | 2.49 | 2.48025691370633 | 0.00974308629367192 |
| 48 | 1.81 | 1.91636630987852 | -0.106366309878517 |
| 49 | 1.26 | 1.34784975594193 | -0.0878497559419297 |
| 50 | 1.06 | 0.907332463642322 | 0.152667536357678 |
| 51 | 0.84 | 0.837860181712625 | 0.00213981828737486 |
| 52 | 0.78 | 0.690391254867249 | 0.089608745132751 |
| 53 | 0.7 | 0.658957505175597 | 0.0410424948244032 |
| 54 | 0.36 | 0.615228325796246 | -0.255228325796246 |
| 55 | 0.35 | 0.261101225959824 | 0.0888987740401757 |
| 56 | 0.36 | 0.299134862947138 | 0.0608651370528618 |
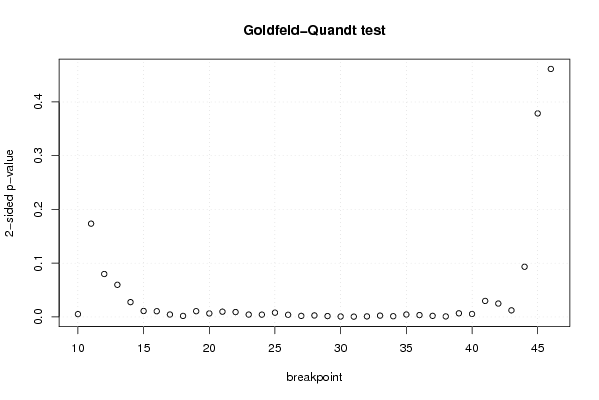
| Goldfeld-Quandt test for Heteroskedasticity | |||
| p-values | Alternative Hypothesis | ||
| breakpoint index | greater | 2-sided | less |
| 10 | 0.00259481648899120 | 0.00518963297798239 | 0.99740518351101 |
| 11 | 0.0867610024730611 | 0.173522004946122 | 0.913238997526939 |
| 12 | 0.0399106217978815 | 0.079821243595763 | 0.960089378202118 |
| 13 | 0.0298578833609049 | 0.0597157667218098 | 0.970142116639095 |
| 14 | 0.0137399987231031 | 0.0274799974462061 | 0.986260001276897 |
| 15 | 0.00550503648949869 | 0.0110100729789974 | 0.994494963510501 |
| 16 | 0.00531061806158874 | 0.0106212361231775 | 0.994689381938411 |
| 17 | 0.00221413424692345 | 0.0044282684938469 | 0.997785865753076 |
| 18 | 0.000894917185395584 | 0.00178983437079117 | 0.999105082814604 |
| 19 | 0.00532102022337969 | 0.0106420404467594 | 0.99467897977662 |
| 20 | 0.00323652729014484 | 0.00647305458028969 | 0.996763472709855 |
| 21 | 0.00485079229163622 | 0.00970158458327244 | 0.995149207708364 |
| 22 | 0.00449469133516393 | 0.00898938267032787 | 0.995505308664836 |
| 23 | 0.00215993835543989 | 0.00431987671087977 | 0.99784006164456 |
| 24 | 0.00210345550151814 | 0.00420691100303627 | 0.997896544498482 |
| 25 | 0.0039239861705777 | 0.0078479723411554 | 0.996076013829422 |
| 26 | 0.00196169696979057 | 0.00392339393958114 | 0.99803830303021 |
| 27 | 0.000943696442017871 | 0.00188739288403574 | 0.999056303557982 |
| 28 | 0.00137176950101815 | 0.00274353900203629 | 0.998628230498982 |
| 29 | 0.000765050882974664 | 0.00153010176594933 | 0.999234949117025 |
| 30 | 0.000361972503139535 | 0.00072394500627907 | 0.99963802749686 |
| 31 | 0.000235211628896379 | 0.000470423257792759 | 0.999764788371104 |
| 32 | 0.000472915844283051 | 0.000945831688566102 | 0.999527084155717 |
| 33 | 0.00119184172626076 | 0.00238368345252151 | 0.998808158273739 |
| 34 | 0.000637731488203203 | 0.00127546297640641 | 0.999362268511797 |
| 35 | 0.00222762991629438 | 0.00445525983258877 | 0.997772370083706 |
| 36 | 0.00169644746846205 | 0.0033928949369241 | 0.998303552531538 |
| 37 | 0.000994162315617526 | 0.00198832463123505 | 0.999005837684382 |
| 38 | 0.000464625112479599 | 0.000929250224959199 | 0.99953537488752 |
| 39 | 0.00333831634734398 | 0.00667663269468795 | 0.996661683652656 |
| 40 | 0.00273047919558176 | 0.00546095839116353 | 0.997269520804418 |
| 41 | 0.0148574088047133 | 0.0297148176094266 | 0.985142591195287 |
| 42 | 0.0124231240985120 | 0.0248462481970241 | 0.987576875901488 |
| 43 | 0.00610574588243238 | 0.0122114917648648 | 0.993894254117568 |
| 44 | 0.0466559393182693 | 0.0933118786365385 | 0.95334406068173 |
| 45 | 0.189303419417153 | 0.378606838834307 | 0.810696580582847 |
| 46 | 0.230691054831366 | 0.461382109662732 | 0.769308945168634 |
| Meta Analysis of Goldfeld-Quandt test for Heteroskedasticity | |||
| Description | # significant tests | % significant tests | OK/NOK |
| 1% type I error level | 24 | 0.648648648648649 | NOK |
| 5% type I error level | 31 | 0.837837837837838 | NOK |
| 10% type I error level | 34 | 0.918918918918919 | NOK |