Free Statistics

of Irreproducible Research!

Author's title

Author*The author of this computation has been verified*
R Software Modulerwasp_multipleregression.wasp
Title produced by softwareMultiple Regression
Date of computationThu, 19 Nov 2009 11:39:22 -0700
Cite this page as followsStatistical Computations at FreeStatistics.org, Office for Research Development and Education, URL https://freestatistics.org/blog/index.php?v=date/2009/Nov/19/t1258656017ergj5q7ax7miho1.htm/, Retrieved Fri, 19 Apr 2024 09:59:30 +0000
Statistical Computations at FreeStatistics.org, Office for Research Development and Education, URL https://freestatistics.org/blog/index.php?pk=57885, Retrieved Fri, 19 Apr 2024 09:59:30 +0000
QR Codes:

Original text written by user:Multiple lineair regression software (5)
IsPrivate?No (this computation is public)
User-defined keywords
Estimated Impact182
Family? (F = Feedback message, R = changed R code, M = changed R Module, P = changed Parameters, D = changed Data)
-     [Multiple Regression] [Q1 The Seatbeltlaw] [2007-11-14 19:27:43] [8cd6641b921d30ebe00b648d1481bba0]
- RM D  [Multiple Regression] [Seatbelt] [2009-11-12 14:14:11] [b98453cac15ba1066b407e146608df68]
-    D      [Multiple Regression] [shw7: Multiple li...] [2009-11-19 18:39:22] [7a39e26d7a09dd77604df90cb29f8d39] [Current]
-   P         [Multiple Regression] [Paper: Y(t-2) met...] [2009-12-13 12:27:32] [3c8b83428ce260cd44df892bb7619588]
-               [Multiple Regression] [Y(t-2) met lineai...] [2009-12-17 17:14:53] [1433a524809eda02c3198b3ae6eebb69]
Feedback Forum

Post a new message
Dataseries X:
0.7905	0.313	0.7744	0.779
0.7719	0.364	0.7905	0.7744
0.7811	0.363	0.7719	0.7905
0.7557	-0.155	0.7811	0.7719
0.7637	0.052	0.7557	0.7811
0.7595	0.568	0.7637	0.7557
0.7471	0.668	0.7595	0.7637
0.7615	1.378	0.7471	0.7595
0.7487	0.252	0.7615	0.7471
0.7389	-0.402	0.7487	0.7615
0.7337	-0.05	0.7389	0.7487
0.751	0.555	0.7337	0.7389
0.7382	0.05	0.751	0.7337
0.7159	0.15	0.7382	0.751
0.7542	0.45	0.7159	0.7382
0.7636	0.299	0.7542	0.7159
0.7433	0.199	0.7636	0.7542
0.7658	0.496	0.7433	0.7636
0.7627	0.444	0.7658	0.7433
0.748	-0.393	0.7627	0.7658
0.7692	-0.444	0.748	0.7627
0.785	0.198	0.7692	0.748
0.7913	0.494	0.785	0.7692
0.772	0.133	0.7913	0.785
0.788	0.388	0.772	0.7913
0.807	0.484	0.788	0.772
0.8268	0.278	0.807	0.788
0.8244	0.369	0.8268	0.807
0.8487	0.165	0.8244	0.8268
0.8572	0.155	0.8487	0.8244
0.8214	0.087	0.8572	0.8487
0.8827	0.414	0.8214	0.8572
0.9216	0.36	0.8827	0.8214
0.8865	0.975	0.9216	0.8827
0.8816	0.27	0.8865	0.9216
0.8884	0.359	0.8816	0.8865
0.9466	0.169	0.8884	0.8816
0.918	0.381	0.9466	0.8884
0.9337	0.154	0.918	0.9466
0.9559	0.486	0.9337	0.918
0.9626	0.925	0.9559	0.9337
0.9434	0.728	0.9626	0.9559
0.8639	-0.014	0.9434	0.9626
0.7996	0.046	0.8639	0.9434
0.668	-0.819	0.7996	0.8639
0.6572	-1.674	0.668	0.7996
0.6928	-0.788	0.6572	0.668
0.6438	0.279	0.6928	0.6572
0.6454	0.396	0.6438	0.6928
0.6873	-0.141	0.6454	0.6438
0.7265	-0.019	0.6873	0.6454
0.7912	0.099	0.7265	0.6873
0.8114	0.742	0.7912	0.7265
0.8281	0.005	0.8114	0.7912
0.8393	0.448	0.8281	0.8114


Summary of computational transaction
Raw Inputview raw input (R code)
Raw Outputview raw output of R engine
Computing time3 seconds
R Server'Gwilym Jenkins' @ 72.249.127.135

\begin{tabular}{lllllllll}
\hline
Summary of computational transaction \tabularnewline
Raw Input & view raw input (R code)  \tabularnewline
Raw Output & view raw output of R engine  \tabularnewline
Computing time & 3 seconds \tabularnewline
R Server & 'Gwilym Jenkins' @ 72.249.127.135 \tabularnewline
\hline
\end{tabular}
%Source: https://freestatistics.org/blog/index.php?pk=57885&T=0

[TABLE]
[ROW][C]Summary of computational transaction[/C][/ROW]
[ROW][C]Raw Input[/C][C]view raw input (R code) [/C][/ROW]
[ROW][C]Raw Output[/C][C]view raw output of R engine [/C][/ROW]
[ROW][C]Computing time[/C][C]3 seconds[/C][/ROW]
[ROW][C]R Server[/C][C]'Gwilym Jenkins' @ 72.249.127.135[/C][/ROW]
[/TABLE]
Source: https://freestatistics.org/blog/index.php?pk=57885&T=0

Globally Unique Identifier (entire table): ba.freestatistics.org/blog/index.php?pk=57885&T=0

As an alternative you can also use a QR Code:  

The GUIDs for individual cells are displayed in the table below:

Summary of computational transaction
Raw Inputview raw input (R code)
Raw Outputview raw output of R engine
Computing time3 seconds
R Server'Gwilym Jenkins' @ 72.249.127.135


Multiple Linear Regression - Estimated Regression Equation
USDOLLAR[t] = + 0.078110740623702 + 0.0139385911634161Amerikaanse_inflatie[t] + 1.12979723066344`Y[t-1]`[t] -0.264538499966401`Y[t-2]`[t] + 0.0327237110510389M1[t] + 0.0104818715294112M2[t] + 0.0407995808594032M3[t] + 0.0265051646608203M4[t] + 0.0222423674857073M5[t] + 0.0220179199741573M6[t] -0.00472949651591212M7[t] + 0.0249234761846346M8[t] + 0.00314997812565103M9[t] + 0.0173613481476963M10[t] + 0.0278331600231446M11[t] + 0.000283993595009668t + e[t]

\begin{tabular}{lllllllll}
\hline
Multiple Linear Regression - Estimated Regression Equation \tabularnewline
USDOLLAR[t] =  +  0.078110740623702 +  0.0139385911634161Amerikaanse_inflatie[t] +  1.12979723066344`Y[t-1]`[t] -0.264538499966401`Y[t-2]`[t] +  0.0327237110510389M1[t] +  0.0104818715294112M2[t] +  0.0407995808594032M3[t] +  0.0265051646608203M4[t] +  0.0222423674857073M5[t] +  0.0220179199741573M6[t] -0.00472949651591212M7[t] +  0.0249234761846346M8[t] +  0.00314997812565103M9[t] +  0.0173613481476963M10[t] +  0.0278331600231446M11[t] +  0.000283993595009668t  + e[t] \tabularnewline
\hline
\end{tabular}
%Source: https://freestatistics.org/blog/index.php?pk=57885&T=1

[TABLE]
[ROW][C]Multiple Linear Regression - Estimated Regression Equation[/C][/ROW]
[ROW][C]USDOLLAR[t] =  +  0.078110740623702 +  0.0139385911634161Amerikaanse_inflatie[t] +  1.12979723066344`Y[t-1]`[t] -0.264538499966401`Y[t-2]`[t] +  0.0327237110510389M1[t] +  0.0104818715294112M2[t] +  0.0407995808594032M3[t] +  0.0265051646608203M4[t] +  0.0222423674857073M5[t] +  0.0220179199741573M6[t] -0.00472949651591212M7[t] +  0.0249234761846346M8[t] +  0.00314997812565103M9[t] +  0.0173613481476963M10[t] +  0.0278331600231446M11[t] +  0.000283993595009668t  + e[t][/C][/ROW]
[/TABLE]
Source: https://freestatistics.org/blog/index.php?pk=57885&T=1

Globally Unique Identifier (entire table): ba.freestatistics.org/blog/index.php?pk=57885&T=1

As an alternative you can also use a QR Code:  

The GUIDs for individual cells are displayed in the table below:

Multiple Linear Regression - Estimated Regression Equation
USDOLLAR[t] = + 0.078110740623702 + 0.0139385911634161Amerikaanse_inflatie[t] + 1.12979723066344`Y[t-1]`[t] -0.264538499966401`Y[t-2]`[t] + 0.0327237110510389M1[t] + 0.0104818715294112M2[t] + 0.0407995808594032M3[t] + 0.0265051646608203M4[t] + 0.0222423674857073M5[t] + 0.0220179199741573M6[t] -0.00472949651591212M7[t] + 0.0249234761846346M8[t] + 0.00314997812565103M9[t] + 0.0173613481476963M10[t] + 0.0278331600231446M11[t] + 0.000283993595009668t + e[t]


Multiple Linear Regression - Ordinary Least Squares
VariableParameterS.D.T-STATH0: parameter = 02-tail p-value1-tail p-value
(Intercept)0.0781107406237020.0492631.58560.1209070.060453
Amerikaanse_inflatie0.01393859116341610.0139590.99850.3241790.162089
`Y[t-1]`1.129797230663440.1907695.92231e-060
`Y[t-2]`-0.2645384999664010.177375-1.49140.14390.07195
M10.03272371105103890.0219191.4930.1434920.071746
M20.01048187152941120.0219160.47830.6351270.317563
M30.04079958085940320.02181.87150.0687880.034394
M40.02650516466082030.0222631.19050.241030.120515
M50.02224236748570730.0218761.01670.3155390.15777
M60.02201791997415730.021931.0040.3215620.160781
M7-0.004729496515912120.022003-0.2150.8309250.415462
M80.02492347618463460.0240811.0350.3070480.153524
M90.003149978125651030.024020.13110.8963390.448169
M100.01736134814769630.0238990.72640.4719110.235956
M110.02783316002314460.0232481.19720.2384450.119222
t0.0002839935950096680.0002980.95240.3467410.17337

\begin{tabular}{lllllllll}
\hline
Multiple Linear Regression - Ordinary Least Squares \tabularnewline
Variable & Parameter & S.D. & T-STATH0: parameter = 0 & 2-tail p-value & 1-tail p-value \tabularnewline
(Intercept) & 0.078110740623702 & 0.049263 & 1.5856 & 0.120907 & 0.060453 \tabularnewline
Amerikaanse_inflatie & 0.0139385911634161 & 0.013959 & 0.9985 & 0.324179 & 0.162089 \tabularnewline
`Y[t-1]` & 1.12979723066344 & 0.190769 & 5.9223 & 1e-06 & 0 \tabularnewline
`Y[t-2]` & -0.264538499966401 & 0.177375 & -1.4914 & 0.1439 & 0.07195 \tabularnewline
M1 & 0.0327237110510389 & 0.021919 & 1.493 & 0.143492 & 0.071746 \tabularnewline
M2 & 0.0104818715294112 & 0.021916 & 0.4783 & 0.635127 & 0.317563 \tabularnewline
M3 & 0.0407995808594032 & 0.0218 & 1.8715 & 0.068788 & 0.034394 \tabularnewline
M4 & 0.0265051646608203 & 0.022263 & 1.1905 & 0.24103 & 0.120515 \tabularnewline
M5 & 0.0222423674857073 & 0.021876 & 1.0167 & 0.315539 & 0.15777 \tabularnewline
M6 & 0.0220179199741573 & 0.02193 & 1.004 & 0.321562 & 0.160781 \tabularnewline
M7 & -0.00472949651591212 & 0.022003 & -0.215 & 0.830925 & 0.415462 \tabularnewline
M8 & 0.0249234761846346 & 0.024081 & 1.035 & 0.307048 & 0.153524 \tabularnewline
M9 & 0.00314997812565103 & 0.02402 & 0.1311 & 0.896339 & 0.448169 \tabularnewline
M10 & 0.0173613481476963 & 0.023899 & 0.7264 & 0.471911 & 0.235956 \tabularnewline
M11 & 0.0278331600231446 & 0.023248 & 1.1972 & 0.238445 & 0.119222 \tabularnewline
t & 0.000283993595009668 & 0.000298 & 0.9524 & 0.346741 & 0.17337 \tabularnewline
\hline
\end{tabular}
%Source: https://freestatistics.org/blog/index.php?pk=57885&T=2

[TABLE]
[ROW][C]Multiple Linear Regression - Ordinary Least Squares[/C][/ROW]
[ROW][C]Variable[/C][C]Parameter[/C][C]S.D.[/C][C]T-STATH0: parameter = 0[/C][C]2-tail p-value[/C][C]1-tail p-value[/C][/ROW]
[ROW][C](Intercept)[/C][C]0.078110740623702[/C][C]0.049263[/C][C]1.5856[/C][C]0.120907[/C][C]0.060453[/C][/ROW]
[ROW][C]Amerikaanse_inflatie[/C][C]0.0139385911634161[/C][C]0.013959[/C][C]0.9985[/C][C]0.324179[/C][C]0.162089[/C][/ROW]
[ROW][C]`Y[t-1]`[/C][C]1.12979723066344[/C][C]0.190769[/C][C]5.9223[/C][C]1e-06[/C][C]0[/C][/ROW]
[ROW][C]`Y[t-2]`[/C][C]-0.264538499966401[/C][C]0.177375[/C][C]-1.4914[/C][C]0.1439[/C][C]0.07195[/C][/ROW]
[ROW][C]M1[/C][C]0.0327237110510389[/C][C]0.021919[/C][C]1.493[/C][C]0.143492[/C][C]0.071746[/C][/ROW]
[ROW][C]M2[/C][C]0.0104818715294112[/C][C]0.021916[/C][C]0.4783[/C][C]0.635127[/C][C]0.317563[/C][/ROW]
[ROW][C]M3[/C][C]0.0407995808594032[/C][C]0.0218[/C][C]1.8715[/C][C]0.068788[/C][C]0.034394[/C][/ROW]
[ROW][C]M4[/C][C]0.0265051646608203[/C][C]0.022263[/C][C]1.1905[/C][C]0.24103[/C][C]0.120515[/C][/ROW]
[ROW][C]M5[/C][C]0.0222423674857073[/C][C]0.021876[/C][C]1.0167[/C][C]0.315539[/C][C]0.15777[/C][/ROW]
[ROW][C]M6[/C][C]0.0220179199741573[/C][C]0.02193[/C][C]1.004[/C][C]0.321562[/C][C]0.160781[/C][/ROW]
[ROW][C]M7[/C][C]-0.00472949651591212[/C][C]0.022003[/C][C]-0.215[/C][C]0.830925[/C][C]0.415462[/C][/ROW]
[ROW][C]M8[/C][C]0.0249234761846346[/C][C]0.024081[/C][C]1.035[/C][C]0.307048[/C][C]0.153524[/C][/ROW]
[ROW][C]M9[/C][C]0.00314997812565103[/C][C]0.02402[/C][C]0.1311[/C][C]0.896339[/C][C]0.448169[/C][/ROW]
[ROW][C]M10[/C][C]0.0173613481476963[/C][C]0.023899[/C][C]0.7264[/C][C]0.471911[/C][C]0.235956[/C][/ROW]
[ROW][C]M11[/C][C]0.0278331600231446[/C][C]0.023248[/C][C]1.1972[/C][C]0.238445[/C][C]0.119222[/C][/ROW]
[ROW][C]t[/C][C]0.000283993595009668[/C][C]0.000298[/C][C]0.9524[/C][C]0.346741[/C][C]0.17337[/C][/ROW]
[/TABLE]
Source: https://freestatistics.org/blog/index.php?pk=57885&T=2

Globally Unique Identifier (entire table): ba.freestatistics.org/blog/index.php?pk=57885&T=2

As an alternative you can also use a QR Code:  

The GUIDs for individual cells are displayed in the table below:

Multiple Linear Regression - Ordinary Least Squares
VariableParameterS.D.T-STATH0: parameter = 02-tail p-value1-tail p-value
(Intercept)0.0781107406237020.0492631.58560.1209070.060453
Amerikaanse_inflatie0.01393859116341610.0139590.99850.3241790.162089
`Y[t-1]`1.129797230663440.1907695.92231e-060
`Y[t-2]`-0.2645384999664010.177375-1.49140.14390.07195
M10.03272371105103890.0219191.4930.1434920.071746
M20.01048187152941120.0219160.47830.6351270.317563
M30.04079958085940320.02181.87150.0687880.034394
M40.02650516466082030.0222631.19050.241030.120515
M50.02224236748570730.0218761.01670.3155390.15777
M60.02201791997415730.021931.0040.3215620.160781
M7-0.004729496515912120.022003-0.2150.8309250.415462
M80.02492347618463460.0240811.0350.3070480.153524
M90.003149978125651030.024020.13110.8963390.448169
M100.01736134814769630.0238990.72640.4719110.235956
M110.02783316002314460.0232481.19720.2384450.119222
t0.0002839935950096680.0002980.95240.3467410.17337


Multiple Linear Regression - Regression Statistics
Multiple R0.939006435347887
R-squared0.881733085624745
Adjusted R-squared0.836245810865032
F-TEST (value)19.3841704143083
F-TEST (DF numerator)15
F-TEST (DF denominator)39
p-value1.52988732793347e-13
Multiple Linear Regression - Residual Statistics
Residual Standard Deviation0.0323693408415906
Sum Squared Residuals0.0408631948342435

\begin{tabular}{lllllllll}
\hline
Multiple Linear Regression - Regression Statistics \tabularnewline
Multiple R & 0.939006435347887 \tabularnewline
R-squared & 0.881733085624745 \tabularnewline
Adjusted R-squared & 0.836245810865032 \tabularnewline
F-TEST (value) & 19.3841704143083 \tabularnewline
F-TEST (DF numerator) & 15 \tabularnewline
F-TEST (DF denominator) & 39 \tabularnewline
p-value & 1.52988732793347e-13 \tabularnewline
Multiple Linear Regression - Residual Statistics \tabularnewline
Residual Standard Deviation & 0.0323693408415906 \tabularnewline
Sum Squared Residuals & 0.0408631948342435 \tabularnewline
\hline
\end{tabular}
%Source: https://freestatistics.org/blog/index.php?pk=57885&T=3

[TABLE]
[ROW][C]Multiple Linear Regression - Regression Statistics[/C][/ROW]
[ROW][C]Multiple R[/C][C]0.939006435347887[/C][/ROW]
[ROW][C]R-squared[/C][C]0.881733085624745[/C][/ROW]
[ROW][C]Adjusted R-squared[/C][C]0.836245810865032[/C][/ROW]
[ROW][C]F-TEST (value)[/C][C]19.3841704143083[/C][/ROW]
[ROW][C]F-TEST (DF numerator)[/C][C]15[/C][/ROW]
[ROW][C]F-TEST (DF denominator)[/C][C]39[/C][/ROW]
[ROW][C]p-value[/C][C]1.52988732793347e-13[/C][/ROW]
[ROW][C]Multiple Linear Regression - Residual Statistics[/C][/ROW]
[ROW][C]Residual Standard Deviation[/C][C]0.0323693408415906[/C][/ROW]
[ROW][C]Sum Squared Residuals[/C][C]0.0408631948342435[/C][/ROW]
[/TABLE]
Source: https://freestatistics.org/blog/index.php?pk=57885&T=3

Globally Unique Identifier (entire table): ba.freestatistics.org/blog/index.php?pk=57885&T=3

As an alternative you can also use a QR Code:  

The GUIDs for individual cells are displayed in the table below:

Multiple Linear Regression - Regression Statistics
Multiple R0.939006435347887
R-squared0.881733085624745
Adjusted R-squared0.836245810865032
F-TEST (value)19.3841704143083
F-TEST (DF numerator)15
F-TEST (DF denominator)39
p-value1.52988732793347e-13
Multiple Linear Regression - Residual Statistics
Residual Standard Deviation0.0323693408415906
Sum Squared Residuals0.0408631948342435


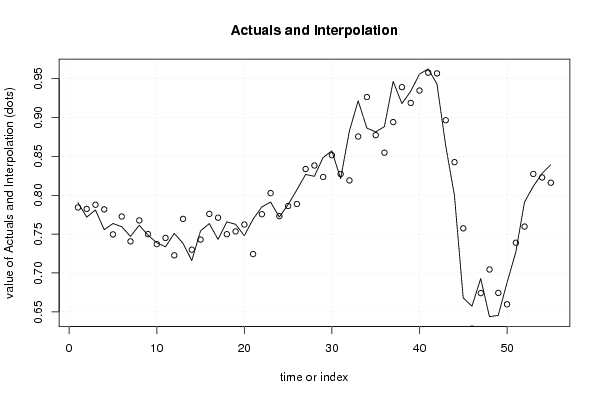
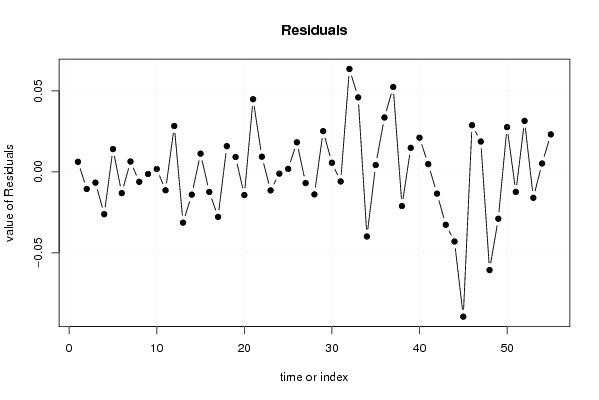
Multiple Linear Regression - Actuals, Interpolation, and Residuals
Time or IndexActualsInterpolationForecastResidualsPrediction Error
10.79050.7843207082558450.00617929174415532
20.77190.782480342992086-0.0105803429920862
30.78110.787794808986126-0.00669480898612576
40.75570.781878746781381-0.0261787467813814
50.76370.7496546277135630.0140453722864371
60.75950.7726641425818-0.0131641425817995
70.74710.7407331224345640.00636687756543637
80.76150.767668064495778-0.00616806449577773
90.74870.750033063902934-0.00133306390293407
100.73890.7371418299471070.00175817005289325
110.73370.745118099446155-0.0114180994461553
120.7510.7227193123721080.0282806876278919
130.73820.769609120770934-0.0314091207709344
140.71590.730007213358747-0.0141072133587470
150.75420.7429821081885490.0112178918114513
160.76360.77603740080296-0.0124374008029603
170.74330.771153007526039-0.0278530075260385
180.76580.749930769502880.0158692304971194
190.76270.7535331091065690.00916689089343125
200.7480.762348986934045-0.0143489869340451
210.76920.724360664379880.0448393356201198
220.7850.775645020763420.00935497923658063
230.79130.802769229263443-0.0114692292634433
240.7720.773126245679026-0.00112624567902559
250.7880.7862166119701530.00178338802984743
260.8070.7887792195351890.0182207804648110
270.82680.83374310406367-0.00694310406367003
280.82440.838344846923742-0.0139448469237421
290.84870.8235731950933750.025126804906625
300.85720.8515823203702410.00561767962975856
310.82140.827346064187525-0.00594606418752503
320.88270.8191456316860530.0635543683139471
330.92160.875630491837720.0459695081622792
340.88650.926430991245144-0.0399309912451441
350.88160.8774136595004140.00418634049958623
360.88840.8548543226043930.0335456773956071
370.94660.8941925547477390.052407445252261
380.9180.939145027172606-0.0211450271726060
390.93370.9188743284084930.0148256715915067
400.95590.934795135691630.0211048643083707
410.96260.9578636177035220.00473638229647842
420.94340.956874148073979-0.0134741480739792
430.86390.896603775757152-0.0327037757571517
440.79960.842637316884124-0.0430373168841243
450.6680.757475779879465-0.089475779879465
460.65720.628382158044330.0288178419556702
470.69280.6740990117899880.0187009882100123
480.64380.704500119344473-0.0607001193444734
490.64540.674361004255329-0.0289610042553293
500.68730.6596881969413720.0276118030586283
510.72650.738905650353162-0.0124056503531622
520.79120.7597438698002870.0314561301997131
530.81140.827455551963502-0.0160555519635019
540.82810.8229486194710990.0051513805289008
550.83930.816183928514190.0231160714858091

\begin{tabular}{lllllllll}
\hline
Multiple Linear Regression - Actuals, Interpolation, and Residuals \tabularnewline
Time or Index & Actuals & InterpolationForecast & ResidualsPrediction Error \tabularnewline
1 & 0.7905 & 0.784320708255845 & 0.00617929174415532 \tabularnewline
2 & 0.7719 & 0.782480342992086 & -0.0105803429920862 \tabularnewline
3 & 0.7811 & 0.787794808986126 & -0.00669480898612576 \tabularnewline
4 & 0.7557 & 0.781878746781381 & -0.0261787467813814 \tabularnewline
5 & 0.7637 & 0.749654627713563 & 0.0140453722864371 \tabularnewline
6 & 0.7595 & 0.7726641425818 & -0.0131641425817995 \tabularnewline
7 & 0.7471 & 0.740733122434564 & 0.00636687756543637 \tabularnewline
8 & 0.7615 & 0.767668064495778 & -0.00616806449577773 \tabularnewline
9 & 0.7487 & 0.750033063902934 & -0.00133306390293407 \tabularnewline
10 & 0.7389 & 0.737141829947107 & 0.00175817005289325 \tabularnewline
11 & 0.7337 & 0.745118099446155 & -0.0114180994461553 \tabularnewline
12 & 0.751 & 0.722719312372108 & 0.0282806876278919 \tabularnewline
13 & 0.7382 & 0.769609120770934 & -0.0314091207709344 \tabularnewline
14 & 0.7159 & 0.730007213358747 & -0.0141072133587470 \tabularnewline
15 & 0.7542 & 0.742982108188549 & 0.0112178918114513 \tabularnewline
16 & 0.7636 & 0.77603740080296 & -0.0124374008029603 \tabularnewline
17 & 0.7433 & 0.771153007526039 & -0.0278530075260385 \tabularnewline
18 & 0.7658 & 0.74993076950288 & 0.0158692304971194 \tabularnewline
19 & 0.7627 & 0.753533109106569 & 0.00916689089343125 \tabularnewline
20 & 0.748 & 0.762348986934045 & -0.0143489869340451 \tabularnewline
21 & 0.7692 & 0.72436066437988 & 0.0448393356201198 \tabularnewline
22 & 0.785 & 0.77564502076342 & 0.00935497923658063 \tabularnewline
23 & 0.7913 & 0.802769229263443 & -0.0114692292634433 \tabularnewline
24 & 0.772 & 0.773126245679026 & -0.00112624567902559 \tabularnewline
25 & 0.788 & 0.786216611970153 & 0.00178338802984743 \tabularnewline
26 & 0.807 & 0.788779219535189 & 0.0182207804648110 \tabularnewline
27 & 0.8268 & 0.83374310406367 & -0.00694310406367003 \tabularnewline
28 & 0.8244 & 0.838344846923742 & -0.0139448469237421 \tabularnewline
29 & 0.8487 & 0.823573195093375 & 0.025126804906625 \tabularnewline
30 & 0.8572 & 0.851582320370241 & 0.00561767962975856 \tabularnewline
31 & 0.8214 & 0.827346064187525 & -0.00594606418752503 \tabularnewline
32 & 0.8827 & 0.819145631686053 & 0.0635543683139471 \tabularnewline
33 & 0.9216 & 0.87563049183772 & 0.0459695081622792 \tabularnewline
34 & 0.8865 & 0.926430991245144 & -0.0399309912451441 \tabularnewline
35 & 0.8816 & 0.877413659500414 & 0.00418634049958623 \tabularnewline
36 & 0.8884 & 0.854854322604393 & 0.0335456773956071 \tabularnewline
37 & 0.9466 & 0.894192554747739 & 0.052407445252261 \tabularnewline
38 & 0.918 & 0.939145027172606 & -0.0211450271726060 \tabularnewline
39 & 0.9337 & 0.918874328408493 & 0.0148256715915067 \tabularnewline
40 & 0.9559 & 0.93479513569163 & 0.0211048643083707 \tabularnewline
41 & 0.9626 & 0.957863617703522 & 0.00473638229647842 \tabularnewline
42 & 0.9434 & 0.956874148073979 & -0.0134741480739792 \tabularnewline
43 & 0.8639 & 0.896603775757152 & -0.0327037757571517 \tabularnewline
44 & 0.7996 & 0.842637316884124 & -0.0430373168841243 \tabularnewline
45 & 0.668 & 0.757475779879465 & -0.089475779879465 \tabularnewline
46 & 0.6572 & 0.62838215804433 & 0.0288178419556702 \tabularnewline
47 & 0.6928 & 0.674099011789988 & 0.0187009882100123 \tabularnewline
48 & 0.6438 & 0.704500119344473 & -0.0607001193444734 \tabularnewline
49 & 0.6454 & 0.674361004255329 & -0.0289610042553293 \tabularnewline
50 & 0.6873 & 0.659688196941372 & 0.0276118030586283 \tabularnewline
51 & 0.7265 & 0.738905650353162 & -0.0124056503531622 \tabularnewline
52 & 0.7912 & 0.759743869800287 & 0.0314561301997131 \tabularnewline
53 & 0.8114 & 0.827455551963502 & -0.0160555519635019 \tabularnewline
54 & 0.8281 & 0.822948619471099 & 0.0051513805289008 \tabularnewline
55 & 0.8393 & 0.81618392851419 & 0.0231160714858091 \tabularnewline
\hline
\end{tabular}
%Source: https://freestatistics.org/blog/index.php?pk=57885&T=4

[TABLE]
[ROW][C]Multiple Linear Regression - Actuals, Interpolation, and Residuals[/C][/ROW]
[ROW][C]Time or Index[/C][C]Actuals[/C][C]InterpolationForecast[/C][C]ResidualsPrediction Error[/C][/ROW]
[ROW][C]1[/C][C]0.7905[/C][C]0.784320708255845[/C][C]0.00617929174415532[/C][/ROW]
[ROW][C]2[/C][C]0.7719[/C][C]0.782480342992086[/C][C]-0.0105803429920862[/C][/ROW]
[ROW][C]3[/C][C]0.7811[/C][C]0.787794808986126[/C][C]-0.00669480898612576[/C][/ROW]
[ROW][C]4[/C][C]0.7557[/C][C]0.781878746781381[/C][C]-0.0261787467813814[/C][/ROW]
[ROW][C]5[/C][C]0.7637[/C][C]0.749654627713563[/C][C]0.0140453722864371[/C][/ROW]
[ROW][C]6[/C][C]0.7595[/C][C]0.7726641425818[/C][C]-0.0131641425817995[/C][/ROW]
[ROW][C]7[/C][C]0.7471[/C][C]0.740733122434564[/C][C]0.00636687756543637[/C][/ROW]
[ROW][C]8[/C][C]0.7615[/C][C]0.767668064495778[/C][C]-0.00616806449577773[/C][/ROW]
[ROW][C]9[/C][C]0.7487[/C][C]0.750033063902934[/C][C]-0.00133306390293407[/C][/ROW]
[ROW][C]10[/C][C]0.7389[/C][C]0.737141829947107[/C][C]0.00175817005289325[/C][/ROW]
[ROW][C]11[/C][C]0.7337[/C][C]0.745118099446155[/C][C]-0.0114180994461553[/C][/ROW]
[ROW][C]12[/C][C]0.751[/C][C]0.722719312372108[/C][C]0.0282806876278919[/C][/ROW]
[ROW][C]13[/C][C]0.7382[/C][C]0.769609120770934[/C][C]-0.0314091207709344[/C][/ROW]
[ROW][C]14[/C][C]0.7159[/C][C]0.730007213358747[/C][C]-0.0141072133587470[/C][/ROW]
[ROW][C]15[/C][C]0.7542[/C][C]0.742982108188549[/C][C]0.0112178918114513[/C][/ROW]
[ROW][C]16[/C][C]0.7636[/C][C]0.77603740080296[/C][C]-0.0124374008029603[/C][/ROW]
[ROW][C]17[/C][C]0.7433[/C][C]0.771153007526039[/C][C]-0.0278530075260385[/C][/ROW]
[ROW][C]18[/C][C]0.7658[/C][C]0.74993076950288[/C][C]0.0158692304971194[/C][/ROW]
[ROW][C]19[/C][C]0.7627[/C][C]0.753533109106569[/C][C]0.00916689089343125[/C][/ROW]
[ROW][C]20[/C][C]0.748[/C][C]0.762348986934045[/C][C]-0.0143489869340451[/C][/ROW]
[ROW][C]21[/C][C]0.7692[/C][C]0.72436066437988[/C][C]0.0448393356201198[/C][/ROW]
[ROW][C]22[/C][C]0.785[/C][C]0.77564502076342[/C][C]0.00935497923658063[/C][/ROW]
[ROW][C]23[/C][C]0.7913[/C][C]0.802769229263443[/C][C]-0.0114692292634433[/C][/ROW]
[ROW][C]24[/C][C]0.772[/C][C]0.773126245679026[/C][C]-0.00112624567902559[/C][/ROW]
[ROW][C]25[/C][C]0.788[/C][C]0.786216611970153[/C][C]0.00178338802984743[/C][/ROW]
[ROW][C]26[/C][C]0.807[/C][C]0.788779219535189[/C][C]0.0182207804648110[/C][/ROW]
[ROW][C]27[/C][C]0.8268[/C][C]0.83374310406367[/C][C]-0.00694310406367003[/C][/ROW]
[ROW][C]28[/C][C]0.8244[/C][C]0.838344846923742[/C][C]-0.0139448469237421[/C][/ROW]
[ROW][C]29[/C][C]0.8487[/C][C]0.823573195093375[/C][C]0.025126804906625[/C][/ROW]
[ROW][C]30[/C][C]0.8572[/C][C]0.851582320370241[/C][C]0.00561767962975856[/C][/ROW]
[ROW][C]31[/C][C]0.8214[/C][C]0.827346064187525[/C][C]-0.00594606418752503[/C][/ROW]
[ROW][C]32[/C][C]0.8827[/C][C]0.819145631686053[/C][C]0.0635543683139471[/C][/ROW]
[ROW][C]33[/C][C]0.9216[/C][C]0.87563049183772[/C][C]0.0459695081622792[/C][/ROW]
[ROW][C]34[/C][C]0.8865[/C][C]0.926430991245144[/C][C]-0.0399309912451441[/C][/ROW]
[ROW][C]35[/C][C]0.8816[/C][C]0.877413659500414[/C][C]0.00418634049958623[/C][/ROW]
[ROW][C]36[/C][C]0.8884[/C][C]0.854854322604393[/C][C]0.0335456773956071[/C][/ROW]
[ROW][C]37[/C][C]0.9466[/C][C]0.894192554747739[/C][C]0.052407445252261[/C][/ROW]
[ROW][C]38[/C][C]0.918[/C][C]0.939145027172606[/C][C]-0.0211450271726060[/C][/ROW]
[ROW][C]39[/C][C]0.9337[/C][C]0.918874328408493[/C][C]0.0148256715915067[/C][/ROW]
[ROW][C]40[/C][C]0.9559[/C][C]0.93479513569163[/C][C]0.0211048643083707[/C][/ROW]
[ROW][C]41[/C][C]0.9626[/C][C]0.957863617703522[/C][C]0.00473638229647842[/C][/ROW]
[ROW][C]42[/C][C]0.9434[/C][C]0.956874148073979[/C][C]-0.0134741480739792[/C][/ROW]
[ROW][C]43[/C][C]0.8639[/C][C]0.896603775757152[/C][C]-0.0327037757571517[/C][/ROW]
[ROW][C]44[/C][C]0.7996[/C][C]0.842637316884124[/C][C]-0.0430373168841243[/C][/ROW]
[ROW][C]45[/C][C]0.668[/C][C]0.757475779879465[/C][C]-0.089475779879465[/C][/ROW]
[ROW][C]46[/C][C]0.6572[/C][C]0.62838215804433[/C][C]0.0288178419556702[/C][/ROW]
[ROW][C]47[/C][C]0.6928[/C][C]0.674099011789988[/C][C]0.0187009882100123[/C][/ROW]
[ROW][C]48[/C][C]0.6438[/C][C]0.704500119344473[/C][C]-0.0607001193444734[/C][/ROW]
[ROW][C]49[/C][C]0.6454[/C][C]0.674361004255329[/C][C]-0.0289610042553293[/C][/ROW]
[ROW][C]50[/C][C]0.6873[/C][C]0.659688196941372[/C][C]0.0276118030586283[/C][/ROW]
[ROW][C]51[/C][C]0.7265[/C][C]0.738905650353162[/C][C]-0.0124056503531622[/C][/ROW]
[ROW][C]52[/C][C]0.7912[/C][C]0.759743869800287[/C][C]0.0314561301997131[/C][/ROW]
[ROW][C]53[/C][C]0.8114[/C][C]0.827455551963502[/C][C]-0.0160555519635019[/C][/ROW]
[ROW][C]54[/C][C]0.8281[/C][C]0.822948619471099[/C][C]0.0051513805289008[/C][/ROW]
[ROW][C]55[/C][C]0.8393[/C][C]0.81618392851419[/C][C]0.0231160714858091[/C][/ROW]
[/TABLE]
Source: https://freestatistics.org/blog/index.php?pk=57885&T=4

Globally Unique Identifier (entire table): ba.freestatistics.org/blog/index.php?pk=57885&T=4

As an alternative you can also use a QR Code:  

The GUIDs for individual cells are displayed in the table below:

Multiple Linear Regression - Actuals, Interpolation, and Residuals
Time or IndexActualsInterpolationForecastResidualsPrediction Error
10.79050.7843207082558450.00617929174415532
20.77190.782480342992086-0.0105803429920862
30.78110.787794808986126-0.00669480898612576
40.75570.781878746781381-0.0261787467813814
50.76370.7496546277135630.0140453722864371
60.75950.7726641425818-0.0131641425817995
70.74710.7407331224345640.00636687756543637
80.76150.767668064495778-0.00616806449577773
90.74870.750033063902934-0.00133306390293407
100.73890.7371418299471070.00175817005289325
110.73370.745118099446155-0.0114180994461553
120.7510.7227193123721080.0282806876278919
130.73820.769609120770934-0.0314091207709344
140.71590.730007213358747-0.0141072133587470
150.75420.7429821081885490.0112178918114513
160.76360.77603740080296-0.0124374008029603
170.74330.771153007526039-0.0278530075260385
180.76580.749930769502880.0158692304971194
190.76270.7535331091065690.00916689089343125
200.7480.762348986934045-0.0143489869340451
210.76920.724360664379880.0448393356201198
220.7850.775645020763420.00935497923658063
230.79130.802769229263443-0.0114692292634433
240.7720.773126245679026-0.00112624567902559
250.7880.7862166119701530.00178338802984743
260.8070.7887792195351890.0182207804648110
270.82680.83374310406367-0.00694310406367003
280.82440.838344846923742-0.0139448469237421
290.84870.8235731950933750.025126804906625
300.85720.8515823203702410.00561767962975856
310.82140.827346064187525-0.00594606418752503
320.88270.8191456316860530.0635543683139471
330.92160.875630491837720.0459695081622792
340.88650.926430991245144-0.0399309912451441
350.88160.8774136595004140.00418634049958623
360.88840.8548543226043930.0335456773956071
370.94660.8941925547477390.052407445252261
380.9180.939145027172606-0.0211450271726060
390.93370.9188743284084930.0148256715915067
400.95590.934795135691630.0211048643083707
410.96260.9578636177035220.00473638229647842
420.94340.956874148073979-0.0134741480739792
430.86390.896603775757152-0.0327037757571517
440.79960.842637316884124-0.0430373168841243
450.6680.757475779879465-0.089475779879465
460.65720.628382158044330.0288178419556702
470.69280.6740990117899880.0187009882100123
480.64380.704500119344473-0.0607001193444734
490.64540.674361004255329-0.0289610042553293
500.68730.6596881969413720.0276118030586283
510.72650.738905650353162-0.0124056503531622
520.79120.7597438698002870.0314561301997131
530.81140.827455551963502-0.0160555519635019
540.82810.8229486194710990.0051513805289008
550.83930.816183928514190.0231160714858091


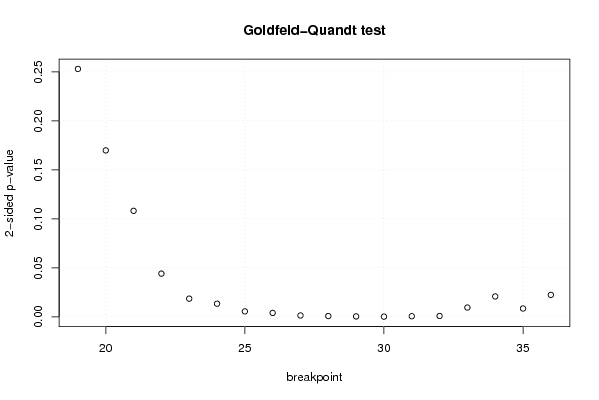
Goldfeld-Quandt test for Heteroskedasticity
p-valuesAlternative Hypothesis
breakpoint indexgreater2-sidedless
190.1265019715396760.2530039430793510.873498028460324
200.08494171892567960.1698834378513590.91505828107432
210.05409091311460540.1081818262292110.945909086885395
220.02204178547458030.04408357094916060.97795821452542
230.00927021409581180.01854042819162360.990729785904188
240.006692119794088750.01338423958817750.993307880205911
250.002758134053315840.005516268106631690.997241865946684
260.001984983623026710.003969967246053420.998015016376973
270.0006881131003430250.001376226200686050.999311886899657
280.0003755557196335070.0007511114392670150.999624444280367
290.0001965070533478390.0003930141066956770.999803492946652
308.023256810656e-050.000160465136213120.999919767431893
310.0002985805715214050.000597161143042810.999701419428479
320.0004323075118430420.0008646150236860850.999567692488157
330.004724230484330670.009448460968661350.99527576951567
340.01039894544425460.02079789088850920.989601054555745
350.004239618571401060.008479237142802120.9957603814286
360.01118359781621740.02236719563243480.988816402183783

\begin{tabular}{lllllllll}
\hline
Goldfeld-Quandt test for Heteroskedasticity \tabularnewline
p-values & Alternative Hypothesis \tabularnewline
breakpoint index & greater & 2-sided & less \tabularnewline
19 & 0.126501971539676 & 0.253003943079351 & 0.873498028460324 \tabularnewline
20 & 0.0849417189256796 & 0.169883437851359 & 0.91505828107432 \tabularnewline
21 & 0.0540909131146054 & 0.108181826229211 & 0.945909086885395 \tabularnewline
22 & 0.0220417854745803 & 0.0440835709491606 & 0.97795821452542 \tabularnewline
23 & 0.0092702140958118 & 0.0185404281916236 & 0.990729785904188 \tabularnewline
24 & 0.00669211979408875 & 0.0133842395881775 & 0.993307880205911 \tabularnewline
25 & 0.00275813405331584 & 0.00551626810663169 & 0.997241865946684 \tabularnewline
26 & 0.00198498362302671 & 0.00396996724605342 & 0.998015016376973 \tabularnewline
27 & 0.000688113100343025 & 0.00137622620068605 & 0.999311886899657 \tabularnewline
28 & 0.000375555719633507 & 0.000751111439267015 & 0.999624444280367 \tabularnewline
29 & 0.000196507053347839 & 0.000393014106695677 & 0.999803492946652 \tabularnewline
30 & 8.023256810656e-05 & 0.00016046513621312 & 0.999919767431893 \tabularnewline
31 & 0.000298580571521405 & 0.00059716114304281 & 0.999701419428479 \tabularnewline
32 & 0.000432307511843042 & 0.000864615023686085 & 0.999567692488157 \tabularnewline
33 & 0.00472423048433067 & 0.00944846096866135 & 0.99527576951567 \tabularnewline
34 & 0.0103989454442546 & 0.0207978908885092 & 0.989601054555745 \tabularnewline
35 & 0.00423961857140106 & 0.00847923714280212 & 0.9957603814286 \tabularnewline
36 & 0.0111835978162174 & 0.0223671956324348 & 0.988816402183783 \tabularnewline
\hline
\end{tabular}
%Source: https://freestatistics.org/blog/index.php?pk=57885&T=5

[TABLE]
[ROW][C]Goldfeld-Quandt test for Heteroskedasticity[/C][/ROW]
[ROW][C]p-values[/C][C]Alternative Hypothesis[/C][/ROW]
[ROW][C]breakpoint index[/C][C]greater[/C][C]2-sided[/C][C]less[/C][/ROW]
[ROW][C]19[/C][C]0.126501971539676[/C][C]0.253003943079351[/C][C]0.873498028460324[/C][/ROW]
[ROW][C]20[/C][C]0.0849417189256796[/C][C]0.169883437851359[/C][C]0.91505828107432[/C][/ROW]
[ROW][C]21[/C][C]0.0540909131146054[/C][C]0.108181826229211[/C][C]0.945909086885395[/C][/ROW]
[ROW][C]22[/C][C]0.0220417854745803[/C][C]0.0440835709491606[/C][C]0.97795821452542[/C][/ROW]
[ROW][C]23[/C][C]0.0092702140958118[/C][C]0.0185404281916236[/C][C]0.990729785904188[/C][/ROW]
[ROW][C]24[/C][C]0.00669211979408875[/C][C]0.0133842395881775[/C][C]0.993307880205911[/C][/ROW]
[ROW][C]25[/C][C]0.00275813405331584[/C][C]0.00551626810663169[/C][C]0.997241865946684[/C][/ROW]
[ROW][C]26[/C][C]0.00198498362302671[/C][C]0.00396996724605342[/C][C]0.998015016376973[/C][/ROW]
[ROW][C]27[/C][C]0.000688113100343025[/C][C]0.00137622620068605[/C][C]0.999311886899657[/C][/ROW]
[ROW][C]28[/C][C]0.000375555719633507[/C][C]0.000751111439267015[/C][C]0.999624444280367[/C][/ROW]
[ROW][C]29[/C][C]0.000196507053347839[/C][C]0.000393014106695677[/C][C]0.999803492946652[/C][/ROW]
[ROW][C]30[/C][C]8.023256810656e-05[/C][C]0.00016046513621312[/C][C]0.999919767431893[/C][/ROW]
[ROW][C]31[/C][C]0.000298580571521405[/C][C]0.00059716114304281[/C][C]0.999701419428479[/C][/ROW]
[ROW][C]32[/C][C]0.000432307511843042[/C][C]0.000864615023686085[/C][C]0.999567692488157[/C][/ROW]
[ROW][C]33[/C][C]0.00472423048433067[/C][C]0.00944846096866135[/C][C]0.99527576951567[/C][/ROW]
[ROW][C]34[/C][C]0.0103989454442546[/C][C]0.0207978908885092[/C][C]0.989601054555745[/C][/ROW]
[ROW][C]35[/C][C]0.00423961857140106[/C][C]0.00847923714280212[/C][C]0.9957603814286[/C][/ROW]
[ROW][C]36[/C][C]0.0111835978162174[/C][C]0.0223671956324348[/C][C]0.988816402183783[/C][/ROW]
[/TABLE]
Source: https://freestatistics.org/blog/index.php?pk=57885&T=5

Globally Unique Identifier (entire table): ba.freestatistics.org/blog/index.php?pk=57885&T=5

As an alternative you can also use a QR Code:  

The GUIDs for individual cells are displayed in the table below:

Goldfeld-Quandt test for Heteroskedasticity
p-valuesAlternative Hypothesis
breakpoint indexgreater2-sidedless
190.1265019715396760.2530039430793510.873498028460324
200.08494171892567960.1698834378513590.91505828107432
210.05409091311460540.1081818262292110.945909086885395
220.02204178547458030.04408357094916060.97795821452542
230.00927021409581180.01854042819162360.990729785904188
240.006692119794088750.01338423958817750.993307880205911
250.002758134053315840.005516268106631690.997241865946684
260.001984983623026710.003969967246053420.998015016376973
270.0006881131003430250.001376226200686050.999311886899657
280.0003755557196335070.0007511114392670150.999624444280367
290.0001965070533478390.0003930141066956770.999803492946652
308.023256810656e-050.000160465136213120.999919767431893
310.0002985805715214050.000597161143042810.999701419428479
320.0004323075118430420.0008646150236860850.999567692488157
330.004724230484330670.009448460968661350.99527576951567
340.01039894544425460.02079789088850920.989601054555745
350.004239618571401060.008479237142802120.9957603814286
360.01118359781621740.02236719563243480.988816402183783


Meta Analysis of Goldfeld-Quandt test for Heteroskedasticity
Description# significant tests% significant testsOK/NOK
1% type I error level100.555555555555556NOK
5% type I error level150.833333333333333NOK
10% type I error level150.833333333333333NOK

\begin{tabular}{lllllllll}
\hline
Meta Analysis of Goldfeld-Quandt test for Heteroskedasticity \tabularnewline
Description & # significant tests & % significant tests & OK/NOK \tabularnewline
1% type I error level & 10 & 0.555555555555556 & NOK \tabularnewline
5% type I error level & 15 & 0.833333333333333 & NOK \tabularnewline
10% type I error level & 15 & 0.833333333333333 & NOK \tabularnewline
\hline
\end{tabular}
%Source: https://freestatistics.org/blog/index.php?pk=57885&T=6

[TABLE]
[ROW][C]Meta Analysis of Goldfeld-Quandt test for Heteroskedasticity[/C][/ROW]
[ROW][C]Description[/C][C]# significant tests[/C][C]% significant tests[/C][C]OK/NOK[/C][/ROW]
[ROW][C]1% type I error level[/C][C]10[/C][C]0.555555555555556[/C][C]NOK[/C][/ROW]
[ROW][C]5% type I error level[/C][C]15[/C][C]0.833333333333333[/C][C]NOK[/C][/ROW]
[ROW][C]10% type I error level[/C][C]15[/C][C]0.833333333333333[/C][C]NOK[/C][/ROW]
[/TABLE]
Source: https://freestatistics.org/blog/index.php?pk=57885&T=6

Globally Unique Identifier (entire table): ba.freestatistics.org/blog/index.php?pk=57885&T=6

As an alternative you can also use a QR Code:  

The GUIDs for individual cells are displayed in the table below:

Meta Analysis of Goldfeld-Quandt test for Heteroskedasticity
Description# significant tests% significant testsOK/NOK
1% type I error level100.555555555555556NOK
5% type I error level150.833333333333333NOK
10% type I error level150.833333333333333NOK


Parameters (Session):
par1 = 1 ; par2 = Include Monthly Dummies ; par3 = Linear Trend ;
Parameters (R input):
par1 = 1 ; par2 = Include Monthly Dummies ; par3 = Linear Trend ;
R code (references can be found in the software module):
library(lattice)
library(lmtest)
n25 <- 25 #minimum number of obs. for Goldfeld-Quandt test
par1 <- as.numeric(par1)
x <- t(y)
k <- length(x[1,])
n <- length(x[,1])
x1 <- cbind(x[,par1], x[,1:k!=par1])
mycolnames <- c(colnames(x)[par1], colnames(x)[1:k!=par1])
colnames(x1) <- mycolnames #colnames(x)[par1]
x <- x1
if (par3 == 'First Differences'){
x2 <- array(0, dim=c(n-1,k), dimnames=list(1:(n-1), paste('(1-B)',colnames(x),sep='')))
for (i in 1:n-1) {
for (j in 1:k) {
x2[i,j] <- x[i+1,j] - x[i,j]
}
}
x <- x2
}
if (par2 == 'Include Monthly Dummies'){
x2 <- array(0, dim=c(n,11), dimnames=list(1:n, paste('M', seq(1:11), sep ='')))
for (i in 1:11){
x2[seq(i,n,12),i] <- 1
}
x <- cbind(x, x2)
}
if (par2 == 'Include Quarterly Dummies'){
x2 <- array(0, dim=c(n,3), dimnames=list(1:n, paste('Q', seq(1:3), sep ='')))
for (i in 1:3){
x2[seq(i,n,4),i] <- 1
}
x <- cbind(x, x2)
}
k <- length(x[1,])
if (par3 == 'Linear Trend'){
x <- cbind(x, c(1:n))
colnames(x)[k+1] <- 't'
}
x
k <- length(x[1,])
df <- as.data.frame(x)
(mylm <- lm(df))
(mysum <- summary(mylm))
if (n > n25) {
kp3 <- k + 3
nmkm3 <- n - k - 3
gqarr <- array(NA, dim=c(nmkm3-kp3+1,3))
numgqtests <- 0
numsignificant1 <- 0
numsignificant5 <- 0
numsignificant10 <- 0
for (mypoint in kp3:nmkm3) {
j <- 0
numgqtests <- numgqtests + 1
for (myalt in c('greater', 'two.sided', 'less')) {
j <- j + 1
gqarr[mypoint-kp3+1,j] <- gqtest(mylm, point=mypoint, alternative=myalt)$p.value
}
if (gqarr[mypoint-kp3+1,2] < 0.01) numsignificant1 <- numsignificant1 + 1
if (gqarr[mypoint-kp3+1,2] < 0.05) numsignificant5 <- numsignificant5 + 1
if (gqarr[mypoint-kp3+1,2] < 0.10) numsignificant10 <- numsignificant10 + 1
}
gqarr
}
bitmap(file='test0.png')
plot(x[,1], type='l', main='Actuals and Interpolation', ylab='value of Actuals and Interpolation (dots)', xlab='time or index')
points(x[,1]-mysum$resid)
grid()
dev.off()
bitmap(file='test1.png')
plot(mysum$resid, type='b', pch=19, main='Residuals', ylab='value of Residuals', xlab='time or index')
grid()
dev.off()
bitmap(file='test2.png')
hist(mysum$resid, main='Residual Histogram', xlab='values of Residuals')
grid()
dev.off()
bitmap(file='test3.png')
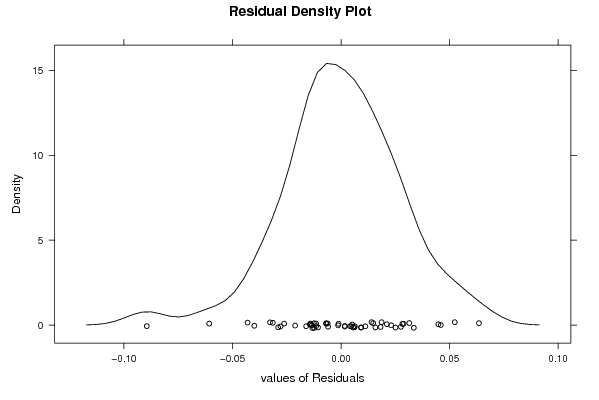
densityplot(~mysum$resid,col='black',main='Residual Density Plot', xlab='values of Residuals')
dev.off()
bitmap(file='test4.png')
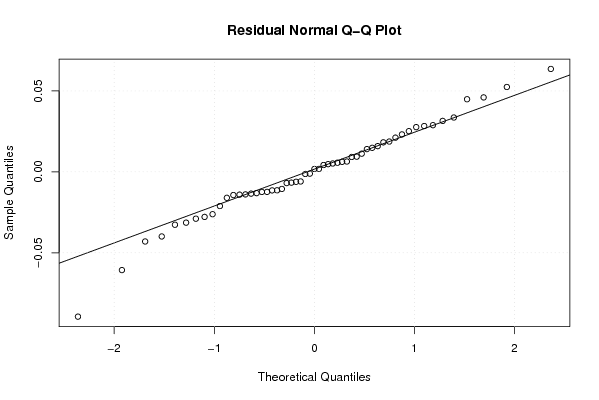
qqnorm(mysum$resid, main='Residual Normal Q-Q Plot')
qqline(mysum$resid)
grid()
dev.off()
(myerror <- as.ts(mysum$resid))
bitmap(file='test5.png')
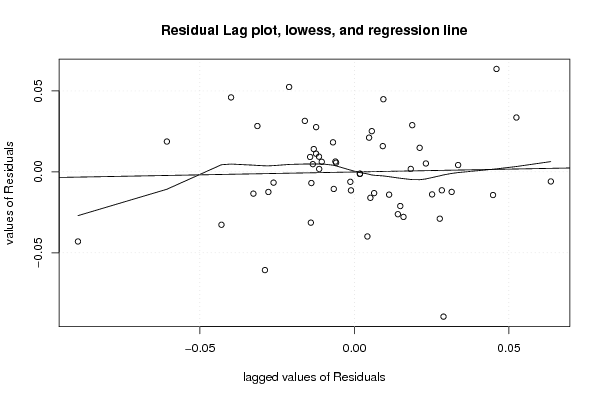
dum <- cbind(lag(myerror,k=1),myerror)
dum
dum1 <- dum[2:length(myerror),]
dum1
z <- as.data.frame(dum1)
z
plot(z,main=paste('Residual Lag plot, lowess, and regression line'), ylab='values of Residuals', xlab='lagged values of Residuals')
lines(lowess(z))
abline(lm(z))
grid()
dev.off()
bitmap(file='test6.png')
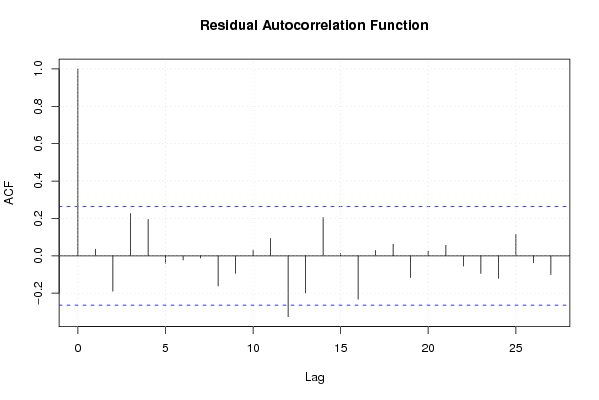
acf(mysum$resid, lag.max=length(mysum$resid)/2, main='Residual Autocorrelation Function')
grid()
dev.off()
bitmap(file='test7.png')
pacf(mysum$resid, lag.max=length(mysum$resid)/2, main='Residual Partial Autocorrelation Function')
grid()
dev.off()
bitmap(file='test8.png')
opar <- par(mfrow = c(2,2), oma = c(0, 0, 1.1, 0))
plot(mylm, las = 1, sub='Residual Diagnostics')
par(opar)
dev.off()
if (n > n25) {
bitmap(file='test9.png')
plot(kp3:nmkm3,gqarr[,2], main='Goldfeld-Quandt test',ylab='2-sided p-value',xlab='breakpoint')
grid()
dev.off()
}
load(file='createtable')
a<-table.start()
a<-table.row.start(a)
a<-table.element(a, 'Multiple Linear Regression - Estimated Regression Equation', 1, TRUE)
a<-table.row.end(a)
myeq <- colnames(x)[1]
myeq <- paste(myeq, '[t] = ', sep='')
for (i in 1:k){
if (mysum$coefficients[i,1] > 0) myeq <- paste(myeq, '+', '')
myeq <- paste(myeq, mysum$coefficients[i,1], sep=' ')
if (rownames(mysum$coefficients)[i] != '(Intercept)') {
myeq <- paste(myeq, rownames(mysum$coefficients)[i], sep='')
if (rownames(mysum$coefficients)[i] != 't') myeq <- paste(myeq, '[t]', sep='')
}
}
myeq <- paste(myeq, ' + e[t]')
a<-table.row.start(a)
a<-table.element(a, myeq)
a<-table.row.end(a)
a<-table.end(a)
table.save(a,file='mytable1.tab')
a<-table.start()
a<-table.row.start(a)
a<-table.element(a,hyperlink('ols1.htm','Multiple Linear Regression - Ordinary Least Squares',''), 6, TRUE)
a<-table.row.end(a)
a<-table.row.start(a)
a<-table.element(a,'Variable',header=TRUE)
a<-table.element(a,'Parameter',header=TRUE)
a<-table.element(a,'S.D.',header=TRUE)
a<-table.element(a,'T-STAT
H0: parameter = 0',header=TRUE)
a<-table.element(a,'2-tail p-value',header=TRUE)
a<-table.element(a,'1-tail p-value',header=TRUE)
a<-table.row.end(a)
for (i in 1:k){
a<-table.row.start(a)
a<-table.element(a,rownames(mysum$coefficients)[i],header=TRUE)
a<-table.element(a,mysum$coefficients[i,1])
a<-table.element(a, round(mysum$coefficients[i,2],6))
a<-table.element(a, round(mysum$coefficients[i,3],4))
a<-table.element(a, round(mysum$coefficients[i,4],6))
a<-table.element(a, round(mysum$coefficients[i,4]/2,6))
a<-table.row.end(a)
}
a<-table.end(a)
table.save(a,file='mytable2.tab')
a<-table.start()
a<-table.row.start(a)
a<-table.element(a, 'Multiple Linear Regression - Regression Statistics', 2, TRUE)
a<-table.row.end(a)
a<-table.row.start(a)
a<-table.element(a, 'Multiple R',1,TRUE)
a<-table.element(a, sqrt(mysum$r.squared))
a<-table.row.end(a)
a<-table.row.start(a)
a<-table.element(a, 'R-squared',1,TRUE)
a<-table.element(a, mysum$r.squared)
a<-table.row.end(a)
a<-table.row.start(a)
a<-table.element(a, 'Adjusted R-squared',1,TRUE)
a<-table.element(a, mysum$adj.r.squared)
a<-table.row.end(a)
a<-table.row.start(a)
a<-table.element(a, 'F-TEST (value)',1,TRUE)
a<-table.element(a, mysum$fstatistic[1])
a<-table.row.end(a)
a<-table.row.start(a)
a<-table.element(a, 'F-TEST (DF numerator)',1,TRUE)
a<-table.element(a, mysum$fstatistic[2])
a<-table.row.end(a)
a<-table.row.start(a)
a<-table.element(a, 'F-TEST (DF denominator)',1,TRUE)
a<-table.element(a, mysum$fstatistic[3])
a<-table.row.end(a)
a<-table.row.start(a)
a<-table.element(a, 'p-value',1,TRUE)
a<-table.element(a, 1-pf(mysum$fstatistic[1],mysum$fstatistic[2],mysum$fstatistic[3]))
a<-table.row.end(a)
a<-table.row.start(a)
a<-table.element(a, 'Multiple Linear Regression - Residual Statistics', 2, TRUE)
a<-table.row.end(a)
a<-table.row.start(a)
a<-table.element(a, 'Residual Standard Deviation',1,TRUE)
a<-table.element(a, mysum$sigma)
a<-table.row.end(a)
a<-table.row.start(a)
a<-table.element(a, 'Sum Squared Residuals',1,TRUE)
a<-table.element(a, sum(myerror*myerror))
a<-table.row.end(a)
a<-table.end(a)
table.save(a,file='mytable3.tab')
a<-table.start()
a<-table.row.start(a)
a<-table.element(a, 'Multiple Linear Regression - Actuals, Interpolation, and Residuals', 4, TRUE)
a<-table.row.end(a)
a<-table.row.start(a)
a<-table.element(a, 'Time or Index', 1, TRUE)
a<-table.element(a, 'Actuals', 1, TRUE)
a<-table.element(a, 'Interpolation
Forecast', 1, TRUE)
a<-table.element(a, 'Residuals
Prediction Error', 1, TRUE)
a<-table.row.end(a)
for (i in 1:n) {
a<-table.row.start(a)
a<-table.element(a,i, 1, TRUE)
a<-table.element(a,x[i])
a<-table.element(a,x[i]-mysum$resid[i])
a<-table.element(a,mysum$resid[i])
a<-table.row.end(a)
}
a<-table.end(a)
table.save(a,file='mytable4.tab')
if (n > n25) {
a<-table.start()
a<-table.row.start(a)
a<-table.element(a,'Goldfeld-Quandt test for Heteroskedasticity',4,TRUE)
a<-table.row.end(a)
a<-table.row.start(a)
a<-table.element(a,'p-values',header=TRUE)
a<-table.element(a,'Alternative Hypothesis',3,header=TRUE)
a<-table.row.end(a)
a<-table.row.start(a)
a<-table.element(a,'breakpoint index',header=TRUE)
a<-table.element(a,'greater',header=TRUE)
a<-table.element(a,'2-sided',header=TRUE)
a<-table.element(a,'less',header=TRUE)
a<-table.row.end(a)
for (mypoint in kp3:nmkm3) {
a<-table.row.start(a)
a<-table.element(a,mypoint,header=TRUE)
a<-table.element(a,gqarr[mypoint-kp3+1,1])
a<-table.element(a,gqarr[mypoint-kp3+1,2])
a<-table.element(a,gqarr[mypoint-kp3+1,3])
a<-table.row.end(a)
}
a<-table.end(a)
table.save(a,file='mytable5.tab')
a<-table.start()
a<-table.row.start(a)
a<-table.element(a,'Meta Analysis of Goldfeld-Quandt test for Heteroskedasticity',4,TRUE)
a<-table.row.end(a)
a<-table.row.start(a)
a<-table.element(a,'Description',header=TRUE)
a<-table.element(a,'# significant tests',header=TRUE)
a<-table.element(a,'% significant tests',header=TRUE)
a<-table.element(a,'OK/NOK',header=TRUE)
a<-table.row.end(a)
a<-table.row.start(a)
a<-table.element(a,'1% type I error level',header=TRUE)
a<-table.element(a,numsignificant1)
a<-table.element(a,numsignificant1/numgqtests)
if (numsignificant1/numgqtests < 0.01) dum <- 'OK' else dum <- 'NOK'
a<-table.element(a,dum)
a<-table.row.end(a)
a<-table.row.start(a)
a<-table.element(a,'5% type I error level',header=TRUE)
a<-table.element(a,numsignificant5)
a<-table.element(a,numsignificant5/numgqtests)
if (numsignificant5/numgqtests < 0.05) dum <- 'OK' else dum <- 'NOK'
a<-table.element(a,dum)
a<-table.row.end(a)
a<-table.row.start(a)
a<-table.element(a,'10% type I error level',header=TRUE)
a<-table.element(a,numsignificant10)
a<-table.element(a,numsignificant10/numgqtests)
if (numsignificant10/numgqtests < 0.1) dum <- 'OK' else dum <- 'NOK'
a<-table.element(a,dum)
a<-table.row.end(a)
a<-table.end(a)
table.save(a,file='mytable6.tab')
}