| Multiple Linear Regression - Estimated Regression Equation |
| Y(t)[t] = + 0.998292328693155 + 0.0376630226888407`X(t)`[t] + 1.46957457460690`Y(t-1)`[t] -0.801806872557724`Y(t-2)`[t] -0.115732461513392`Y(t-3)`[t] + 0.329690799318938`Y(t-4) `[t] -0.144354348061105M1[t] -0.120706258608075M2[t] + 0.608263839578986M3[t] -0.390327570481754M4[t] + 0.0102407157144446M5[t] + 0.117272582800866M6[t] + 0.0204583804677823M7[t] + 0.172191674221844M8[t] + 0.0134046809351707M9[t] -0.0958526420642873M10[t] -0.0193853350638593M11[t] -0.00677880468999083t + e[t] |
| Multiple Linear Regression - Ordinary Least Squares | |||||
| Variable | Parameter | S.D. | T-STAT H0: parameter = 0 | 2-tail p-value | 1-tail p-value |
| (Intercept) | 0.998292328693155 | 0.668951 | 1.4923 | 0.143871 | 0.071935 |
| `X(t)` | 0.0376630226888407 | 0.024701 | 1.5248 | 0.135598 | 0.067799 |
| `Y(t-1)` | 1.46957457460690 | 0.137941 | 10.6537 | 0 | 0 |
| `Y(t-2)` | -0.801806872557724 | 0.263589 | -3.0419 | 0.004247 | 0.002123 |
| `Y(t-3)` | -0.115732461513392 | 0.263607 | -0.439 | 0.663123 | 0.331562 |
| `Y(t-4) ` | 0.329690799318938 | 0.143787 | 2.2929 | 0.027478 | 0.013739 |
| M1 | -0.144354348061105 | 0.103653 | -1.3927 | 0.171813 | 0.085907 |
| M2 | -0.120706258608075 | 0.107018 | -1.1279 | 0.266432 | 0.133216 |
| M3 | 0.608263839578986 | 0.108544 | 5.6039 | 2e-06 | 1e-06 |
| M4 | -0.390327570481754 | 0.141671 | -2.7552 | 0.008956 | 0.004478 |
| M5 | 0.0102407157144446 | 0.155634 | 0.0658 | 0.947882 | 0.473941 |
| M6 | 0.117272582800866 | 0.124325 | 0.9433 | 0.351498 | 0.175749 |
| M7 | 0.0204583804677823 | 0.10111 | 0.2023 | 0.840732 | 0.420366 |
| M8 | 0.172191674221844 | 0.103872 | 1.6577 | 0.105608 | 0.052804 |
| M9 | 0.0134046809351707 | 0.112782 | 0.1189 | 0.906016 | 0.453008 |
| M10 | -0.0958526420642873 | 0.11389 | -0.8416 | 0.405264 | 0.202632 |
| M11 | -0.0193853350638593 | 0.107819 | -0.1798 | 0.858268 | 0.429134 |
| t | -0.00677880468999083 | 0.002425 | -2.7957 | 0.008077 | 0.004038 |
| Multiple Linear Regression - Regression Statistics | |
| Multiple R | 0.985993431228861 |
| R-squared | 0.972183046426463 |
| Adjusted R-squared | 0.959738619827776 |
| F-TEST (value) | 78.121963974539 |
| F-TEST (DF numerator) | 17 |
| F-TEST (DF denominator) | 38 |
| p-value | 0 |
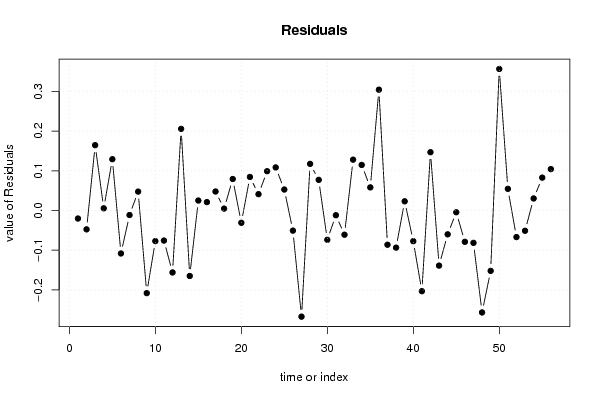
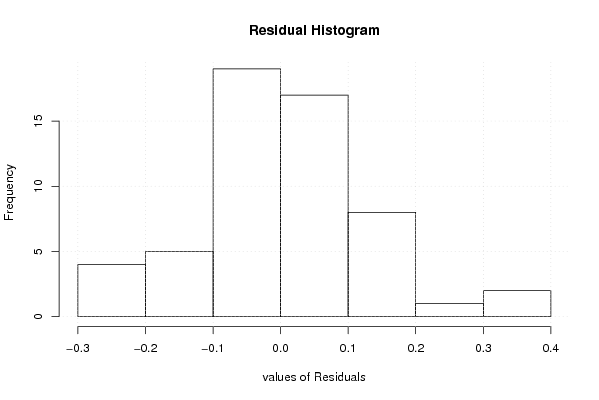
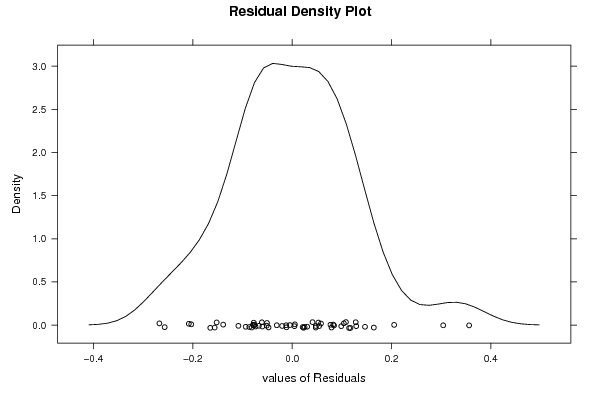
| Multiple Linear Regression - Residual Statistics | |
| Residual Standard Deviation | 0.149249431800875 |
| Sum Squared Residuals | 0.846464929929589 |
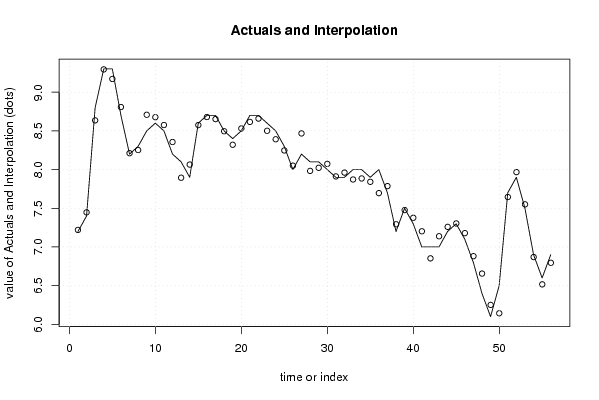
| Multiple Linear Regression - Actuals, Interpolation, and Residuals | |||
| Time or Index | Actuals | Interpolation Forecast | Residuals Prediction Error |
| 1 | 7.2 | 7.22016515033857 | -0.0201651503385712 |
| 2 | 7.4 | 7.447439502515 | -0.0474395025150006 |
| 3 | 8.8 | 8.6355946445209 | 0.164405355479107 |
| 4 | 9.3 | 9.29446825643826 | 0.00553174356174162 |
| 5 | 9.3 | 9.17092906703097 | 0.129070932969028 |
| 6 | 8.7 | 8.80808812731354 | -0.108088127313538 |
| 7 | 8.2 | 8.2113860547406 | -0.0113860547406046 |
| 8 | 8.3 | 8.2524175706198 | 0.0475824293802062 |
| 9 | 8.5 | 8.7079184455596 | -0.207918445559603 |
| 10 | 8.6 | 8.67696720350775 | -0.0769672035077447 |
| 11 | 8.5 | 8.57566465430094 | -0.0756646543009385 |
| 12 | 8.2 | 8.35589041851203 | -0.155890418512026 |
| 13 | 8.1 | 7.8946641920782 | 0.205335807921803 |
| 14 | 7.9 | 8.06472561630663 | -0.164725616306633 |
| 15 | 8.6 | 8.57493334066022 | 0.0250666593397786 |
| 16 | 8.7 | 8.67882531353929 | 0.0211746864607128 |
| 17 | 8.7 | 8.65225115635545 | 0.0477488436445533 |
| 18 | 8.5 | 8.49524223042187 | 0.0047577695781299 |
| 19 | 8.4 | 8.32071092411822 | 0.079289075881782 |
| 20 | 8.5 | 8.53086992150946 | -0.0308699215094584 |
| 21 | 8.7 | 8.61558876055193 | 0.0844112394480652 |
| 22 | 8.7 | 8.65892194681564 | 0.0410780531843564 |
| 23 | 8.6 | 8.501108934918 | 0.098891065082001 |
| 24 | 8.5 | 8.39164580453593 | 0.108354195464070 |
| 25 | 8.3 | 8.24720664598147 | 0.0527933540185279 |
| 26 | 8 | 8.0506160424236 | -0.0506160424235927 |
| 27 | 8.2 | 8.4671342020007 | -0.267134202000699 |
| 28 | 8.1 | 7.98263207404056 | 0.117367925959436 |
| 29 | 8.1 | 8.02281909308923 | 0.0771809069107674 |
| 30 | 8 | 8.0736665061053 | -0.0736665061053069 |
| 31 | 7.9 | 7.91192635444332 | -0.0119263544433215 |
| 32 | 7.9 | 7.96090129563947 | -0.0609012956394656 |
| 33 | 8 | 7.87202422199438 | 0.127975778005623 |
| 34 | 8 | 7.88531602025395 | 0.114683979746053 |
| 35 | 7.9 | 7.84185475537672 | 0.0581452446232822 |
| 36 | 8 | 7.69593058213856 | 0.304069417861442 |
| 37 | 7.7 | 7.7860731426914 | -0.0860731426913972 |
| 38 | 7.2 | 7.29346261396794 | -0.0934626139679346 |
| 39 | 7.5 | 7.47686635584564 | 0.0231336441543587 |
| 40 | 7.3 | 7.37719446587287 | -0.0771944658728678 |
| 41 | 7 | 7.20301856618916 | -0.203018566189162 |
| 42 | 7 | 6.85332591075266 | 0.146674089247345 |
| 43 | 7 | 7.13869281347745 | -0.138692813477446 |
| 44 | 7.2 | 7.25996148566951 | -0.0599614856695144 |
| 45 | 7.3 | 7.30446857189408 | -0.00446857189408546 |
| 46 | 7.1 | 7.17879482942266 | -0.078794829422665 |
| 47 | 6.8 | 6.88137165540434 | -0.0813716554043448 |
| 48 | 6.4 | 6.65653319481349 | -0.256533194813486 |
| 49 | 6.1 | 6.25189086891036 | -0.151890868910363 |
| 50 | 6.5 | 6.14375622478684 | 0.356243775213161 |
| 51 | 7.7 | 7.64547145697255 | 0.0545285430274547 |
| 52 | 7.9 | 7.96687989010902 | -0.0668798901090223 |
| 53 | 7.5 | 7.55098211733519 | -0.0509821173351869 |
| 54 | 6.9 | 6.86967722540663 | 0.0303227745933704 |
| 55 | 6.6 | 6.51728385322041 | 0.0827161467795902 |
| 56 | 6.9 | 6.79584972656177 | 0.104150273438232 |
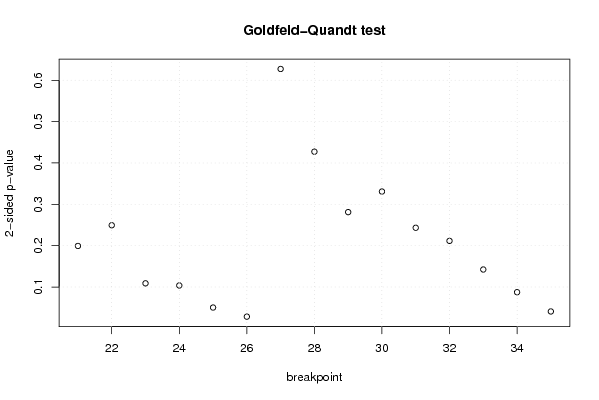
| Goldfeld-Quandt test for Heteroskedasticity | |||
| p-values | Alternative Hypothesis | ||
| breakpoint index | greater | 2-sided | less |
| 21 | 0.0996428273849502 | 0.199285654769900 | 0.90035717261505 |
| 22 | 0.124685722626046 | 0.249371445252092 | 0.875314277373954 |
| 23 | 0.0544787771443442 | 0.108957554288688 | 0.945521222855656 |
| 24 | 0.0518654621740017 | 0.103730924348003 | 0.948134537825998 |
| 25 | 0.025174492223657 | 0.050348984447314 | 0.974825507776343 |
| 26 | 0.0141609427848188 | 0.0283218855696376 | 0.985839057215181 |
| 27 | 0.313685097781473 | 0.627370195562946 | 0.686314902218527 |
| 28 | 0.213639456559031 | 0.427278913118063 | 0.786360543440969 |
| 29 | 0.14054950096741 | 0.28109900193482 | 0.85945049903259 |
| 30 | 0.165451450806419 | 0.330902901612838 | 0.834548549193581 |
| 31 | 0.121622593230636 | 0.243245186461273 | 0.878377406769363 |
| 32 | 0.105766462983213 | 0.211532925966425 | 0.894233537016787 |
| 33 | 0.0711773523594984 | 0.142354704718997 | 0.928822647640502 |
| 34 | 0.0437357082036325 | 0.087471416407265 | 0.956264291796368 |
| 35 | 0.0204409323100288 | 0.0408818646200576 | 0.97955906768997 |
| Meta Analysis of Goldfeld-Quandt test for Heteroskedasticity | |||
| Description | # significant tests | % significant tests | OK/NOK |
| 1% type I error level | 0 | 0 | OK |
| 5% type I error level | 2 | 0.133333333333333 | NOK |
| 10% type I error level | 4 | 0.266666666666667 | NOK |