| Multiple Linear Regression - Estimated Regression Equation |
| Y[t] = + 2433.44637791450 -315.074157998355X[t] -0.00125846806695553Y1[t] + 0.177146531235082Y2[t] + 250.885789760826M1[t] + 140.710806349446M2[t] + 315.354276985791M3[t] + 212.856988453909M4[t] + 147.800396561370M5[t] + 450.964210878744M6[t] + 22.4825935448227M7[t] -94.9584839475962M8[t] + 0.239158080932078M9[t] + 206.346376078827M10[t] -162.905871133591M11[t] + 10.3153346404841t + e[t] |
| Multiple Linear Regression - Ordinary Least Squares | |||||
| Variable | Parameter | S.D. | T-STAT H0: parameter = 0 | 2-tail p-value | 1-tail p-value |
| (Intercept) | 2433.44637791450 | 751.624049 | 3.2376 | 0.002266 | 0.001133 |
| X | -315.074157998355 | 148.716908 | -2.1186 | 0.039677 | 0.019839 |
| Y1 | -0.00125846806695553 | 0.162594 | -0.0077 | 0.993859 | 0.496929 |
| Y2 | 0.177146531235082 | 0.163519 | 1.0833 | 0.284428 | 0.142214 |
| M1 | 250.885789760826 | 167.364603 | 1.499 | 0.140847 | 0.070424 |
| M2 | 140.710806349446 | 177.56239 | 0.7925 | 0.432252 | 0.216126 |
| M3 | 315.354276985791 | 167.428143 | 1.8835 | 0.066102 | 0.033051 |
| M4 | 212.856988453909 | 181.417717 | 1.1733 | 0.24685 | 0.123425 |
| M5 | 147.800396561370 | 174.40691 | 0.8474 | 0.401232 | 0.200616 |
| M6 | 450.964210878744 | 168.335187 | 2.679 | 0.010277 | 0.005138 |
| M7 | 22.4825935448227 | 191.025309 | 0.1177 | 0.906834 | 0.453417 |
| M8 | -94.9584839475962 | 168.855391 | -0.5624 | 0.576658 | 0.288329 |
| M9 | 0.239158080932078 | 161.031948 | 0.0015 | 0.998822 | 0.499411 |
| M10 | 206.346376078827 | 163.50571 | 1.262 | 0.213446 | 0.106723 |
| M11 | -162.905871133591 | 170.220741 | -0.957 | 0.343667 | 0.171834 |
| t | 10.3153346404841 | 6.705311 | 1.5384 | 0.130958 | 0.065479 |
| Multiple Linear Regression - Regression Statistics | |
| Multiple R | 0.737666102933429 |
| R-squared | 0.544151279416992 |
| Adjusted R-squared | 0.392201705889323 |
| F-TEST (value) | 3.58113067897427 |
| F-TEST (DF numerator) | 15 |
| F-TEST (DF denominator) | 45 |
| p-value | 0.000455865512472009 |
| Multiple Linear Regression - Residual Statistics | |
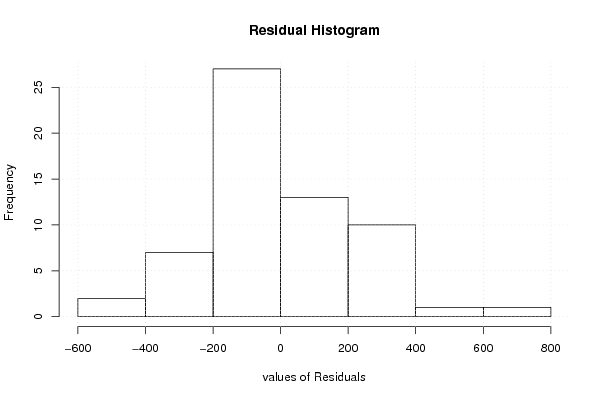
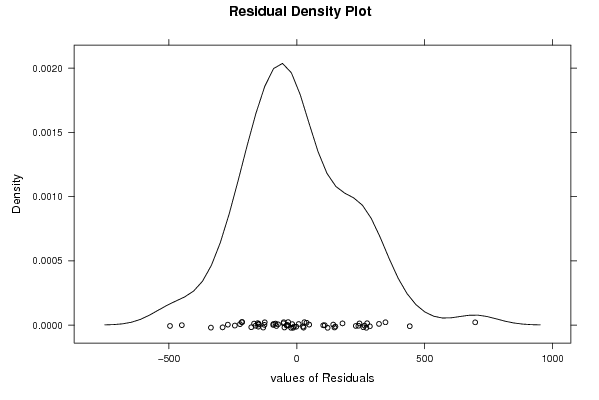
| Residual Standard Deviation | 248.415794172444 |
| Sum Squared Residuals | 2776968.30574466 |
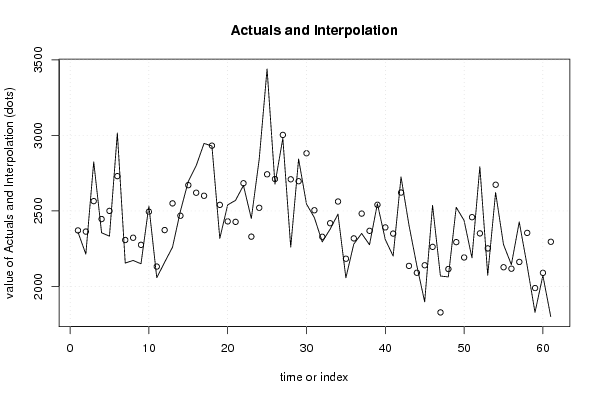
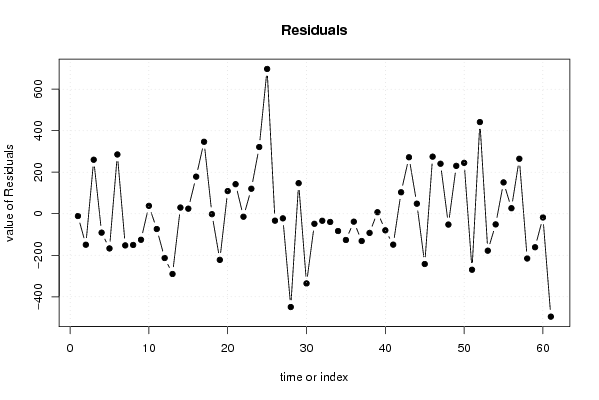
| Multiple Linear Regression - Actuals, Interpolation, and Residuals | |||
| Time or Index | Actuals | Interpolation Forecast | Residuals Prediction Error |
| 1 | 2360 | 2370.94408274775 | -10.9440827477537 |
| 2 | 2214 | 2363.26073922011 | -149.260739220114 |
| 3 | 2825 | 2564.87790823958 | 260.122091760418 |
| 4 | 2355 | 2446.06363679895 | -91.0636367989512 |
| 5 | 2333 | 2500.150390123 | -167.150390123001 |
| 6 | 3016 | 2730.39835569784 | 285.601644302156 |
| 7 | 2155 | 2307.47531562750 | -152.475315627505 |
| 8 | 2172 | 2322.42419461478 | -150.424194614779 |
| 9 | 2150 | 2275.39261393325 | -125.392613933248 |
| 10 | 2533 | 2494.8543439001 | 38.1456560999033 |
| 11 | 2058 | 2131.53821437135 | -73.5382143713462 |
| 12 | 2160 | 2373.20431394026 | -213.204313940262 |
| 13 | 2260 | 2550.13247226208 | -290.132472262079 |
| 14 | 2498 | 2468.21592287047 | 29.7840771295347 |
| 15 | 2695 | 2670.58986587087 | 24.4101341291327 |
| 16 | 2799 | 2620.32086820423 | 178.679131795772 |
| 17 | 2947 | 2600.34659692652 | 346.653403073479 |
| 18 | 2930 | 2932.06273185892 | -2.06273185891864 |
| 19 | 2318 | 2540.13552974541 | -222.135529745412 |
| 20 | 2540 | 2430.76847831946 | 109.231521680542 |
| 21 | 2570 | 2427.58839796174 | 142.411602038264 |
| 22 | 2669 | 2683.29972649229 | -14.2997264922944 |
| 23 | 2450 | 2329.55262151878 | 120.447378481216 |
| 24 | 2842 | 2520.58693839180 | 321.413061608205 |
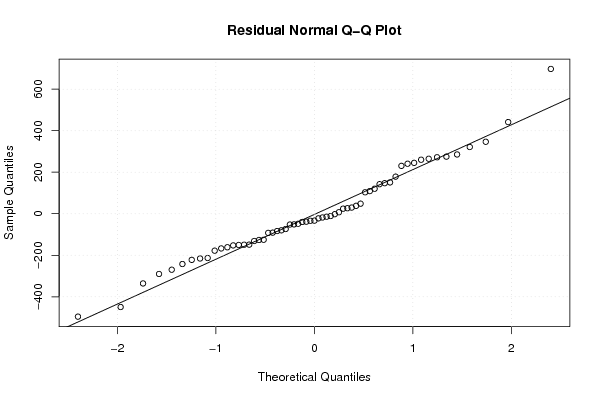
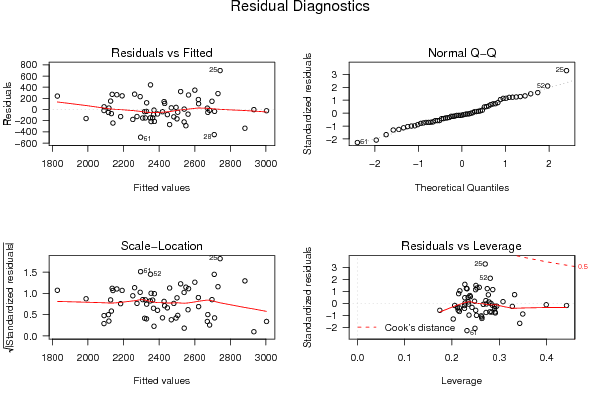
| 25 | 3440 | 2742.49965297038 | 697.500347029623 |
| 26 | 2678 | 2711.32888053959 | -33.3288805395925 |
| 27 | 2981 | 3003.18026416202 | -22.1802641620213 |
| 28 | 2260 | 2709.46576446555 | -449.465764465548 |
| 29 | 2844 | 2696.70429533406 | 147.295704665936 |
| 30 | 2546 | 2881.72584992033 | -335.725849920326 |
| 31 | 2456 | 2504.37333335246 | -48.3733333524587 |
| 32 | 2295 | 2328.81747841858 | -33.8174784185778 |
| 33 | 2379 | 2418.58988063521 | -39.5898806352127 |
| 34 | 2479 | 2562.27574830735 | -83.2757483073498 |
| 35 | 2057 | 2183.43514017265 | -126.435140172648 |
| 36 | 2280 | 2318.18872415478 | -38.1887241547824 |
| 37 | 2351 | 2482.29818293607 | -131.298182936073 |
| 38 | 2276 | 2368.29025253813 | -92.290252538125 |
| 39 | 2548 | 2540.7149139978 | 7.28508600220146 |
| 40 | 2311 | 2390.79428482979 | -79.7942848297873 |
| 41 | 2201 | 2349.87698362572 | -148.876983625724 |
| 42 | 2725 | 2621.51083616823 | 103.489163831767 |
| 43 | 2408 | 2135.9378740721 | 272.062125927901 |
| 44 | 2139 | 2090.52843216474 | 48.471567835263 |
| 45 | 1898 | 2140.22448634224 | -242.224486342240 |
| 46 | 2537 | 2262.03678918277 | 274.963210817235 |
| 47 | 2069 | 1828.09598568856 | 240.904014311445 |
| 48 | 2063 | 2115.10278797718 | -52.1027879771833 |
| 49 | 2524 | 2293.40688656888 | 230.593113431123 |
| 50 | 2437 | 2191.90420483170 | 245.095795168296 |
| 51 | 2189 | 2458.63704772973 | -269.637047729731 |
| 52 | 2793 | 2351.35544570149 | 441.644554298514 |
| 53 | 2074 | 2251.92173399069 | -177.921733990689 |
| 54 | 2622 | 2673.30222635468 | -51.3022263546779 |
| 55 | 2278 | 2127.07794720253 | 150.922052797475 |
| 56 | 2144 | 2117.46141648245 | 26.5385835175518 |
| 57 | 2427 | 2162.20462112756 | 264.795378872436 |
| 58 | 2139 | 2354.53339211749 | -215.533392117494 |
| 59 | 1828 | 1989.37803824867 | -161.378038248667 |
| 60 | 2072 | 2089.91723553598 | -17.9172355359773 |
| 61 | 1800 | 2295.71872251484 | -495.718722514840 |
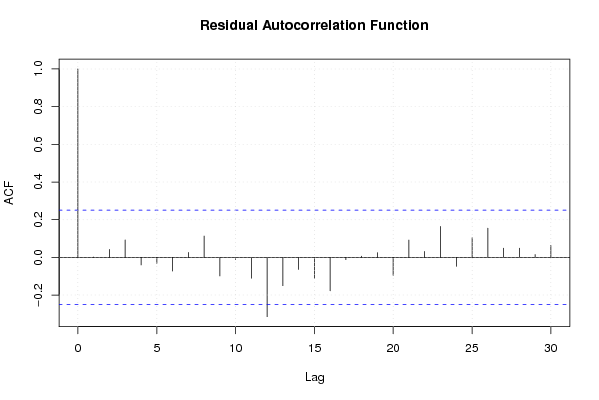
| Goldfeld-Quandt test for Heteroskedasticity | |||
| p-values | Alternative Hypothesis | ||
| breakpoint index | greater | 2-sided | less |
| 19 | 0.623056513133948 | 0.753886973732104 | 0.376943486866052 |
| 20 | 0.458930282725312 | 0.917860565450623 | 0.541069717274688 |
| 21 | 0.363106115145856 | 0.726212230291712 | 0.636893884854144 |
| 22 | 0.236816897522628 | 0.473633795045256 | 0.763183102477372 |
| 23 | 0.179178263923844 | 0.358356527847687 | 0.820821736076156 |
| 24 | 0.220765873412846 | 0.441531746825693 | 0.779234126587154 |
| 25 | 0.745158705811795 | 0.50968258837641 | 0.254841294188205 |
| 26 | 0.756577684268115 | 0.48684463146377 | 0.243422315731885 |
| 27 | 0.790014784024543 | 0.419970431950915 | 0.209985215975457 |
| 28 | 0.718255912800268 | 0.563488174399464 | 0.281744087199732 |
| 29 | 0.822619667130648 | 0.354760665738704 | 0.177380332869352 |
| 30 | 0.798668078201681 | 0.402663843596638 | 0.201331921798319 |
| 31 | 0.848519545741891 | 0.302960908516217 | 0.151480454258109 |
| 32 | 0.785574892876411 | 0.428850214247177 | 0.214425107123588 |
| 33 | 0.711496912560833 | 0.577006174878333 | 0.288503087439167 |
| 34 | 0.618358890631537 | 0.763282218736926 | 0.381641109368463 |
| 35 | 0.511721393043547 | 0.976557213912906 | 0.488278606956453 |
| 36 | 0.428726070812379 | 0.857452141624757 | 0.571273929187621 |
| 37 | 0.392199772951912 | 0.784399545903825 | 0.607800227048088 |
| 38 | 0.299410227208471 | 0.598820454416941 | 0.70058977279153 |
| 39 | 0.278790207778067 | 0.557580415556134 | 0.721209792221933 |
| 40 | 0.230257676855056 | 0.460515353710112 | 0.769742323144944 |
| 41 | 0.136603671674612 | 0.273207343349224 | 0.863396328325388 |
| 42 | 0.0774747899692988 | 0.154949579938598 | 0.922525210030701 |
| Meta Analysis of Goldfeld-Quandt test for Heteroskedasticity | |||
| Description | # significant tests | % significant tests | OK/NOK |
| 1% type I error level | 0 | 0 | OK |
| 5% type I error level | 0 | 0 | OK |
| 10% type I error level | 0 | 0 | OK |