| Multiple Linear Regression - Estimated Regression Equation |
| Werkl.graad[t] = + 10.4398432435199 -0.0246737999717481Industr.prod.[t] + e[t] |
| Multiple Linear Regression - Ordinary Least Squares | |||||
| Variable | Parameter | S.D. | T-STAT H0: parameter = 0 | 2-tail p-value | 1-tail p-value |
| (Intercept) | 10.4398432435199 | 0.903781 | 11.5513 | 0 | 0 |
| Industr.prod. | -0.0246737999717481 | 0.008644 | -2.8545 | 0.005828 | 0.002914 |
| Multiple Linear Regression - Regression Statistics | |
| Multiple R | 0.338411793864558 |
| R-squared | 0.114522542226628 |
| Adjusted R-squared | 0.100467344484193 |
| F-TEST (value) | 8.14805627962596 |
| F-TEST (DF numerator) | 1 |
| F-TEST (DF denominator) | 63 |
| p-value | 0.00582833248357506 |
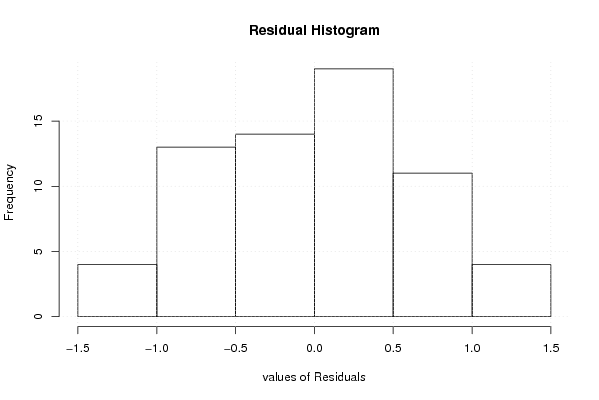
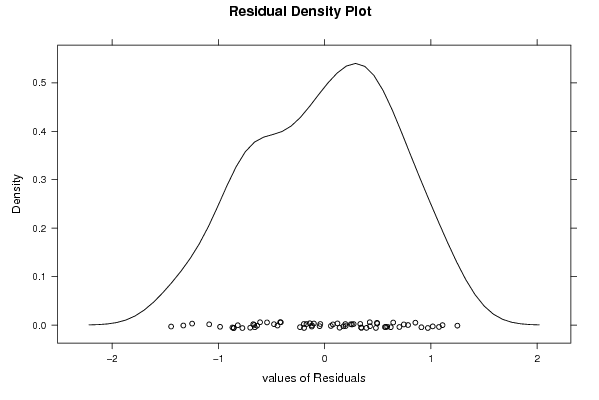
| Multiple Linear Regression - Residual Statistics | |
| Residual Standard Deviation | 0.664482105775001 |
| Sum Squared Residuals | 27.8167975403963 |
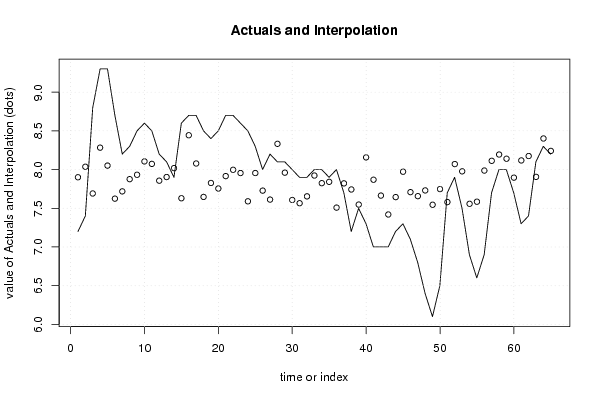
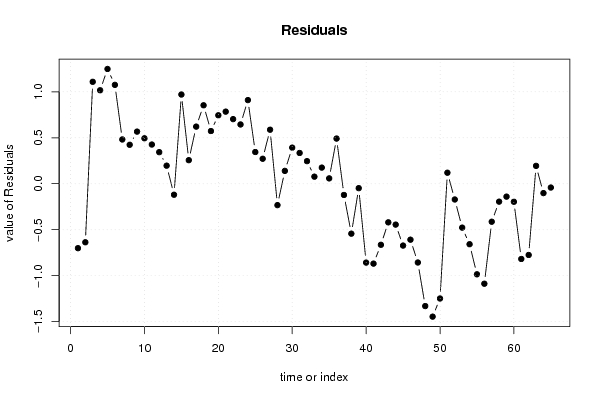
| Multiple Linear Regression - Actuals, Interpolation, and Residuals | |||
| Time or Index | Actuals | Interpolation Forecast | Residuals Prediction Error |
| 1 | 7.2 | 7.90090922642704 | -0.700909226427037 |
| 2 | 7.4 | 8.03661512627164 | -0.636615126271641 |
| 3 | 8.8 | 7.69118192666717 | 1.10881807333283 |
| 4 | 9.3 | 8.28335312598912 | 1.01664687401088 |
| 5 | 9.3 | 8.0514194062547 | 1.24858059374531 |
| 6 | 8.7 | 7.62456266674345 | 1.07543733325655 |
| 7 | 8.2 | 7.71832310663609 | 0.481676893363908 |
| 8 | 8.3 | 7.87623542645528 | 0.423764573544721 |
| 9 | 8.5 | 7.9329851663903 | 0.5670148336097 |
| 10 | 8.6 | 8.10570176619254 | 0.494298233807462 |
| 11 | 8.5 | 8.07362582622926 | 0.426374173770736 |
| 12 | 8.2 | 7.85649638647788 | 0.343503613522118 |
| 13 | 8.1 | 7.9033766064242 | 0.196623393575797 |
| 14 | 7.9 | 8.01934346629142 | -0.119343466291418 |
| 15 | 8.6 | 7.6294974267378 | 0.970502573262201 |
| 16 | 8.7 | 8.44373282580549 | 0.256267174194513 |
| 17 | 8.7 | 8.07856058622361 | 0.621439413776385 |
| 18 | 8.5 | 7.64676908671802 | 0.853230913281978 |
| 19 | 8.4 | 7.82688782651178 | 0.573112173488217 |
| 20 | 8.5 | 7.75533380659371 | 0.744666193406286 |
| 21 | 8.7 | 7.91571350641008 | 0.784286493589923 |
| 22 | 8.7 | 7.99713704631684 | 0.702862953683154 |
| 23 | 8.6 | 7.95519158636487 | 0.644808413635126 |
| 24 | 8.5 | 7.590019346783 | 0.909980653216999 |
| 25 | 8.3 | 7.95519158636487 | 0.344808413635127 |
| 26 | 8 | 7.7281926266248 | 0.271807373375209 |
| 27 | 8.2 | 7.61222576675757 | 0.587774233242425 |
| 28 | 8.1 | 8.33270072593262 | -0.23270072593262 |
| 29 | 8.1 | 7.96012634635922 | 0.139873653640777 |
| 30 | 8 | 7.60729100676322 | 0.392708993236775 |
| 31 | 7.9 | 7.56534554681125 | 0.334654453188747 |
| 32 | 7.9 | 7.65417122670955 | 0.245828773290454 |
| 33 | 8 | 7.9231156464016 | 0.076884353598399 |
| 34 | 8 | 7.8244204465146 | 0.175579553485392 |
| 35 | 7.9 | 7.84169210649483 | 0.0583078935051682 |
| 36 | 8 | 7.50859580687623 | 0.491404193123767 |
| 37 | 7.7 | 7.82195306651743 | -0.121953066517434 |
| 38 | 7.2 | 7.74299690660784 | -0.542996906607840 |
| 39 | 7.5 | 7.54807388683103 | -0.0480738868310294 |
| 40 | 7.3 | 8.1575167461332 | -0.857516746133208 |
| 41 | 7 | 7.86883328646375 | -0.868833286463755 |
| 42 | 7 | 7.66404074669825 | -0.664040746698246 |
| 43 | 7 | 7.41977012697794 | -0.419770126977939 |
| 44 | 7.2 | 7.64430170672085 | -0.444301706720847 |
| 45 | 7.3 | 7.9724632463451 | -0.672463246345097 |
| 46 | 7.1 | 7.70845358664739 | -0.608453586647392 |
| 47 | 6.8 | 7.65663860670672 | -0.856638606706721 |
| 48 | 6.4 | 7.73066000662197 | -1.33066000662197 |
| 49 | 6.1 | 7.54560650683385 | -1.44560650683386 |
| 50 | 6.5 | 7.74793166660219 | -1.24793166660219 |
| 51 | 7.7 | 7.5801498267943 | 0.119850173205698 |
| 52 | 7.9 | 8.07115844623209 | -0.171158446232089 |
| 53 | 7.5 | 7.97739800633945 | -0.477398006339447 |
| 54 | 6.9 | 7.55794340681973 | -0.657943406819728 |
| 55 | 6.6 | 7.58508458678865 | -0.985084586788652 |
| 56 | 6.9 | 7.98726752632815 | -1.08726752632815 |
| 57 | 7.7 | 8.11310390618406 | -0.413103906184061 |
| 58 | 8 | 8.19452744609083 | -0.194527446090830 |
| 59 | 8 | 8.14024508615298 | -0.140245086152984 |
| 60 | 7.7 | 7.89597446643268 | -0.195974466432678 |
| 61 | 7.3 | 8.1180386661784 | -0.818038666178411 |
| 62 | 7.4 | 8.17478840611343 | -0.774788406113431 |
| 63 | 8.1 | 7.90584398642138 | 0.194156013578622 |
| 64 | 8.3 | 8.40178736585352 | -0.101787365853514 |
| 65 | 8.2 | 8.24140766603715 | -0.0414076660371526 |
| Goldfeld-Quandt test for Heteroskedasticity | |||
| p-values | Alternative Hypothesis | ||
| breakpoint index | greater | 2-sided | less |
| 5 | 0.971778566577711 | 0.0564428668445771 | 0.0282214334222886 |
| 6 | 0.963251119453557 | 0.0734977610928863 | 0.0367488805464432 |
| 7 | 0.93262842935286 | 0.134743141294282 | 0.0673715706471408 |
| 8 | 0.888348997616436 | 0.223302004767129 | 0.111651002383564 |
| 9 | 0.834408157729085 | 0.331183684541830 | 0.165591842270915 |
| 10 | 0.768208411787842 | 0.463583176424316 | 0.231791588212158 |
| 11 | 0.691333464333257 | 0.617333071333486 | 0.308666535666743 |
| 12 | 0.610831973901324 | 0.778336052197352 | 0.389168026098676 |
| 13 | 0.534250184445406 | 0.931499631109188 | 0.465749815554594 |
| 14 | 0.492760837633707 | 0.985521675267414 | 0.507239162366293 |
| 15 | 0.479291157583962 | 0.958582315167923 | 0.520708842416038 |
| 16 | 0.40173599561508 | 0.80347199123016 | 0.59826400438492 |
| 17 | 0.358917325788716 | 0.717834651577431 | 0.641082674211285 |
| 18 | 0.336356695054546 | 0.672713390109091 | 0.663643304945454 |
| 19 | 0.290683922818152 | 0.581367845636305 | 0.709316077181848 |
| 20 | 0.26968069520265 | 0.5393613904053 | 0.73031930479735 |
| 21 | 0.270750547563346 | 0.541501095126693 | 0.729249452436654 |
| 22 | 0.269230380012001 | 0.538460760024002 | 0.730769619987999 |
| 23 | 0.263718462881073 | 0.527436925762147 | 0.736281537118927 |
| 24 | 0.303866726528746 | 0.607733453057491 | 0.696133273471254 |
| 25 | 0.280138029013279 | 0.560276058026557 | 0.719861970986721 |
| 26 | 0.269985998261708 | 0.539971996523415 | 0.730014001738292 |
| 27 | 0.288117744075535 | 0.57623548815107 | 0.711882255924465 |
| 28 | 0.26277342657367 | 0.52554685314734 | 0.73722657342633 |
| 29 | 0.244497885695638 | 0.488995771391276 | 0.755502114304362 |
| 30 | 0.261436371081930 | 0.522872742163859 | 0.73856362891807 |
| 31 | 0.288470642693684 | 0.576941285387368 | 0.711529357306316 |
| 32 | 0.311979594564806 | 0.623959189129611 | 0.688020405435194 |
| 33 | 0.306219335809482 | 0.612438671618964 | 0.693780664190518 |
| 34 | 0.319552757432301 | 0.639105514864602 | 0.680447242567699 |
| 35 | 0.328554172731531 | 0.657108345463062 | 0.671445827268469 |
| 36 | 0.50131107137945 | 0.9973778572411 | 0.49868892862055 |
| 37 | 0.528464497567746 | 0.943071004864508 | 0.471535502432254 |
| 38 | 0.607104263472686 | 0.785791473054628 | 0.392895736527314 |
| 39 | 0.679827444414955 | 0.64034511117009 | 0.320172555585045 |
| 40 | 0.780519714225211 | 0.438960571549578 | 0.219480285774789 |
| 41 | 0.843563245127972 | 0.312873509744056 | 0.156436754872028 |
| 42 | 0.856215715524776 | 0.287568568950449 | 0.143784284475224 |
| 43 | 0.874411829310954 | 0.251176341378093 | 0.125588170689046 |
| 44 | 0.86970002733756 | 0.260599945324882 | 0.130299972662441 |
| 45 | 0.859316554266496 | 0.281366891467009 | 0.140683445733504 |
| 46 | 0.841322651996837 | 0.317354696006325 | 0.158677348003163 |
| 47 | 0.831888489146125 | 0.336223021707751 | 0.168111510853875 |
| 48 | 0.900585213462531 | 0.198829573074937 | 0.0994147865374686 |
| 49 | 0.951097841694941 | 0.0978043166101177 | 0.0489021583050588 |
| 50 | 0.977181143981445 | 0.0456377120371101 | 0.0228188560185550 |
| 51 | 0.986617375410639 | 0.0267652491787225 | 0.0133826245893613 |
| 52 | 0.977567344143363 | 0.0448653117132736 | 0.0224326558566368 |
| 53 | 0.960281550637752 | 0.0794368987244955 | 0.0397184493622478 |
| 54 | 0.934146823835998 | 0.131706352328004 | 0.0658531761640021 |
| 55 | 0.914880952006226 | 0.170238095987548 | 0.0851190479937742 |
| 56 | 0.965493578647901 | 0.0690128427041979 | 0.0345064213520990 |
| 57 | 0.933607774480789 | 0.132784451038423 | 0.0663922255192113 |
| 58 | 0.871457444700668 | 0.257085110598663 | 0.128542555299332 |
| 59 | 0.771835994547204 | 0.456328010905592 | 0.228164005452796 |
| 60 | 0.611727618777608 | 0.776544762444784 | 0.388272381222392 |
| Meta Analysis of Goldfeld-Quandt test for Heteroskedasticity | |||
| Description | # significant tests | % significant tests | OK/NOK |
| 1% type I error level | 0 | 0 | OK |
| 5% type I error level | 3 | 0.0535714285714286 | NOK |
| 10% type I error level | 8 | 0.142857142857143 | NOK |