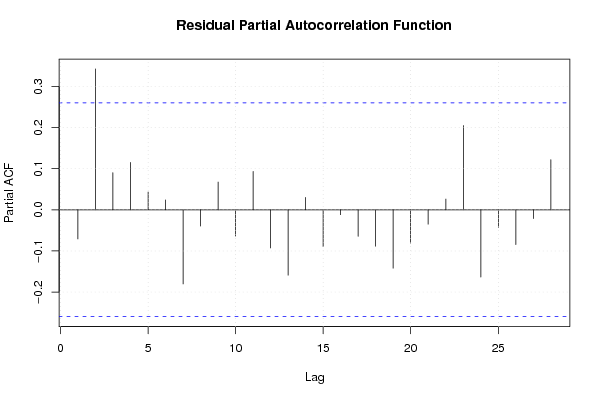
| Multiple Linear Regression - Estimated Regression Equation |
| s[t] = + 8.69448494597229 + 0.128118770999304consv[t] + 0.538300231532793`y(t-1)`[t] -0.344447299199426M1[t] -1.44883997873163M2[t] -3.2764835967175M3[t] -0.196764365358310M4[t] + 0.499140152070973M5[t] -1.07683655950044M6[t] -1.04275401159163M7[t] + 0.124585939396124M8[t] -0.656529404254919M9[t] -5.28497294610116M10[t] + 1.50084427465382M11[t] -0.100772349974912t + e[t] |
| Multiple Linear Regression - Ordinary Least Squares | |||||
| Variable | Parameter | S.D. | T-STAT H0: parameter = 0 | 2-tail p-value | 1-tail p-value |
| (Intercept) | 8.69448494597229 | 3.846623 | 2.2603 | 0.029048 | 0.014524 |
| consv | 0.128118770999304 | 0.070598 | 1.8148 | 0.076705 | 0.038353 |
| `y(t-1)` | 0.538300231532793 | 0.12977 | 4.1481 | 0.00016 | 8e-05 |
| M1 | -0.344447299199426 | 2.096805 | -0.1643 | 0.870305 | 0.435152 |
| M2 | -1.44883997873163 | 2.101621 | -0.6894 | 0.494368 | 0.247184 |
| M3 | -3.2764835967175 | 2.093383 | -1.5652 | 0.125049 | 0.062525 |
| M4 | -0.196764365358310 | 2.105631 | -0.0934 | 0.925993 | 0.462996 |
| M5 | 0.499140152070973 | 2.092387 | 0.2386 | 0.812614 | 0.406307 |
| M6 | -1.07683655950044 | 2.106001 | -0.5113 | 0.611806 | 0.305903 |
| M7 | -1.04275401159163 | 2.092644 | -0.4983 | 0.620876 | 0.310438 |
| M8 | 0.124585939396124 | 2.092669 | 0.0595 | 0.952809 | 0.476404 |
| M9 | -0.656529404254919 | 2.103696 | -0.3121 | 0.756521 | 0.37826 |
| M10 | -5.28497294610116 | 2.214199 | -2.3869 | 0.021573 | 0.010787 |
| M11 | 1.50084427465382 | 2.270596 | 0.661 | 0.512228 | 0.256114 |
| t | -0.100772349974912 | 0.046164 | -2.1829 | 0.034681 | 0.01734 |
| Multiple Linear Regression - Regression Statistics | |
| Multiple R | 0.89863671548725 |
| R-squared | 0.807547946421712 |
| Adjusted R-squared | 0.743397261895616 |
| F-TEST (value) | 12.5882981980217 |
| F-TEST (DF numerator) | 14 |
| F-TEST (DF denominator) | 42 |
| p-value | 8.20095102938012e-11 |
| Multiple Linear Regression - Residual Statistics | |
| Residual Standard Deviation | 3.11547870816889 |
| Sum Squared Residuals | 407.660718404254 |
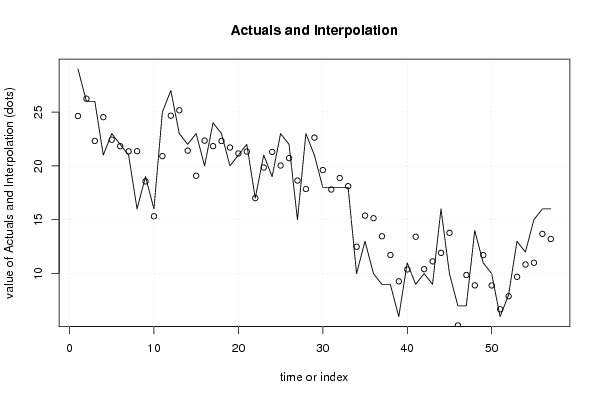
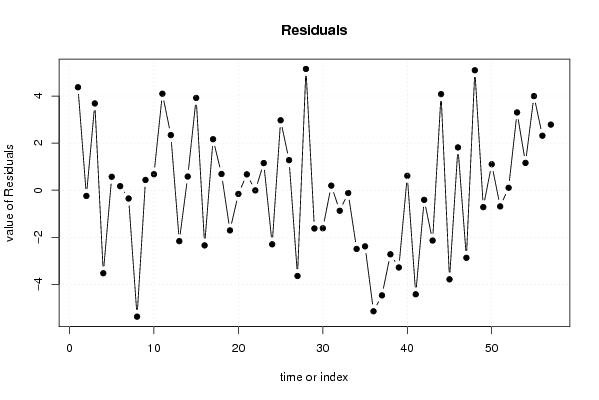
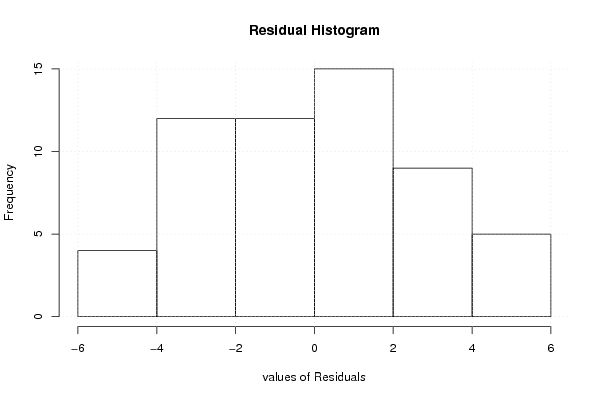
| Multiple Linear Regression - Actuals, Interpolation, and Residuals | |||
| Time or Index | Actuals | Interpolation Forecast | Residuals Prediction Error |
| 1 | 29 | 24.6276776705662 | 4.37232232943383 |
| 2 | 26 | 26.2421325697223 | -0.242132569722334 |
| 3 | 26 | 22.3144595941652 | 3.68554040583475 |
| 4 | 21 | 24.5246938495537 | -3.52469384955372 |
| 5 | 23 | 22.4283248593441 | 0.571675140655879 |
| 6 | 22 | 21.8281762608634 | 0.171823739136617 |
| 7 | 21 | 21.3513049982638 | -0.351304998263802 |
| 8 | 16 | 21.3670972837466 | -5.36709728374664 |
| 9 | 19 | 18.5624210584525 | 0.437578941547465 |
| 10 | 16 | 15.3199870902305 | 0.680012909769545 |
| 11 | 25 | 20.9026063504094 | 4.09739364959064 |
| 12 | 27 | 24.658166893573 | 2.34183310642702 |
| 13 | 23 | 25.1614289364649 | -2.16142893646492 |
| 14 | 22 | 21.4187066678287 | 0.581293332171277 |
| 15 | 23 | 19.0801092393344 | 3.91989076066555 |
| 16 | 20 | 22.3411188102529 | -2.34111881025292 |
| 17 | 24 | 21.8338253671061 | 2.16617463289388 |
| 18 | 23 | 22.3102772316910 | 0.689722768309033 |
| 19 | 20 | 21.7052871980921 | -1.70528719809208 |
| 20 | 21 | 21.1569541045065 | -0.156954104506540 |
| 21 | 22 | 21.3258417264106 | 0.674158273589407 |
| 22 | 17 | 17.0068072951229 | -0.00680729512292821 |
| 23 | 21 | 19.8472820692453 | 1.15271793075470 |
| 24 | 19 | 21.2956977677429 | -2.29569776774287 |
| 25 | 23 | 20.0301151975015 | 2.96988480249845 |
| 26 | 22 | 20.721913552127 | 1.27808644787300 |
| 27 | 15 | 18.6395536656313 | -3.63955366563133 |
| 28 | 23 | 17.8503989262861 | 5.14960107371394 |
| 29 | 21 | 22.6238141750035 | -1.62381417500347 |
| 30 | 18 | 19.6142271083929 | -1.61422710839295 |
| 31 | 18 | 17.8045178407292 | 0.195482159270827 |
| 32 | 18 | 18.871085441742 | -0.87108544174201 |
| 33 | 18 | 18.1173165191154 | -0.117316519115359 |
| 34 | 10 | 12.4912692302991 | -2.49126923029908 |
| 35 | 13 | 15.3823873328140 | -2.38238733281402 |
| 36 | 10 | 15.1394338607851 | -5.13943386078506 |
| 37 | 9 | 13.4636698300103 | -4.46366983001026 |
| 38 | 9 | 11.7202045689703 | -2.72020456897034 |
| 39 | 6 | 9.27931351701234 | -3.27931351701234 |
| 40 | 11 | 10.3871221617996 | 0.61287783820036 |
| 41 | 9 | 13.4175179449194 | -4.41751794491936 |
| 42 | 10 | 10.4079308783088 | -0.407930878308846 |
| 43 | 9 | 11.1357788497742 | -2.13577884977415 |
| 44 | 16 | 11.9202837612528 | 4.0797162387472 |
| 45 | 10 | 13.7815475203620 | -3.78154752036197 |
| 46 | 7 | 5.18193638434754 | 1.81806361565246 |
| 47 | 7 | 9.86772424753132 | -2.86772424753132 |
| 48 | 14 | 8.9067014778991 | 5.09329852210089 |
| 49 | 11 | 11.7171083654571 | -0.7171083654571 |
| 50 | 10 | 8.8970426413516 | 1.10295735864839 |
| 51 | 6 | 6.68656398385663 | -0.686563983856633 |
| 52 | 8 | 7.89666625210766 | 0.103333747892342 |
| 53 | 13 | 9.69651765362691 | 3.30348234637309 |
| 54 | 12 | 10.8393885207439 | 1.16061147925614 |
| 55 | 15 | 11.0031111131408 | 3.99688888685921 |
| 56 | 16 | 13.684579408752 | 2.31542059124799 |
| 57 | 16 | 13.2128731756595 | 2.78712682434046 |
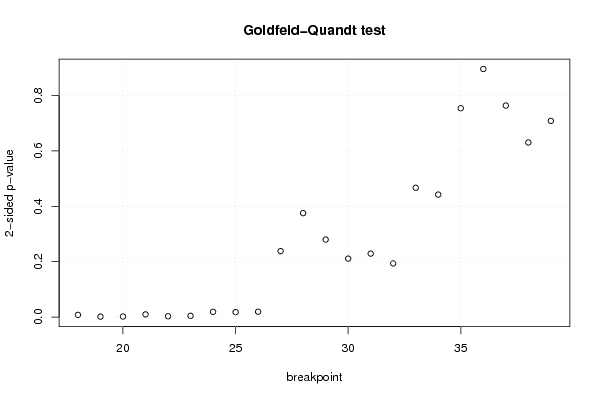
| Goldfeld-Quandt test for Heteroskedasticity | |||
| p-values | Alternative Hypothesis | ||
| breakpoint index | greater | 2-sided | less |
| 18 | 0.00397625682874586 | 0.00795251365749173 | 0.996023743171254 |
| 19 | 0.00077298603271784 | 0.00154597206543568 | 0.999227013967282 |
| 20 | 0.00102233728037747 | 0.00204467456075494 | 0.998977662719623 |
| 21 | 0.00487394674012363 | 0.00974789348024726 | 0.995126053259876 |
| 22 | 0.00142037361172339 | 0.00284074722344677 | 0.998579626388277 |
| 23 | 0.00231155666673167 | 0.00462311333346334 | 0.997688443333268 |
| 24 | 0.00946155850416627 | 0.0189231170083325 | 0.990538441495834 |
| 25 | 0.0090344065646854 | 0.0180688131293708 | 0.990965593435315 |
| 26 | 0.00969868442173547 | 0.0193973688434709 | 0.990301315578265 |
| 27 | 0.119079009442639 | 0.238158018885278 | 0.880920990557361 |
| 28 | 0.187577116461207 | 0.375154232922414 | 0.812422883538793 |
| 29 | 0.139969507443143 | 0.279939014886286 | 0.860030492556857 |
| 30 | 0.105505787065326 | 0.211011574130652 | 0.894494212934674 |
| 31 | 0.114597541233191 | 0.229195082466381 | 0.88540245876681 |
| 32 | 0.0968714417301706 | 0.193742883460341 | 0.903128558269829 |
| 33 | 0.233473607358809 | 0.466947214717619 | 0.76652639264119 |
| 34 | 0.221135458938559 | 0.442270917877117 | 0.778864541061441 |
| 35 | 0.622980004149639 | 0.754039991700723 | 0.377019995850361 |
| 36 | 0.552071765322572 | 0.895856469354856 | 0.447928234677428 |
| 37 | 0.618165783893666 | 0.763668432212668 | 0.381834216106334 |
| 38 | 0.684790092921503 | 0.630419814156994 | 0.315209907078497 |
| 39 | 0.645862928243061 | 0.708274143513878 | 0.354137071756939 |
| Meta Analysis of Goldfeld-Quandt test for Heteroskedasticity | |||
| Description | # significant tests | % significant tests | OK/NOK |
| 1% type I error level | 6 | 0.272727272727273 | NOK |
| 5% type I error level | 9 | 0.409090909090909 | NOK |
| 10% type I error level | 9 | 0.409090909090909 | NOK |