| Multiple Linear Regression - Estimated Regression Equation |
| Y[t] = + 2861.32796370422 -157.795638797568X[t] + e[t] |
| Multiple Linear Regression - Ordinary Least Squares | |||||
| Variable | Parameter | S.D. | T-STAT H0: parameter = 0 | 2-tail p-value | 1-tail p-value |
| (Intercept) | 2861.32796370422 | 123.834202 | 23.1061 | 0 | 0 |
| X | -157.795638797568 | 41.91322 | -3.7648 | 0.000386 | 0.000193 |
| Multiple Linear Regression - Regression Statistics | |
| Multiple R | 0.440114835451552 |
| R-squared | 0.193701068384547 |
| Adjusted R-squared | 0.180034984797844 |
| F-TEST (value) | 14.1738536249714 |
| F-TEST (DF numerator) | 1 |
| F-TEST (DF denominator) | 59 |
| p-value | 0.000386266723775286 |
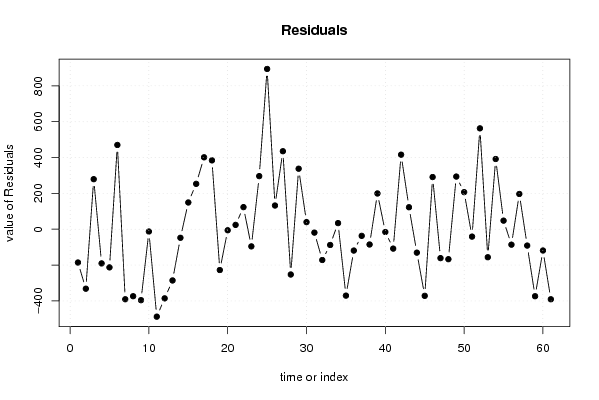
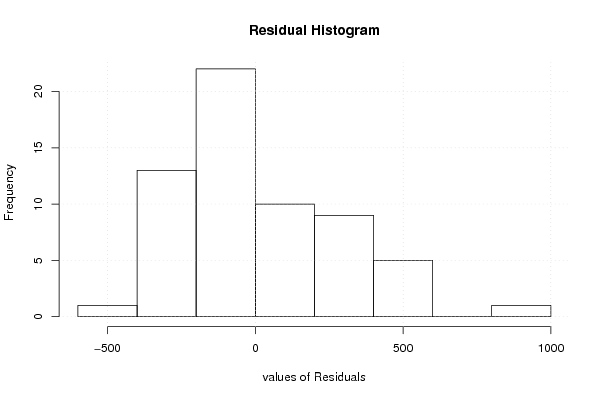
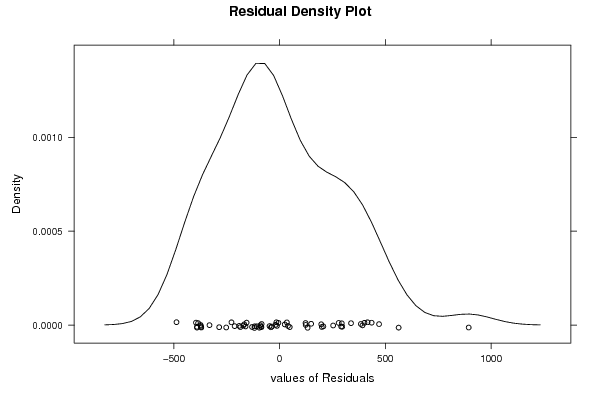
| Multiple Linear Regression - Residual Statistics | |
| Residual Standard Deviation | 288.534087217345 |
| Sum Squared Residuals | 4911863.24969443 |
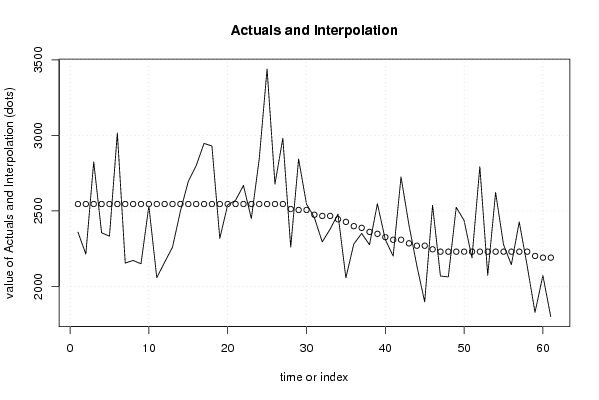
| Multiple Linear Regression - Actuals, Interpolation, and Residuals | |||
| Time or Index | Actuals | Interpolation Forecast | Residuals Prediction Error |
| 1 | 2360 | 2545.73668610908 | -185.736686109083 |
| 2 | 2214 | 2545.73668610909 | -331.736686109087 |
| 3 | 2825 | 2545.73668610909 | 279.263313890913 |
| 4 | 2355 | 2545.73668610909 | -190.736686109087 |
| 5 | 2333 | 2545.73668610909 | -212.736686109087 |
| 6 | 3016 | 2545.73668610909 | 470.263313890913 |
| 7 | 2155 | 2545.73668610909 | -390.736686109087 |
| 8 | 2172 | 2545.73668610909 | -373.736686109087 |
| 9 | 2150 | 2545.73668610909 | -395.736686109087 |
| 10 | 2533 | 2545.73668610909 | -12.7366861090875 |
| 11 | 2058 | 2545.73668610909 | -487.736686109087 |
| 12 | 2160 | 2545.73668610909 | -385.736686109087 |
| 13 | 2260 | 2545.73668610909 | -285.736686109087 |
| 14 | 2498 | 2545.73668610909 | -47.7366861090875 |
| 15 | 2695 | 2545.73668610909 | 149.263313890913 |
| 16 | 2799 | 2545.73668610909 | 253.263313890913 |
| 17 | 2947 | 2545.73668610909 | 401.263313890913 |
| 18 | 2930 | 2545.73668610909 | 384.263313890913 |
| 19 | 2318 | 2545.73668610909 | -227.736686109087 |
| 20 | 2540 | 2545.73668610909 | -5.73668610908745 |
| 21 | 2570 | 2545.73668610909 | 24.2633138909125 |
| 22 | 2669 | 2545.73668610909 | 123.263313890913 |
| 23 | 2450 | 2545.73668610909 | -95.7366861090875 |
| 24 | 2842 | 2545.73668610909 | 296.263313890913 |
| 25 | 3440 | 2545.73668610909 | 894.263313890913 |
| 26 | 2678 | 2545.73668610909 | 132.263313890913 |
| 27 | 2981 | 2545.73668610909 | 435.263313890913 |
| 28 | 2260 | 2512.5996019616 | -252.599601961598 |
| 29 | 2844 | 2506.28777640970 | 337.712223590304 |
| 30 | 2546 | 2506.28777640970 | 39.7122235903044 |
| 31 | 2456 | 2474.72864865018 | -18.728648650182 |
| 32 | 2295 | 2466.83886671030 | -171.838866710304 |
| 33 | 2379 | 2466.83886671030 | -87.8388667103037 |
| 34 | 2479 | 2444.74747727864 | 34.2525227213558 |
| 35 | 2057 | 2427.38995701091 | -370.389957010912 |
| 36 | 2280 | 2398.98674202735 | -118.986742027350 |
| 37 | 2351 | 2387.94104731152 | -36.9410473115199 |
| 38 | 2276 | 2361.11578871593 | -85.1157887159334 |
| 39 | 2548 | 2348.49213761213 | 199.507862387872 |
| 40 | 2311 | 2326.40074818047 | -15.4007481804685 |
| 41 | 2201 | 2309.04322791274 | -108.043227912736 |
| 42 | 2725 | 2309.04322791274 | 415.956772087264 |
| 43 | 2408 | 2285.3738820931 | 122.626117906899 |
| 44 | 2139 | 2269.59431821334 | -130.594318213344 |
| 45 | 1898 | 2269.59431821334 | -371.594318213344 |
| 46 | 2537 | 2245.92497239371 | 291.075027606291 |
| 47 | 2069 | 2230.14540851395 | -161.145408513952 |
| 48 | 2063 | 2230.14540851395 | -167.145408513952 |
| 49 | 2524 | 2230.14540851395 | 293.854591486048 |
| 50 | 2437 | 2230.14540851395 | 206.854591486048 |
| 51 | 2189 | 2230.14540851395 | -41.1454085139523 |
| 52 | 2793 | 2230.14540851395 | 562.854591486048 |
| 53 | 2074 | 2230.14540851395 | -156.145408513952 |
| 54 | 2622 | 2230.14540851395 | 391.854591486048 |
| 55 | 2278 | 2230.14540851395 | 47.8545914860477 |
| 56 | 2144 | 2230.14540851395 | -86.1454085139523 |
| 57 | 2427 | 2230.14540851395 | 196.854591486048 |
| 58 | 2139 | 2230.14540851395 | -91.1454085139523 |
| 59 | 1828 | 2201.74219353039 | -373.74219353039 |
| 60 | 2072 | 2190.69649881456 | -118.696498814560 |
| 61 | 1800 | 2190.69649881456 | -390.696498814560 |
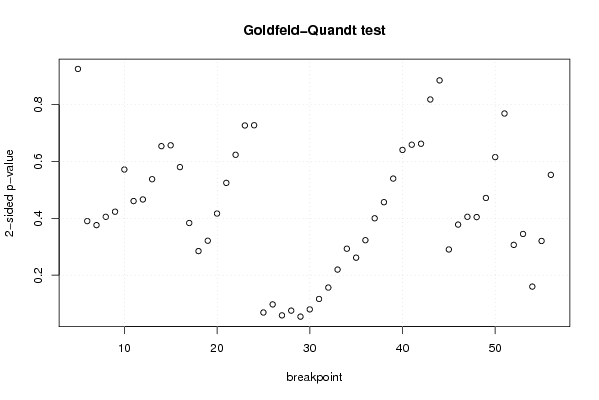
| Goldfeld-Quandt test for Heteroskedasticity | |||
| p-values | Alternative Hypothesis | ||
| breakpoint index | greater | 2-sided | less |
| 5 | 0.537287400690229 | 0.925425198619543 | 0.462712599309771 |
| 6 | 0.804813593416384 | 0.390372813167231 | 0.195186406583616 |
| 7 | 0.811923419342388 | 0.376153161315224 | 0.188076580657612 |
| 8 | 0.79729346030964 | 0.405413079380722 | 0.202706539690361 |
| 9 | 0.788326215671903 | 0.423347568656194 | 0.211673784328097 |
| 10 | 0.714116853755679 | 0.571766292488642 | 0.285883146244321 |
| 11 | 0.769589473719712 | 0.460821052560576 | 0.230410526280288 |
| 12 | 0.766741842519255 | 0.466516314961489 | 0.233258157480745 |
| 13 | 0.731153830166949 | 0.537692339666102 | 0.268846169833051 |
| 14 | 0.673080751263113 | 0.653838497473775 | 0.326919248736887 |
| 15 | 0.671543899165177 | 0.656912201669647 | 0.328456100834823 |
| 16 | 0.709875955594169 | 0.580248088811662 | 0.290124044405831 |
| 17 | 0.808170093692086 | 0.383659812615828 | 0.191829906307914 |
| 18 | 0.857572144218448 | 0.284855711563104 | 0.142427855781552 |
| 19 | 0.839321396614566 | 0.321357206770869 | 0.160678603385435 |
| 20 | 0.791517550606105 | 0.416964898787791 | 0.208482449393895 |
| 21 | 0.737627014431781 | 0.524745971136438 | 0.262372985568219 |
| 22 | 0.688240679098006 | 0.623518641803989 | 0.311759320901994 |
| 23 | 0.636669993160307 | 0.726660013679385 | 0.363330006839693 |
| 24 | 0.636286562187724 | 0.727426875624552 | 0.363713437812276 |
| 25 | 0.965532960586167 | 0.0689340788276666 | 0.0344670394138333 |
| 26 | 0.951323142189626 | 0.0973537156207487 | 0.0486768578103743 |
| 27 | 0.970603461228093 | 0.0587930775438142 | 0.0293965387719071 |
| 28 | 0.962254897548313 | 0.0754902049033748 | 0.0377451024516874 |
| 29 | 0.972852634919765 | 0.0542947301604693 | 0.0271473650802346 |
| 30 | 0.960055902102807 | 0.0798881957943866 | 0.0399440978971933 |
| 31 | 0.941768137697188 | 0.116463724605625 | 0.0582318623028124 |
| 32 | 0.921677263833533 | 0.156645472332934 | 0.078322736166467 |
| 33 | 0.89008604868186 | 0.219827902636280 | 0.109913951318140 |
| 34 | 0.853384608636742 | 0.293230782726516 | 0.146615391363258 |
| 35 | 0.869139782265763 | 0.261720435468474 | 0.130860217734237 |
| 36 | 0.838435330543218 | 0.323129338913564 | 0.161564669456782 |
| 37 | 0.799866729622801 | 0.400266540754398 | 0.200133270377199 |
| 38 | 0.771582181855565 | 0.456835636288869 | 0.228417818144435 |
| 39 | 0.730065420849167 | 0.539869158301666 | 0.269934579150833 |
| 40 | 0.679689033909764 | 0.640621932180472 | 0.320310966090236 |
| 41 | 0.670522597775693 | 0.658954804448614 | 0.329477402224307 |
| 42 | 0.668813119290974 | 0.662373761418053 | 0.331186880709026 |
| 43 | 0.590980318238158 | 0.818039363523684 | 0.409019681761842 |
| 44 | 0.557366948027567 | 0.885266103944867 | 0.442633051972433 |
| 45 | 0.854709040510047 | 0.290581918979906 | 0.145290959489953 |
| 46 | 0.811001738002946 | 0.377996523994108 | 0.188998261997054 |
| 47 | 0.797246497982192 | 0.405507004035616 | 0.202753502017808 |
| 48 | 0.797765007894933 | 0.404469984210134 | 0.202234992105067 |
| 49 | 0.764155481195232 | 0.471689037609535 | 0.235844518804767 |
| 50 | 0.692270542198393 | 0.615458915603214 | 0.307729457801607 |
| 51 | 0.615624680618528 | 0.768750638762944 | 0.384375319381472 |
| 52 | 0.846657770683418 | 0.306684458633164 | 0.153342229316582 |
| 53 | 0.827443538714534 | 0.345112922570932 | 0.172556461285466 |
| 54 | 0.92001054972698 | 0.159978900546039 | 0.0799894502730194 |
| 55 | 0.839751812684962 | 0.320496374630077 | 0.160248187315038 |
| 56 | 0.723495718110025 | 0.553008563779949 | 0.276504281889975 |
| Meta Analysis of Goldfeld-Quandt test for Heteroskedasticity | |||
| Description | # significant tests | % significant tests | OK/NOK |
| 1% type I error level | 0 | 0 | OK |
| 5% type I error level | 0 | 0 | OK |
| 10% type I error level | 6 | 0.115384615384615 | NOK |