| Multiple Linear Regression - Estimated Regression Equation |
| s[t] = + 8.53757859793634 + 0.116192357805682consv[t] + 0.431844748244927`y(t-1)`[t] + 0.314619658899698`y(t-2)`[t] -0.104294325773217`y(t-3)`[t] -0.0303437661333572`y(t-4)`[t] -2.05606014705970M1[t] -3.08835545424920M2[t] -4.95092737842675M3[t] -1.76783608517104M4[t] -0.238952069021539M5[t] -2.44084765933435M6[t] -2.88724301052567M7[t] -1.28389824915988M8[t] -1.93079924912808M9[t] -6.85809143702282M10[t] -0.412018727564027M11[t] -0.0810169313766484t + e[t] |
| Multiple Linear Regression - Ordinary Least Squares | |||||
| Variable | Parameter | S.D. | T-STAT H0: parameter = 0 | 2-tail p-value | 1-tail p-value |
| (Intercept) | 8.53757859793634 | 4.84348 | 1.7627 | 0.085788 | 0.042894 |
| consv | 0.116192357805682 | 0.074015 | 1.5699 | 0.124528 | 0.062264 |
| `y(t-1)` | 0.431844748244927 | 0.156282 | 2.7632 | 0.008689 | 0.004344 |
| `y(t-2)` | 0.314619658899698 | 0.171318 | 1.8365 | 0.07392 | 0.03696 |
| `y(t-3)` | -0.104294325773217 | 0.17345 | -0.6013 | 0.551124 | 0.275562 |
| `y(t-4)` | -0.0303437661333572 | 0.167302 | -0.1814 | 0.857016 | 0.428508 |
| M1 | -2.05606014705970 | 2.379737 | -0.864 | 0.392878 | 0.196439 |
| M2 | -3.08835545424920 | 2.42868 | -1.2716 | 0.21104 | 0.10552 |
| M3 | -4.95092737842675 | 2.285318 | -2.1664 | 0.036453 | 0.018226 |
| M4 | -1.76783608517104 | 2.288861 | -0.7724 | 0.444554 | 0.222277 |
| M5 | -0.238952069021539 | 2.121875 | -0.1126 | 0.910915 | 0.455457 |
| M6 | -2.44084765933435 | 2.246256 | -1.0866 | 0.283871 | 0.141936 |
| M7 | -2.88724301052567 | 2.359874 | -1.2235 | 0.228492 | 0.114246 |
| M8 | -1.28389824915988 | 2.245427 | -0.5718 | 0.57075 | 0.285375 |
| M9 | -1.93079924912808 | 2.200794 | -0.8773 | 0.385686 | 0.192843 |
| M10 | -6.85809143702282 | 2.358847 | -2.9074 | 0.005984 | 0.002992 |
| M11 | -0.412018727564027 | 2.528009 | -0.163 | 0.871375 | 0.435687 |
| t | -0.0810169313766484 | 0.0603 | -1.3436 | 0.186857 | 0.093428 |
| Multiple Linear Regression - Regression Statistics | |
| Multiple R | 0.907368783699279 |
| R-squared | 0.82331810963191 |
| Adjusted R-squared | 0.746302926650947 |
| F-TEST (value) | 10.6903350451745 |
| F-TEST (DF numerator) | 17 |
| F-TEST (DF denominator) | 39 |
| p-value | 7.56620321951118e-10 |
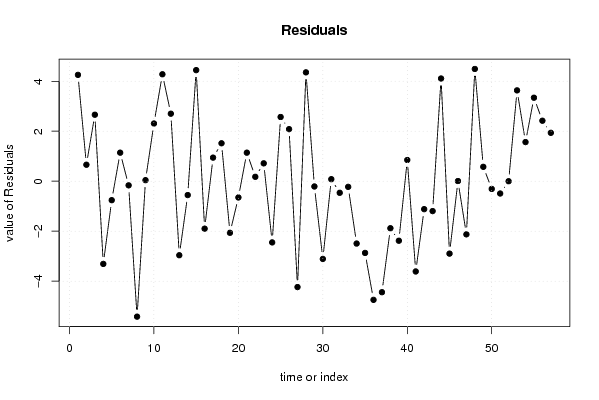
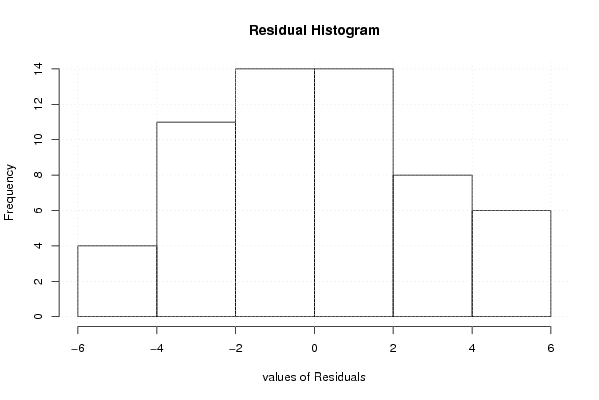
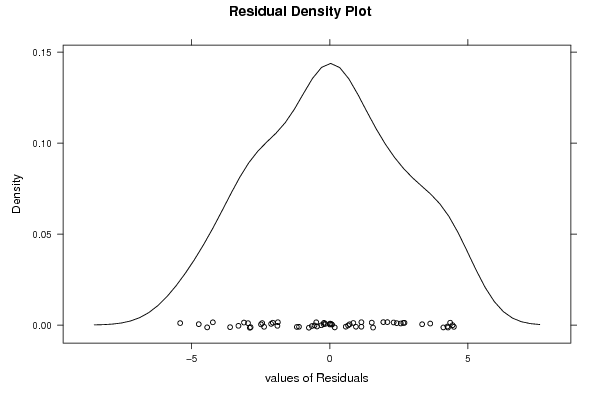
| Multiple Linear Regression - Residual Statistics | |
| Residual Standard Deviation | 3.09778928349134 |
| Sum Squared Residuals | 374.255639351637 |
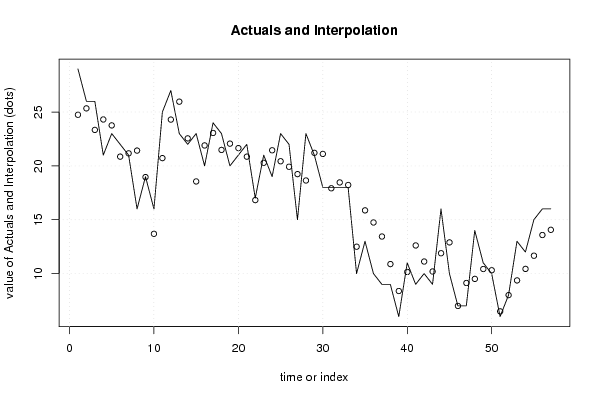
| Multiple Linear Regression - Actuals, Interpolation, and Residuals | |||
| Time or Index | Actuals | Interpolation Forecast | Residuals Prediction Error |
| 1 | 29 | 24.7447350564127 | 4.25526494358728 |
| 2 | 26 | 25.3400238129243 | 0.659976187075723 |
| 3 | 26 | 23.3386849610899 | 2.66131503891013 |
| 4 | 21 | 24.308618336703 | -3.30861833670302 |
| 5 | 23 | 23.7584258269041 | -0.758425826904108 |
| 6 | 22 | 20.8571358056061 | 1.14286419439391 |
| 7 | 21 | 21.1647820792644 | -0.164782079264363 |
| 8 | 16 | 21.4190062500065 | -5.4190062500065 |
| 9 | 19 | 18.9580058588779 | 0.041994141122085 |
| 10 | 16 | 13.6905784239437 | 2.30942157605629 |
| 11 | 25 | 20.7205437602123 | 4.27945623978767 |
| 12 | 27 | 24.2978945984748 | 2.70210540152518 |
| 13 | 23 | 25.9617432677395 | -2.96174326773950 |
| 14 | 22 | 22.5540966470171 | -0.554096647017124 |
| 15 | 23 | 18.5546942186782 | 4.44530578132176 |
| 16 | 20 | 21.8980987251173 | -1.89809872511731 |
| 17 | 24 | 23.0554900455845 | 0.94450995441554 |
| 18 | 23 | 21.4821469805358 | 1.51785301946424 |
| 19 | 20 | 22.0639077965079 | -2.06390779650795 |
| 20 | 21 | 21.6499357181698 | -0.649935718169819 |
| 21 | 22 | 20.8576922508333 | 1.14230774916668 |
| 22 | 17 | 16.8228819243539 | 0.177118075646127 |
| 23 | 21 | 20.2843393724868 | 0.715660627513198 |
| 24 | 19 | 21.4483302798886 | -2.4483302798886 |
| 25 | 23 | 20.4295549189053 | 2.57044508109473 |
| 26 | 22 | 19.916539167482 | 2.08346083251800 |
| 27 | 15 | 19.2353748597117 | -4.23537485971172 |
| 28 | 23 | 18.6434265541504 | 4.35657344584956 |
| 29 | 21 | 21.2104409160189 | -0.210440916018926 |
| 30 | 18 | 21.1088154999717 | -3.10881549997171 |
| 31 | 18 | 17.9184890538116 | 0.0815109461883505 |
| 32 | 18 | 18.4627964295813 | -0.462796429581278 |
| 33 | 18 | 18.2246413656285 | -0.224641365628473 |
| 34 | 10 | 12.4940170401174 | -2.49401704011738 |
| 35 | 13 | 15.8690842634628 | -2.86908426346284 |
| 36 | 10 | 14.7462783175761 | -4.74627831757605 |
| 37 | 9 | 13.4404576507068 | -4.44045765070679 |
| 38 | 9 | 10.8813088389438 | -1.88130883894384 |
| 39 | 6 | 8.3801825721868 | -2.38018257218679 |
| 40 | 11 | 10.149663597893 | 0.850336402107004 |
| 41 | 9 | 12.6108544977134 | -3.61085449771338 |
| 42 | 10 | 11.1178490357408 | -1.11784903574085 |
| 43 | 9 | 10.1949865687638 | -1.19498656876376 |
| 44 | 16 | 11.8893438458987 | 4.11065615410131 |
| 45 | 10 | 12.8965738374167 | -2.89657383741667 |
| 46 | 7 | 6.99252261158504 | 0.00747738841495471 |
| 47 | 7 | 9.12603260383803 | -2.12603260383803 |
| 48 | 14 | 9.50749680406052 | 4.49250319593948 |
| 49 | 11 | 10.4235091062357 | 0.57649089376428 |
| 50 | 10 | 10.3080315336328 | -0.308031533632758 |
| 51 | 6 | 6.49106338833338 | -0.49106338833338 |
| 52 | 8 | 8.00019278613623 | -0.000192786136232415 |
| 53 | 13 | 9.36478871377912 | 3.63521128622088 |
| 54 | 12 | 10.4340526781456 | 1.56594732185440 |
| 55 | 15 | 11.6578345016523 | 3.34216549834772 |
| 56 | 16 | 13.5789177563437 | 2.42108224365629 |
| 57 | 16 | 14.0630866872436 | 1.93691331275638 |
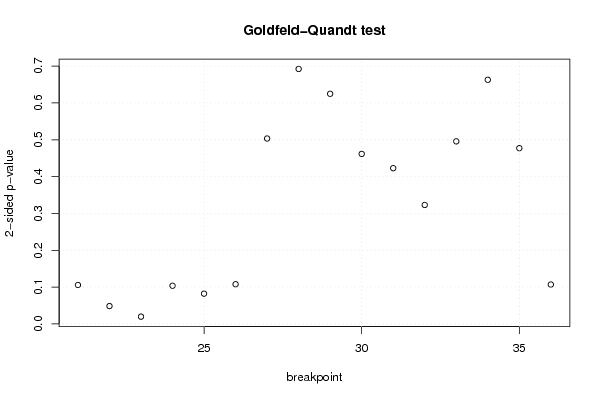
| Goldfeld-Quandt test for Heteroskedasticity | |||
| p-values | Alternative Hypothesis | ||
| breakpoint index | greater | 2-sided | less |
| 21 | 0.0528715942837869 | 0.105743188567574 | 0.947128405716213 |
| 22 | 0.0242391212564965 | 0.0484782425129931 | 0.975760878743503 |
| 23 | 0.00989240445240087 | 0.0197848089048017 | 0.990107595547599 |
| 24 | 0.0518647264654328 | 0.103729452930866 | 0.948135273534567 |
| 25 | 0.0411052985087476 | 0.0822105970174951 | 0.958894701491252 |
| 26 | 0.0539078459012571 | 0.107815691802514 | 0.946092154098743 |
| 27 | 0.251690294505052 | 0.503380589010105 | 0.748309705494948 |
| 28 | 0.34610356978254 | 0.69220713956508 | 0.65389643021746 |
| 29 | 0.312378969773004 | 0.624757939546009 | 0.687621030226996 |
| 30 | 0.230791753193729 | 0.461583506387458 | 0.769208246806271 |
| 31 | 0.21140493209738 | 0.42280986419476 | 0.78859506790262 |
| 32 | 0.161491625445853 | 0.322983250891706 | 0.838508374554147 |
| 33 | 0.247843083074216 | 0.495686166148433 | 0.752156916925784 |
| 34 | 0.331374981523709 | 0.662749963047417 | 0.668625018476291 |
| 35 | 0.761414159499419 | 0.477171681001161 | 0.238585840500581 |
| 36 | 0.946465190038663 | 0.107069619922674 | 0.053534809961337 |
| Meta Analysis of Goldfeld-Quandt test for Heteroskedasticity | |||
| Description | # significant tests | % significant tests | OK/NOK |
| 1% type I error level | 0 | 0 | OK |
| 5% type I error level | 2 | 0.125 | NOK |
| 10% type I error level | 3 | 0.1875 | NOK |